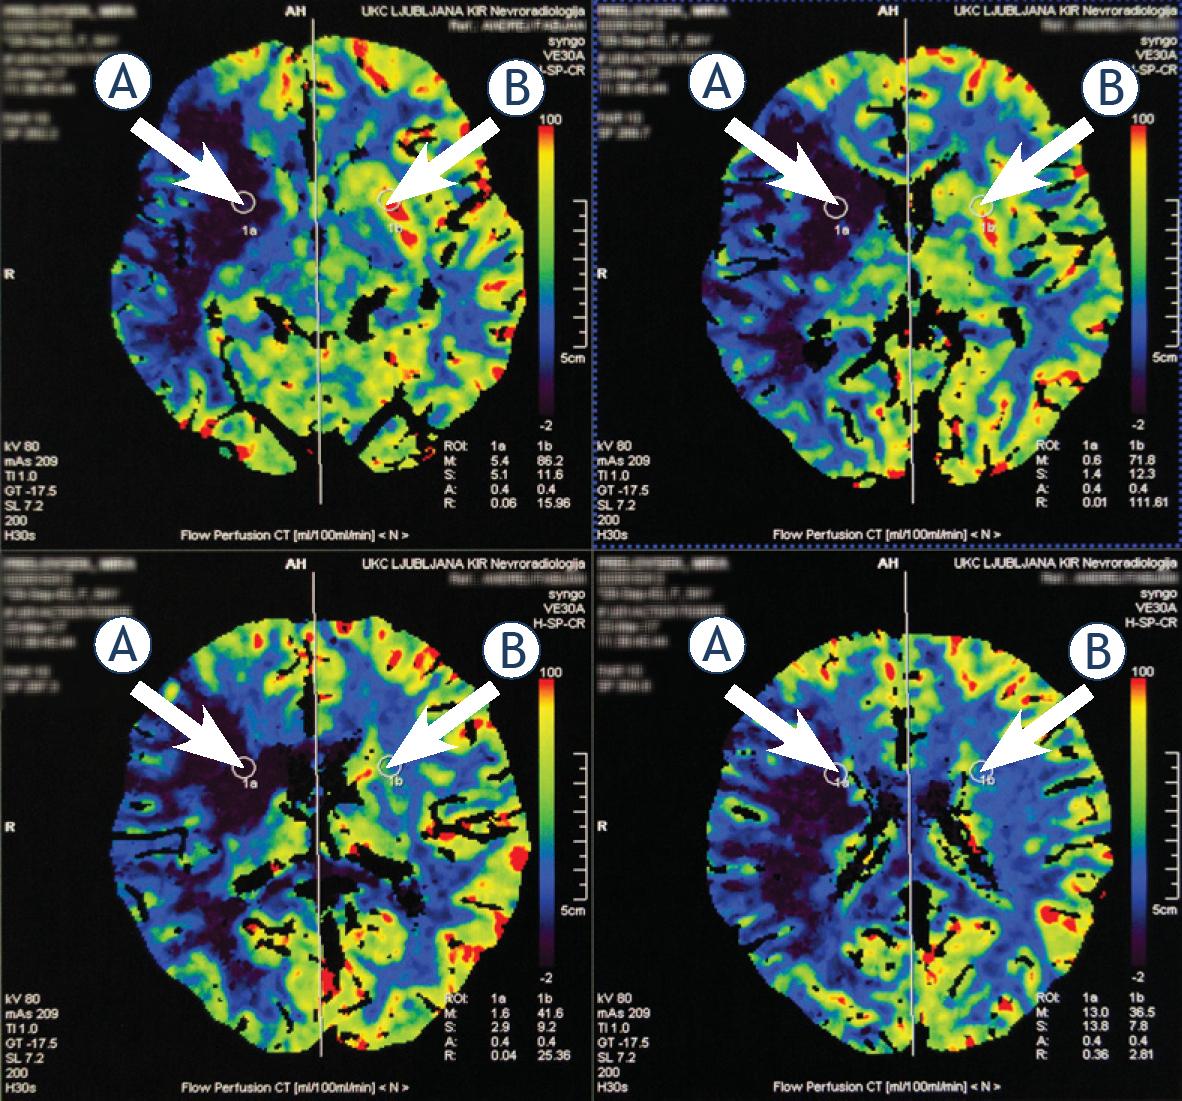
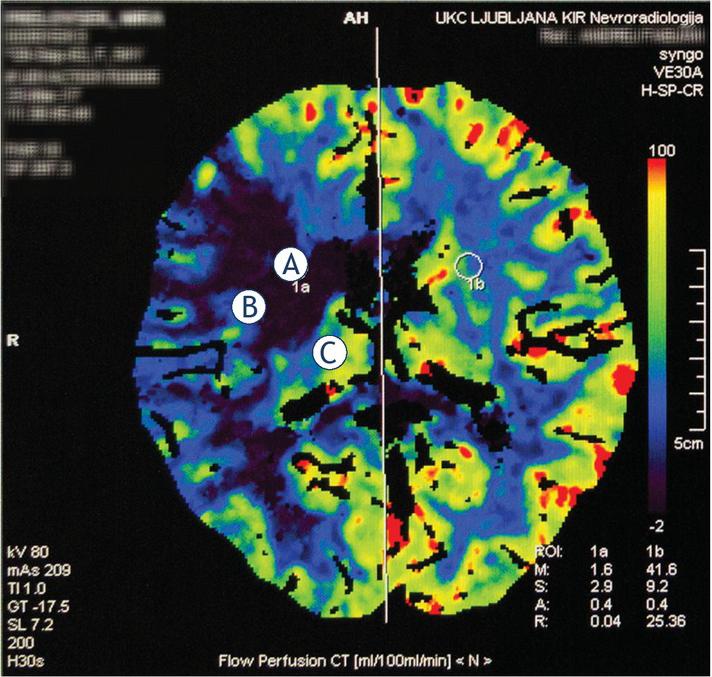
Have a personal or library account? Click to login
Infarct-core CT perfusion parameters in predicting post-thrombolysis hemorrhagic transformation of acute ischemic stroke Cover

Infarct-core CT perfusion parameters in predicting post-thrombolysis hemorrhagic transformation of acute ischemic stroke

Open Access
|Dec 2018

Figures & Tables

Figure 1

CT perfusion (CTP) in a 64-year old patient with acute ischemic stroke (AIS) in the territory supplied by the right middle cerebral artery (MCA). Four radiological slices correspond to different anatomical levels of image acquisition. (A) Hand-drawn region of interest (ROI) in the region of infarct core. (B) Automatically generated ROI of the asymptomatic contralateral hemisphere.

Figure 2

CT perfusion (CTP) in a 64-year old patient with acute ischemic stroke (AIS) in the territory supplied by the right middle cerebral artery (MCA). (A) Infarct core. (B) Penumbra. (C) Intact brain parenchyma.

Figure 3

Region of interest (ROI) curve of relative cerebral blood flow (rCBF) in patients with and without hemorrhagic transformation (HT). rCBF represents the CBF of the infarct core region normalized to the intact contralateral side. The cut-off point marks the threshold at which relative cerebral blood volume (rCBV) can predict HT with optimal sensitivity and specificity. Diagonal segments are produced by ties.

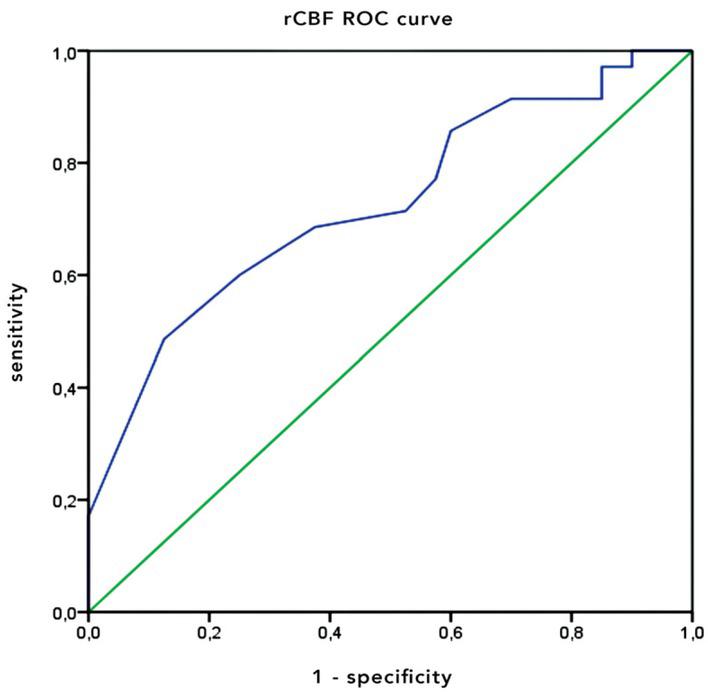
Region of interest (ROI) curve analysis results

AUCcut-off valuesensitivityspecificity
CBF [mL/100 g/min]0.6910.3562.0%35.0%
CBV [mL/100g]0.6761.6568.6%40.0%
rCBF0.7364.5%71.0%52.5%
rCBV0.7048.5%71.4%42.5%

Characteristics of study cohort

ParameterCasesControlsp value
CBF (mean (SD)) [mL/100 g/min]0.38 (0.47)0.98 (1.37)0.004
CBV (mean (SD)) [mL/100 g]1.45 (1.7)3.06 (2.99)0.009
MTT (mean (SD)) [s]4.27 (4.00)4.22 (3.26)0.718
rCBF (mean (SD))0.03 (0.05)0.10 (0.12)< 0.000
rCBV (mean (SD))0.07 (0.09)0.10 (0.12)0.001
rMTT (mean (SD))2.47 (2.05)2.36 (1.65)0.948
DOI: https://doi.org/10.2478/raon-2018-0048 | Journal eISSN: 1581-3207 | Journal ISSN: 1318-2099
Language: English
Page range: 25 - 30
Submitted on: Aug 26, 2018
|
Accepted on: Nov 11, 2018
|
Published on: Dec 20, 2018
In partnership with: Paradigm Publishing Services
Publication frequency: 4 issues per year

© 2018 Crt Langel, Katarina Surlan Popovic, published by Association of Radiology and Oncology
This work is licensed under the Creative Commons Attribution-NonCommercial-NoDerivatives 3.0 License.