
Table. 1
Elements of the cultural heritage in Korça city and the surrounding area (Menkshi 2014).
| Culture heritage | Types of cultural heritage |
|---|---|
| Tangible | Museums Tradicional buildings (houses, old bazzar) Religious object (churches, mosque) Archaeological site |
| Intangible | Music Traditions Traditional food Festivals (BeerFestival, religious festivals.) Crafts Hospitality |
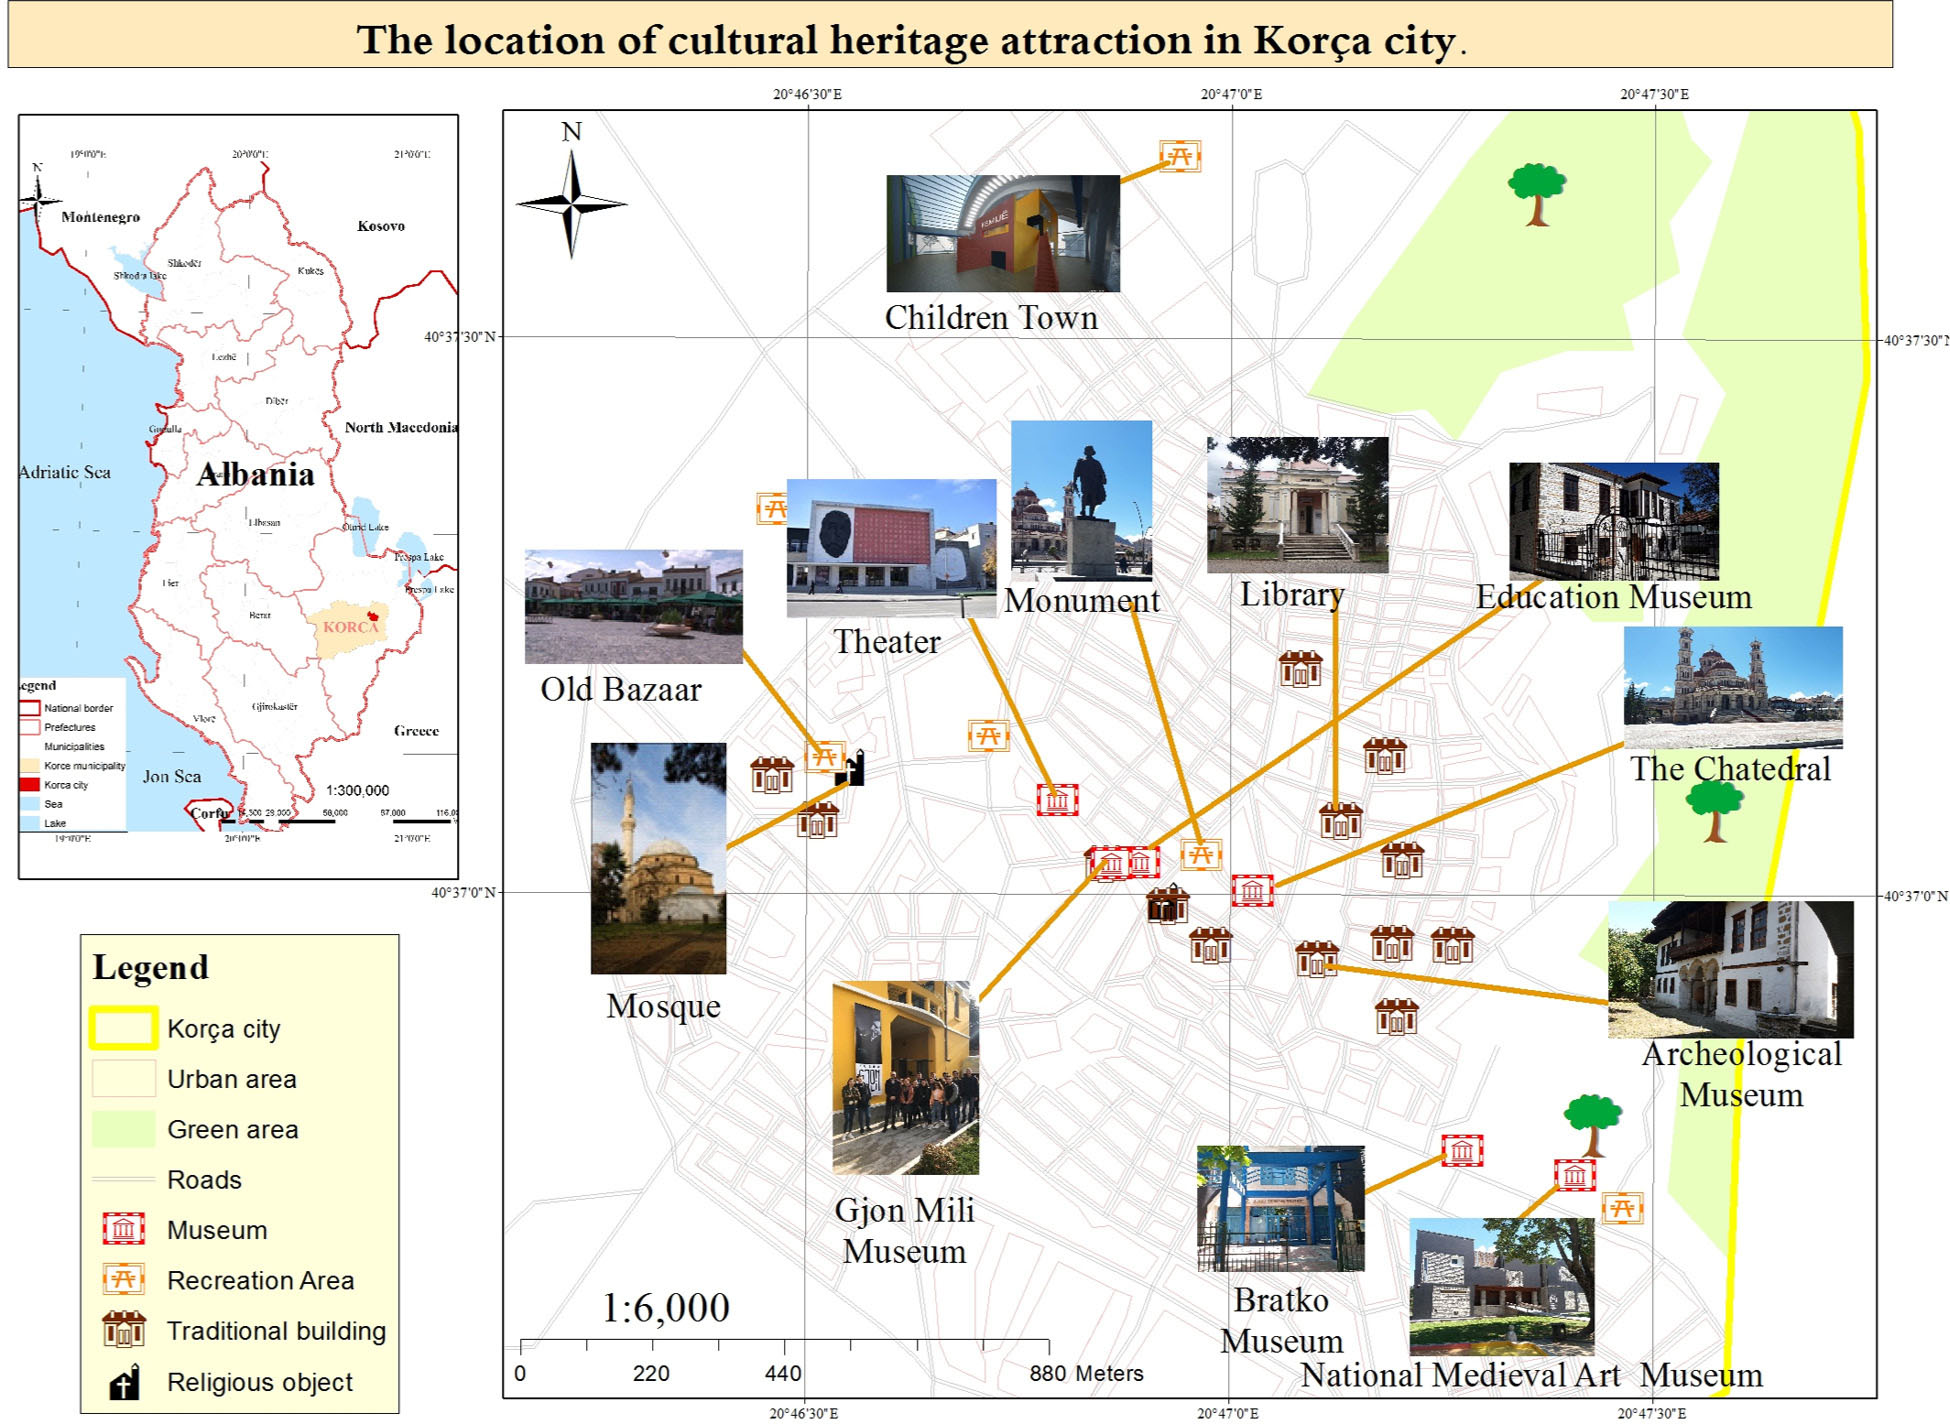
Fig. 1
The location of cultural heritage attractions in Korça city.
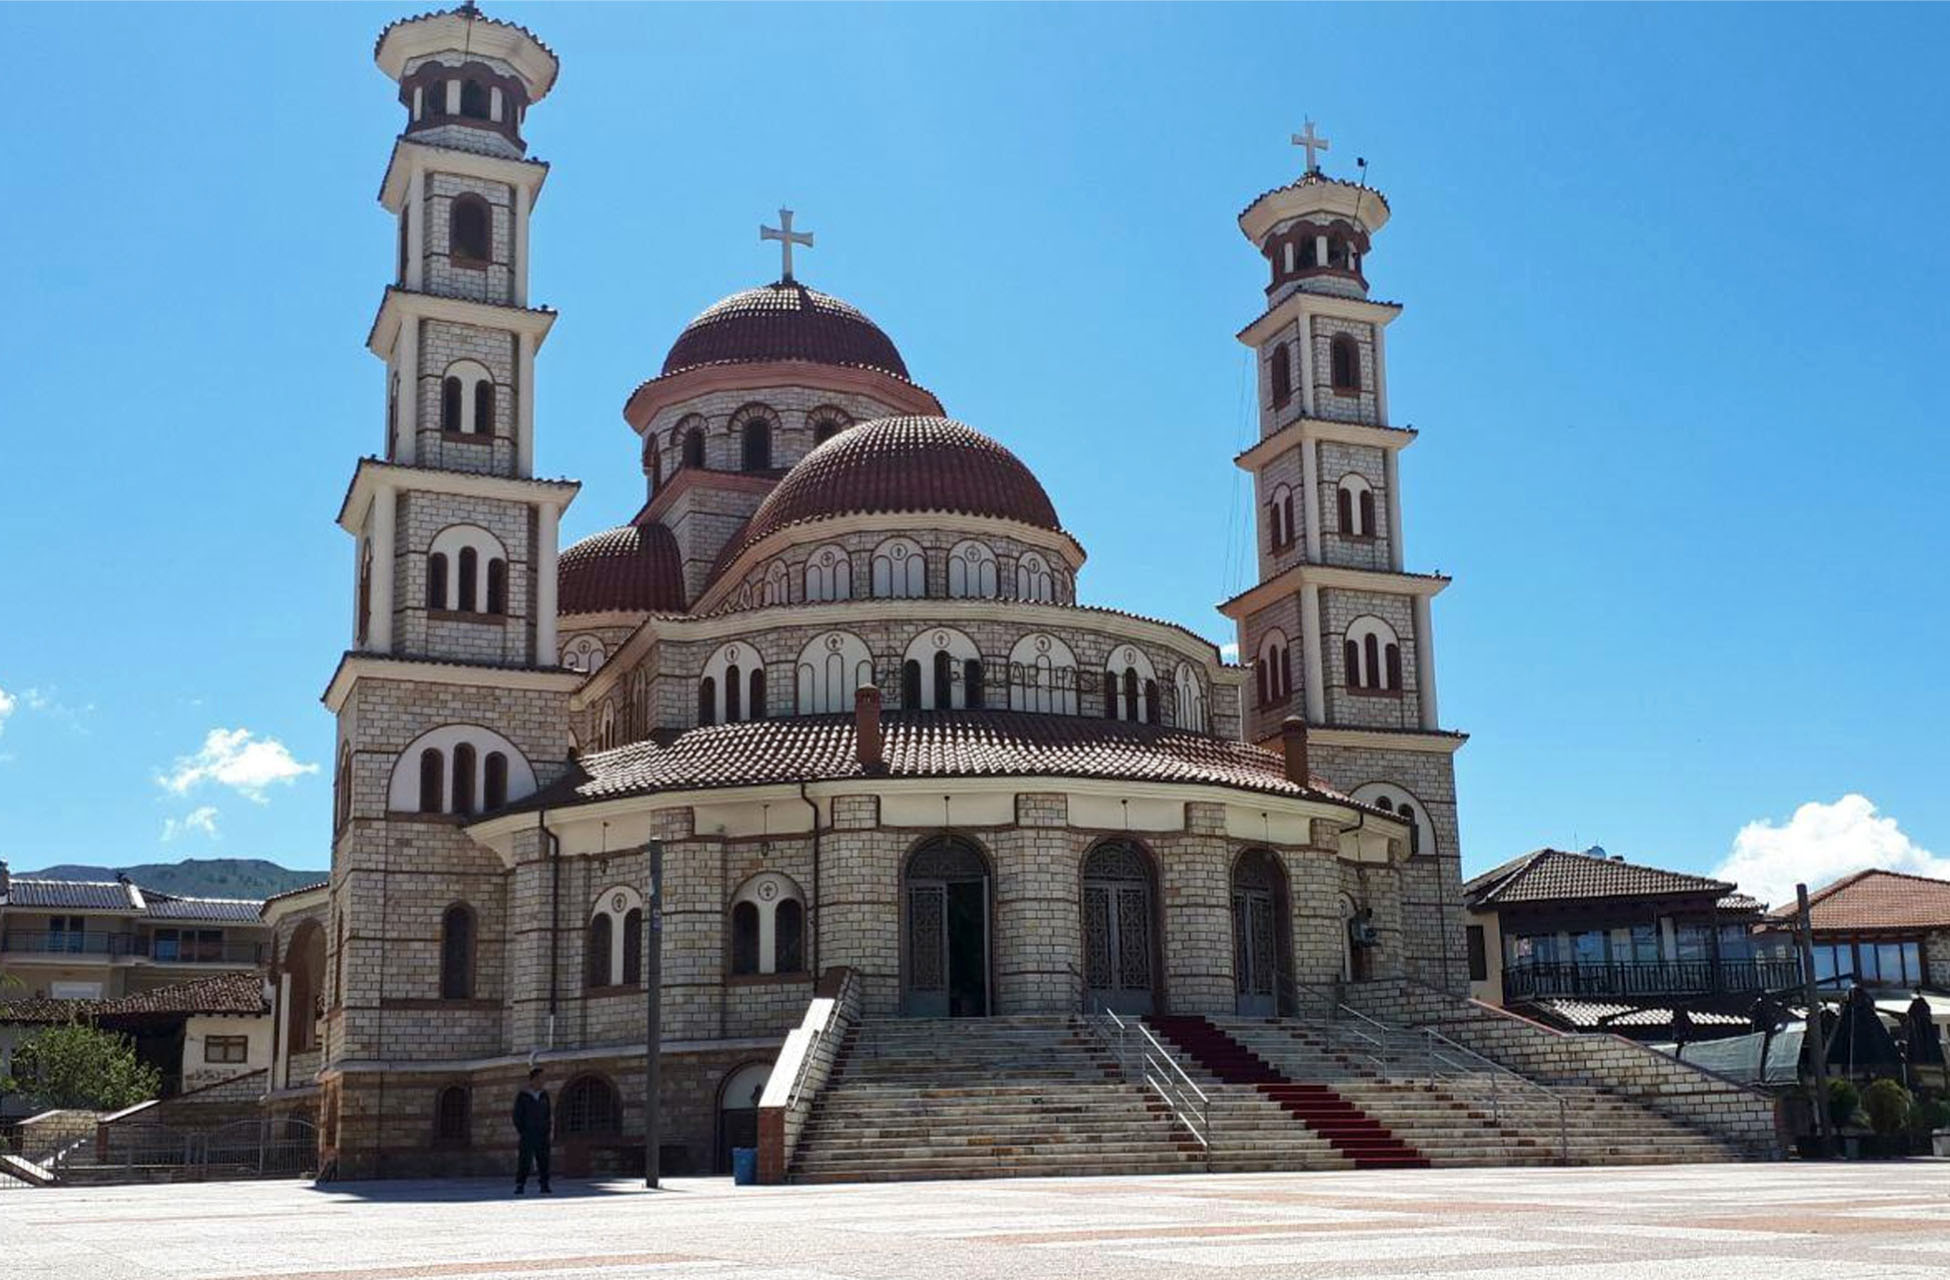
Fig. 2
The Ringjallja e Krishtit (Resurrection of Christ) Cathedral in the city of Korça.
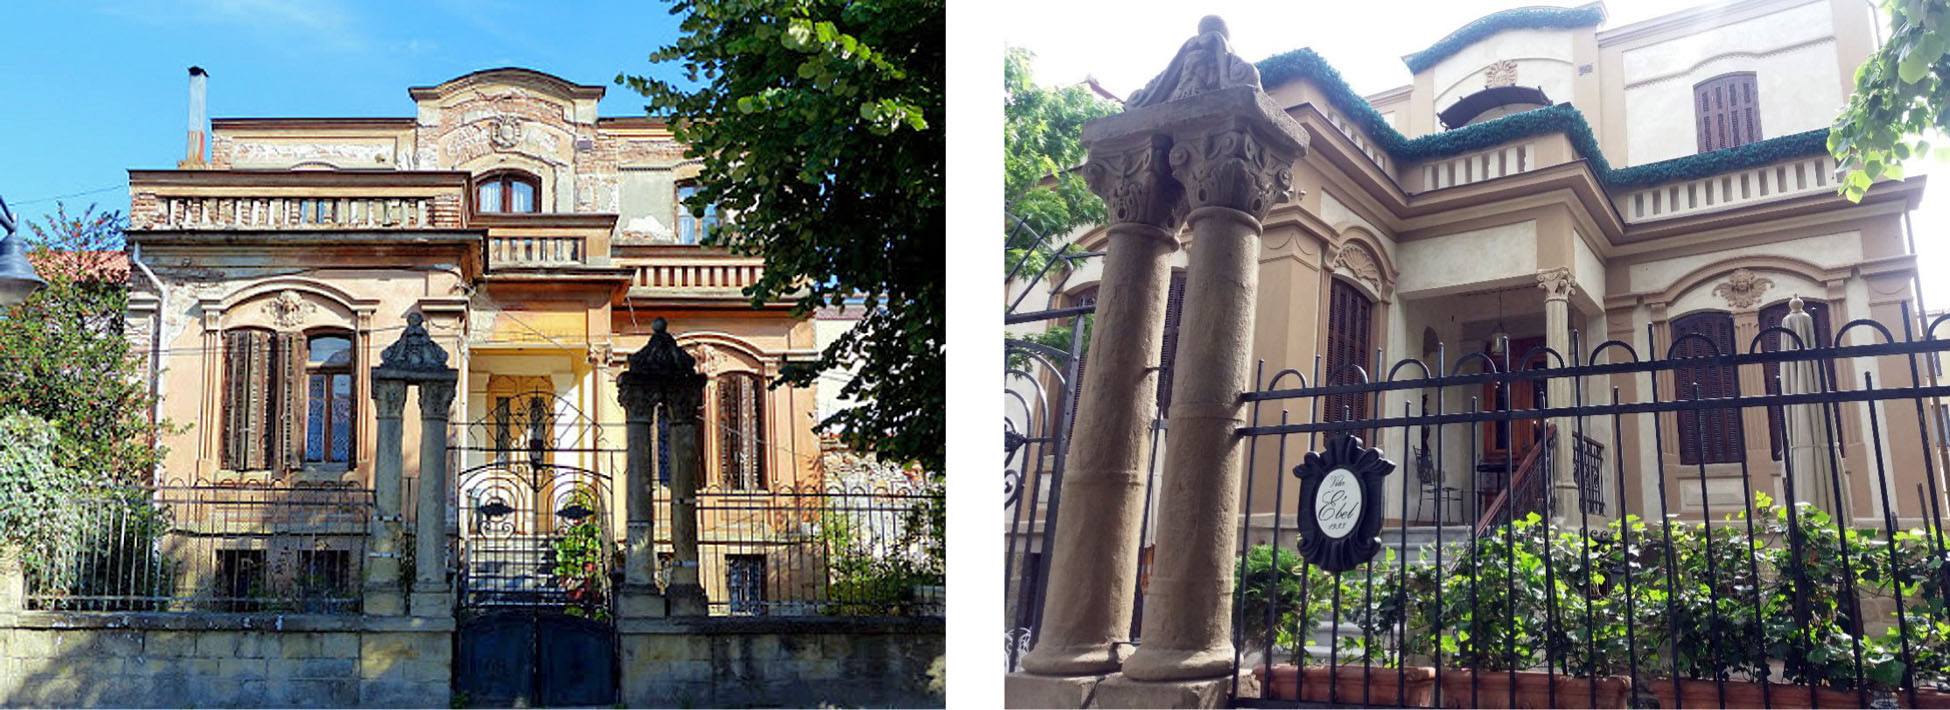
Fig. 3
A house building of 1933 before (left), actually Vila Ebel after restoration (right).
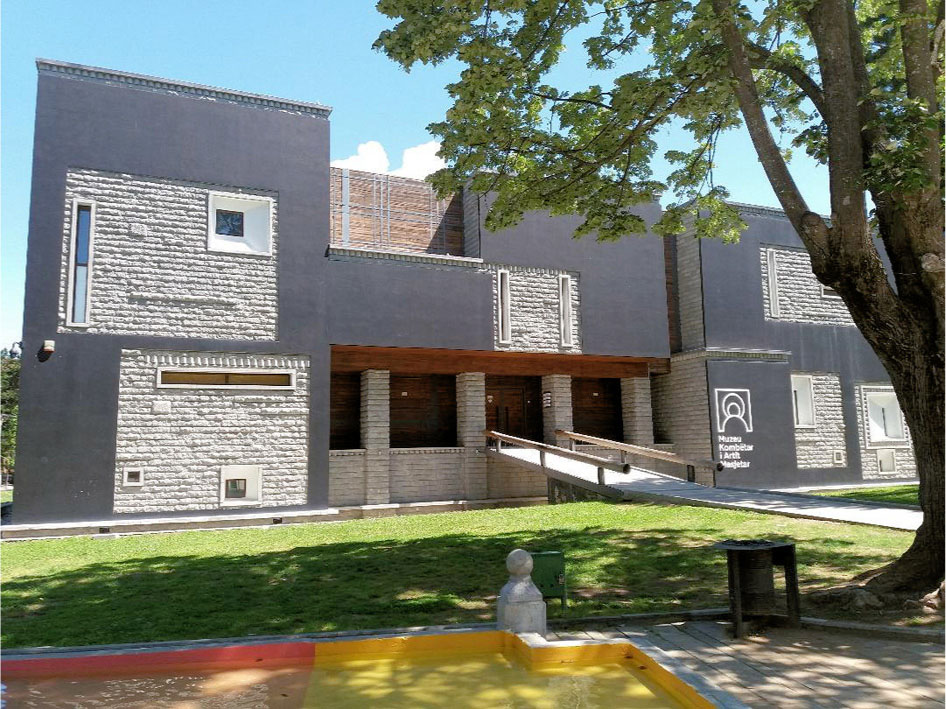
Fig. 4
National Museum of Medieval Art.
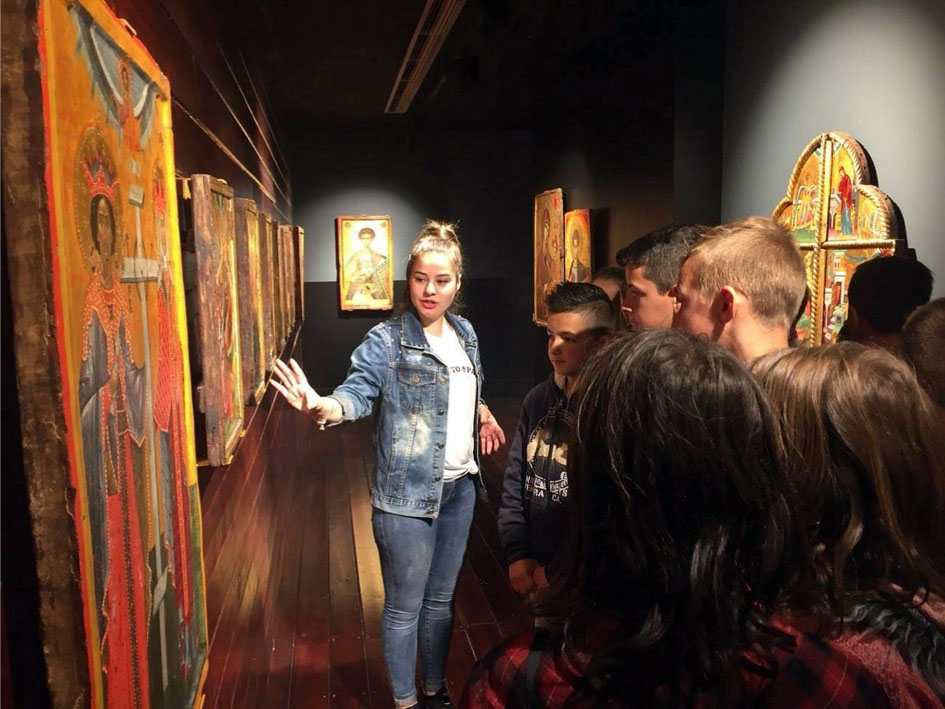
Fig. 5
A Geography student during voluntary practice in the museum.
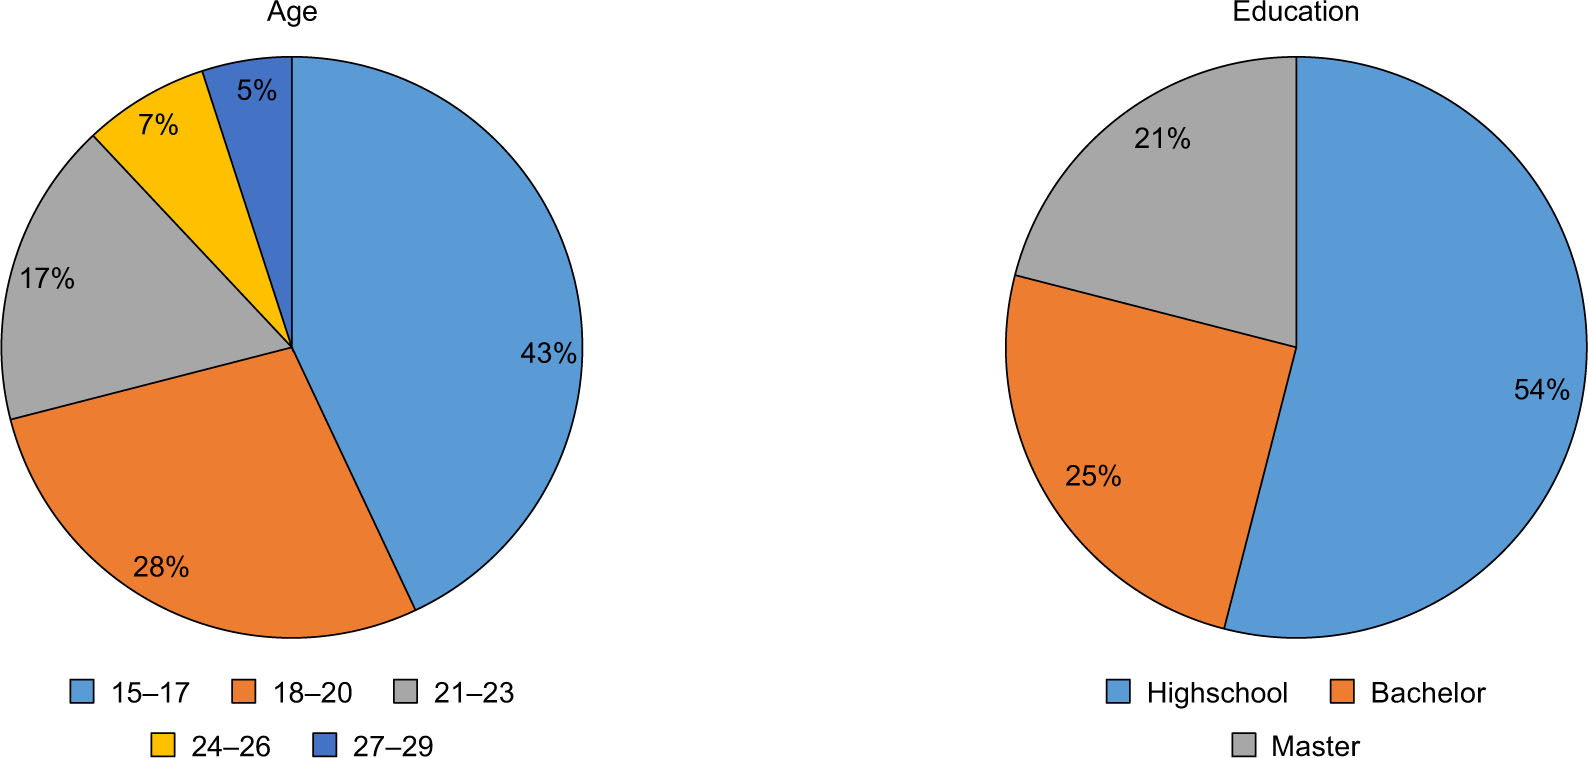
Fig. 6
Age and education level of respondents.
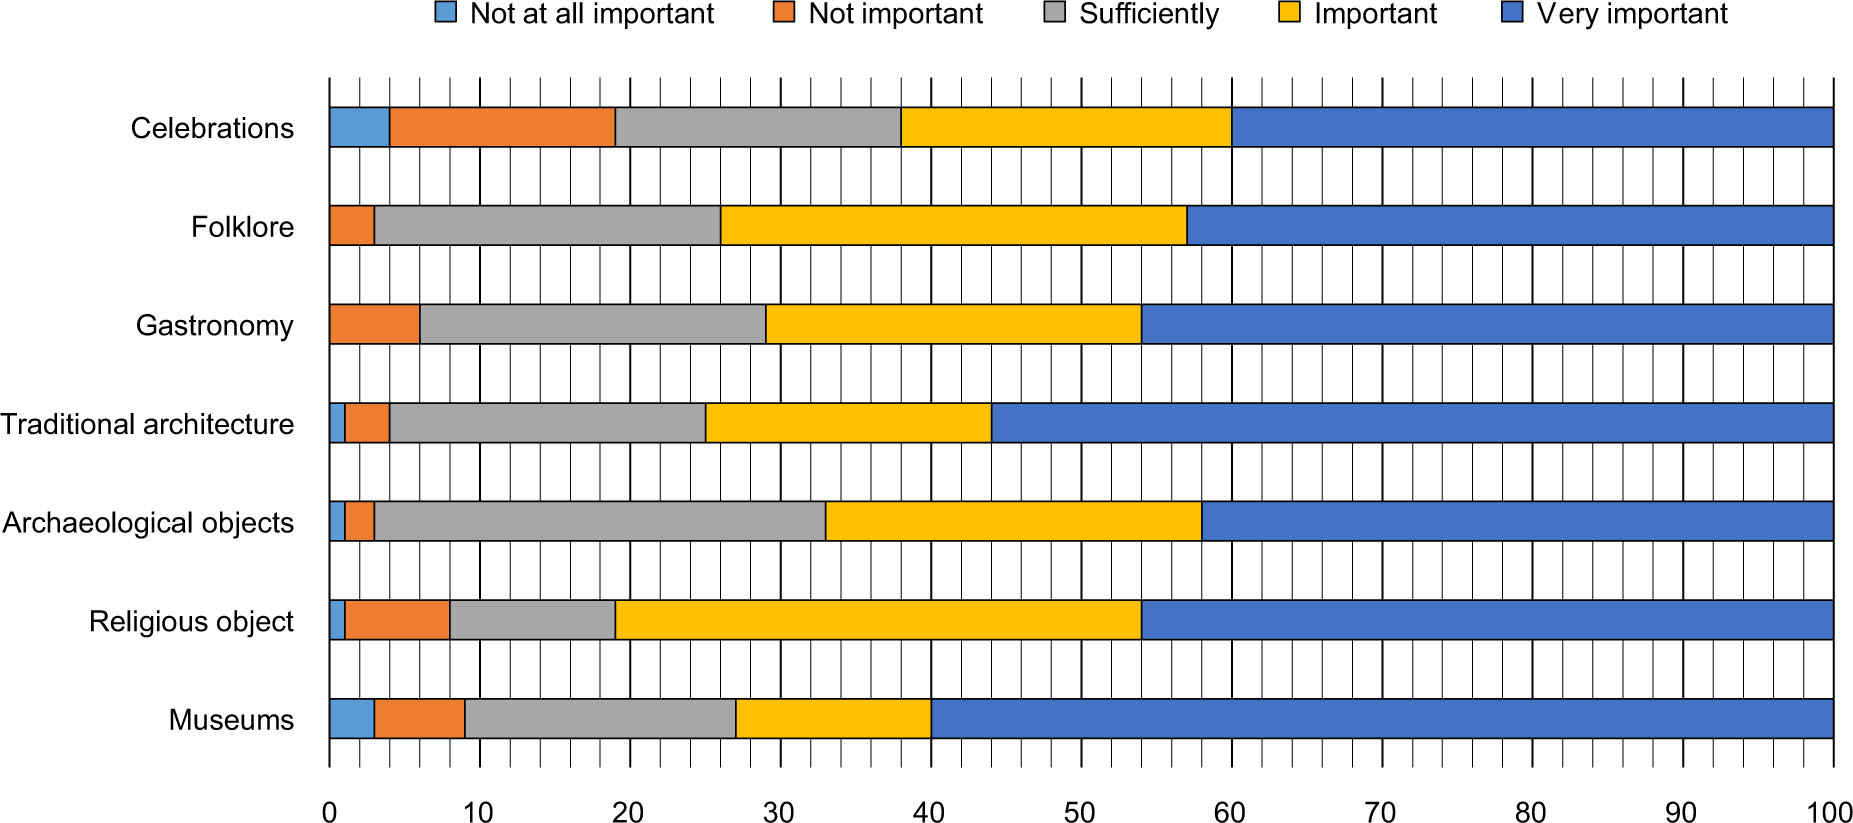
Fig. 7
Respondent's assessment of the importance of cultural attractions.
Table 3
Crosstabs table.
| Respondents’ assessment of the importance of the cultural attraction | Education Level | ||||||
|---|---|---|---|---|---|---|---|
| High school | Bachelor | Master | |||||
| [%] | |||||||
| Museums | Not at all important | 3 | 5.6 | 0 | 0 | 0 | 0.0 |
| Not important | 3 | 5.6 | 1 | 4 | 2 | 9.5 | |
| Sufficiently | 10 | 18.5 | 4 | 16 | 4 | 19.0 | |
| Important | 9 | 16.7 | 3 | 12 | 1 | 4.8 | |
| Very important | 29 | 53.7 | 17 | 68 | 14 | 66.7 | |
| Religious objects | Not at all important | 1 | 1.9 | 0 | 0 | 0 | 0.0 |
| Not important | 5 | 9.3 | 0 | 0 | 2 | 9.5 | |
| Sufficiently | 9 | 16.7 | 0 | 0 | 2 | 9.5 | |
| Important | 17 | 31.5 | 10 | 40 | 8 | 38.1 | |
| Very important | 22 | 40.7 | 15 | 60 | 9 | 42.9 | |
| Archaeological objects | Not at all important | 1 | 1.9 | 0 | 0 | 0 | 0.0 |
| Not important | 2 | 3.7 | 0 | 0 | 0 | 0.0 | |
| Sufficiently | 19 | 35.2 | 5 | 20 | 6 | 28.6 | |
| Important | 16 | 29.6 | 4 | 16 | 5 | 23.8 | |
| Very important | 16 | 29.6 | 16 | 64 | 10 | 47.6 | |
| Traditional architecture | Not at all important | 1 | 1.9 | 0 | 0 | 0 | 0.0 |
| Not important | 3 | 5.6 | 0 | 0 | 0 | 0.0 | |
| Sufficiently | 13 | 24.1 | 5 | 20 | 3 | 14.3 | |
| Important | 10 | 18.5 | 7 | 28 | 2 | 9.5 | |
| Very important | 27 | 50.0 | 13 | 52 | 16 | 76.2 | |
| Gastronomy | Not important | 6 | 11.1 | 0 | 0 | 0 | 0.0 |
| Sufficiently | 11 | 20.4 | 8 | 32 | 4 | 19.0 | |
| Important | 11 | 20.4 | 9 | 36 | 5 | 23.8 | |
| Very important | 26 | 48.1 | 8 | 32 | 12 | 57.1 | |
| Folklore | Not important | 3 | 5.6 | 0 | 0 | 0 | 0.0 |
| Sufficiently | 13 | 24.1 | 7 | 28 | 3 | 14.3 | |
| Important | 14 | 25.9 | 11 | 44 | 6 | 28.6 | |
| Very important | 24 | 44.4 | 7 | 28 | 12 | 57.1 | |
| Celebrations | Not at all important | 3 | 5.6 | 0 | 0 | 1 | 4.8 |
| Not important | 11 | 20.4 | 2 | 8 | 2 | 9.5 | |
| Sufficiently | 8 | 14.8 | 5 | 20 | 6 | 28.6 | |
| Important | 11 | 20.4 | 7 | 28 | 4 | 19.0 | |
| Very important | 21 | 38.9 | 11 | 44 | 8 | 38.1 | |
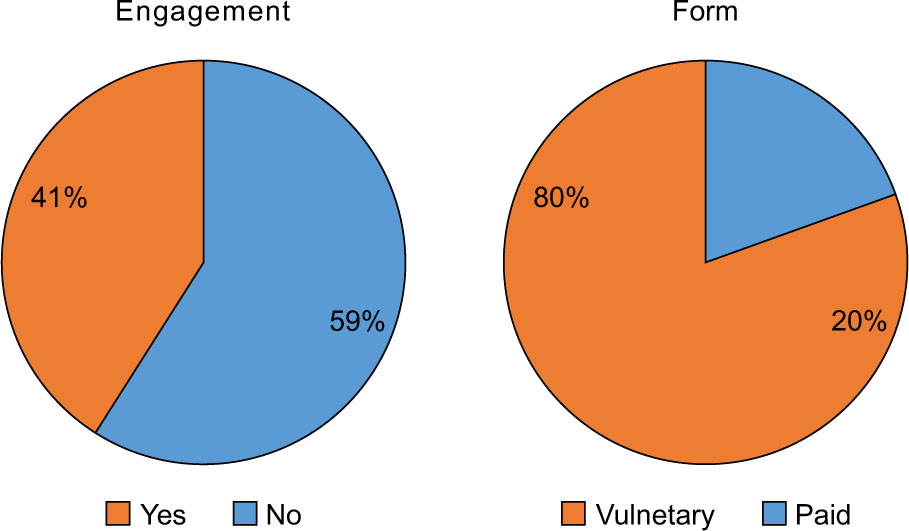
Fig. 8
The level of engagement of young people and the form of engagement.
Table 4
Ranks of perceived knowledge and abilities.
| Study program | N | Mean rank |
|---|---|---|
| High School | 21 | 14.21 |
| History–Geography | 14 | 29.68 |
| Administration and social policy | 2 | 24.50 |
| IT | 1 | 12.00 |
| Biology–Chemistry | 1 | 12.00 |
| Philosophy–Sociology | 2 | 24.50 |
| Total | 41 |
Table 5
Kruskal Wallis Test for perceived knowledge and abilities.
| Chi-Square | 18.497 |
|---|---|
| Df | 5 |
| Asymp. Sig. | 0.002 |
| a. Grouping Variable: Study program | |
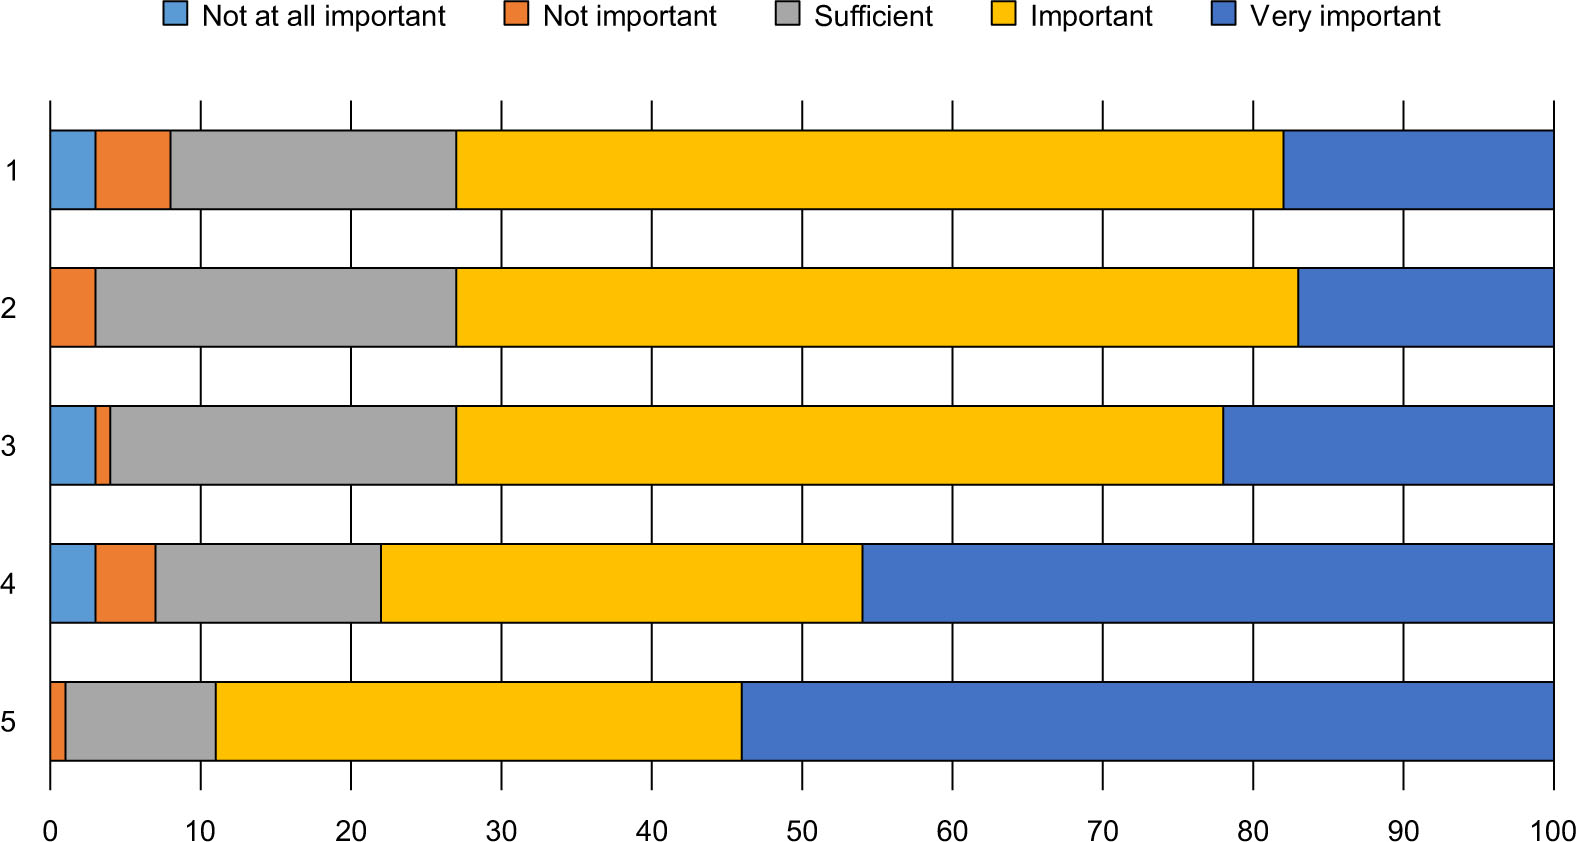
Fig. 9
Respondents assessment of factors that may increase their engagement.
1 – expanding the knowledge in the respective study program, 2 – integrating more knowledge in other related programs, 3 – expanding the knowledge in the lowest levels of education, 4 – more trainings, workshops, field trips etc., 5 – more encouragement from the local government and other organisation to take part in activities and projects.