
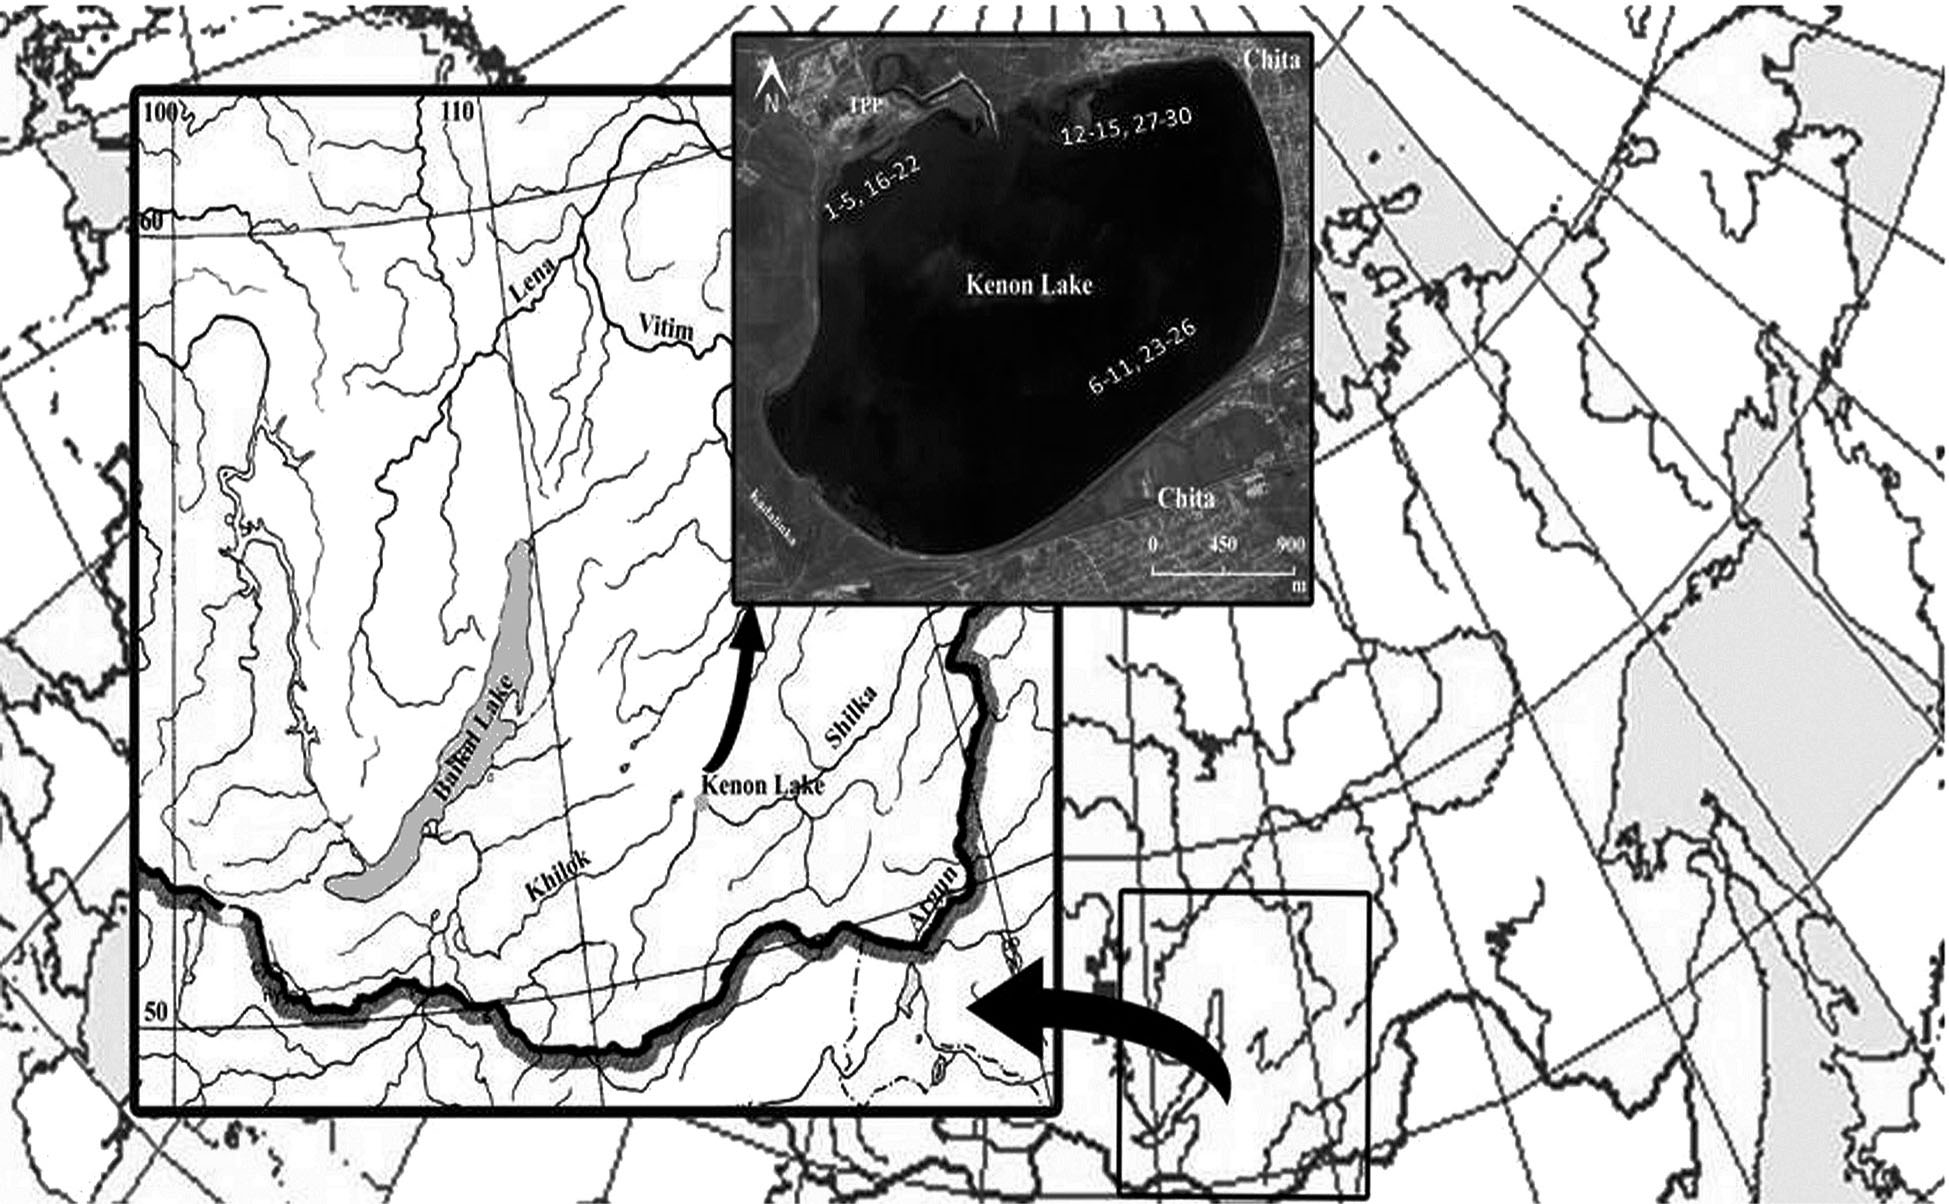
Fig. 1
Study area and stations where samples were collected.
I – Perca fluviatus (1–15: 1–5 – material selected at the TPP station; 6–11 – materials selected at the Neftebaza station; 12–15 – materials selected at the KSK station); II – Carassius auratus gibelio (16–30: 16–22 – materials selected at the TPP station; 23–26 – materials selected at the Neftebaza station; 27–30 – materials selected at the KSK station).
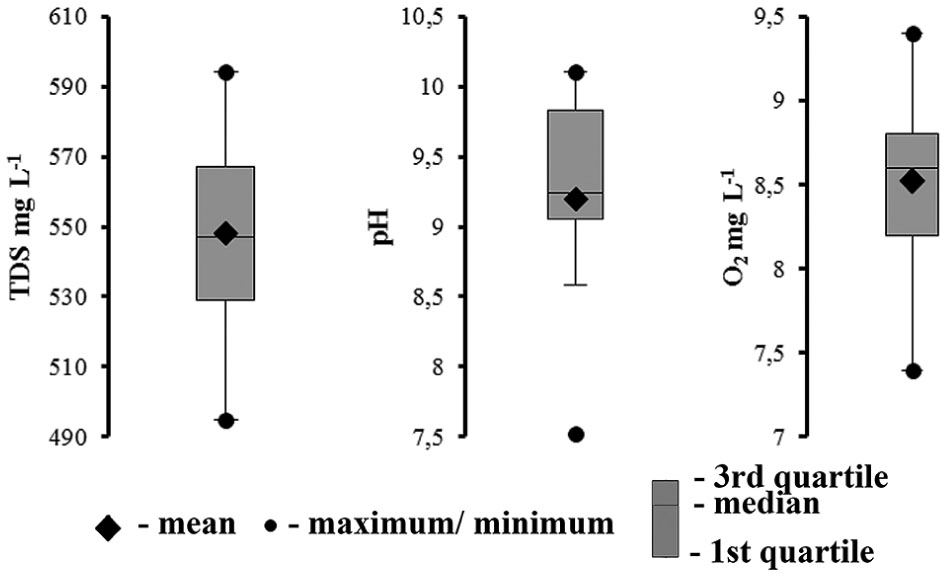
Fig. 2
Box plots depicting the selected parameters of water quality in Lake Kenon.
Table 1
Dominantions of water (mg/L−1) in Lake Kenon in years 2000–2018.
| Parameter | Na+ | K+ | Mg2+ | Ca2+ | HCO3− | Cl− | TDS | |
|---|---|---|---|---|---|---|---|---|
| Minimum | 49.3 | 2.1 | 36.8 | 48.1 | 93 | 196.9 | 68.1 | 495 |
| Mean | 54.4 ± 12.0 | 2.2 ± 0.1 | 42.5 ± 9.6 | 55.0 ± 14.2 | 131.8 ± 49.5 | 225.2 ± 87.8 | 55.0 ± 12.1 | 548 ± 64.4 |
| Maximum | 60.2 | 2.2 | 47.2 | 64.8 | 164.7 | 239.2 | 33.1 | 594 |
Table 2
Selected morphometrical and biological characteristics of the fishes collected in Lake Kenon.
| Species | Weight range (mean) | Length range (mean) | Age | Number of individuals | Male / Female |
|---|---|---|---|---|---|
| [g] | [cm] | [years] | |||
| Carassius auratus gibelio | 76–246 (169) | 13–19 (16) | 4+ – 5+ | 15 | 5♂/10♀ |
| Perca fluviatilis | 44–100 (73) | 13–18 (15) | 3+ – 4+ | 15 | 6♂/9♀ |
Table 3
Results of analysis (μg g−1) of standard reference material (BOk-2) in comparison with certified values.
| Metal [n = 6] | Limit of quantification | SRM, Baikal perch tissue, BOk-2 | Measured BOk-2 | Recovery [%] |
|---|---|---|---|---|
| Cr | 5.100 | 0.80 ± 0.1 | 0.29 | 36 |
| Mn | 0.050 | 1.70 ± 0.3 | 2.10 | 123 |
| Cu | 0.040 | 1.90 ± 0.3 | 1.10 | 58 |
| Zn | 0.070 | 23.00 ± 2.0 | 23.00 | 100 |
| Hg | 0.160 | 0.50 ± 0.2 | 0.39 | 78 |
| Pb | 0.012 | 0.37 ± 0.1 | 0.26 | 70 |
Table 4
The concentrations of chemical elements in the aquatic environment, bottom sediments, and food organisms of the fishes in Lake Kenon.
| Ñomponents | Unit | Cr | Mn | Cu | Zn | Hg | Pb |
|---|---|---|---|---|---|---|---|
| Water | |||||||
| n = 20 | μg L−1 | 1 | 4.00 | 0.86 | 2.70 | 0.18 | 0.16 |
| SD | 0 | 1.78 | 0.11 | 1.04 | 0.08 | 0.07 | |
| MPL | μg L−1 | 1 | 10.00 | 5.00 | 10.00 | 0.10 | 6.00 |
| EPA | μg L−1 | 50 | 50.00 | 1.00 | 5.00 | 2.00 | 50.00 |
| Bottom sediments | |||||||
| damp 70%, n = 25 | μg kg−1 | 13874 | 33 | 24535 | 43243 | 25 | 12072 |
| SD | 2114 | 10 | 3351 | 3694 | 20 | 2375 | |
| Ccrust | μg kg−1 | 100000 | 900000 | 55000 | 70000 | 70 | 14000 |
| The food organisms from the stomach of the fish | |||||||
| Chara sp. n = 10 | μg kg−1 | 200 | 170563 | 1066 | 3488 | 5 | 320 |
| SD | 94 | 1232 | 255 | 1144 | 2 | 81 | |
| Amphipods, n = 7 | μg kg−1 | 86 | 4920 | 9970 | 10400 | 16 | 70 |
| SD | 15 | 303 | 117 | 1130 | 8 | 16 | |
| Chironomus spp., n = 7 | μg kg−1 | 500 | 23500 | 3570 | 14900 | 7 | 464 |
| SD | 30 | 1810 | 160 | 5200 | 1 | 20 | |
| DL, biota | μg kg−1 | 20 | 50 | 40 | 70 | 4 | 10 |
[i] SD – standard deviation, MPL - the maximum permissible limits (approved by the Order of Federal Fishery Agency of the RF No. 20 as of January 18, 2010), EPA – Environmental Protection Agency (EPA 2002), Ccrust – elements clarke in the Earth's crust (Kabata-Pendias and Mukherjee 2007), DL – the detection limit of the method.
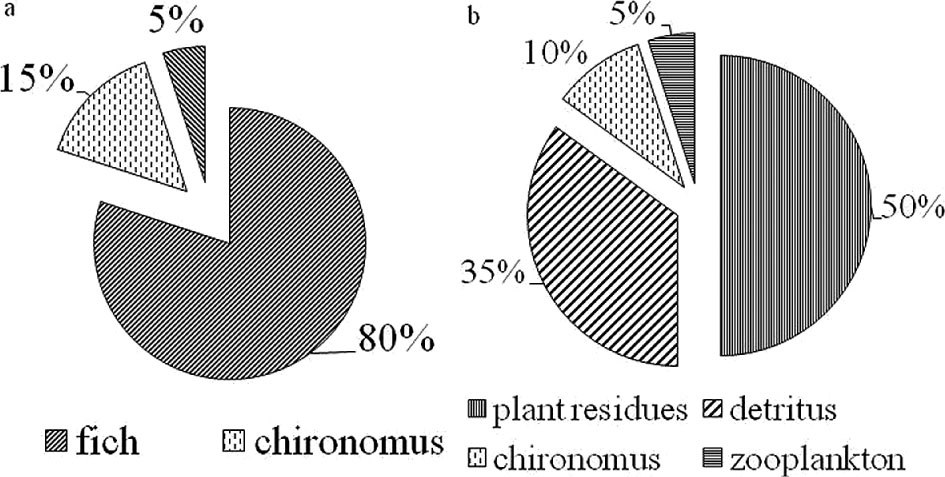
Fig. 3
The feed preferences of the dominant fishes of Lake Kenon.
a – P. fluviatus; b – C. auratus gibelio.
Table 5
Chemical elements in the fishes (N=10) of Lake Kenon (mg kg−1 of dry matter).
| Fish species | Cr | Mn | Cu | Zn | Hg | Pb |
|---|---|---|---|---|---|---|
| In the muscles | ||||||
| P. fluviatus | 0.18 ± 0.03 | 0.85 ± 0.15 | 0.91 ± 0.13 | 30.8 ± 4.36 | 0.47 ± 0.17 | 0.73 ± 0.10 |
| C. auratus gibelio | 0.23 ± 0.06 | 1.00 ± 0.25 | 1.20 ± 0.37 | 82.5 ± 56.00 | 0.27 ± 0.11 | 0.58 ± 0.09 |
| MPL | 1.00 | 1.00 | 10.00 | 40.00 | 0.30 | 1.00 |
| EPA | – | 0.05 | 1.00 | 5.00 | – | 0.05 |
| In the food components of the fish stomach | ||||||
| P. fluviatus | 0.029 ± 0.004 | 277 ± 14.5 | 18.7 ± 6.2 | 179.9 ± 54.9 | 0.55 ± 0.08 | 0.19 ± 0.06 |
| C. auratus gibelio | 13.60 ± 4.21 | 485 ± 53.0 | 80.8 ± 14.5 | 673.5 ± 167.8 | 0.45 ± 0.01 | 3.07 ± 0.03 |
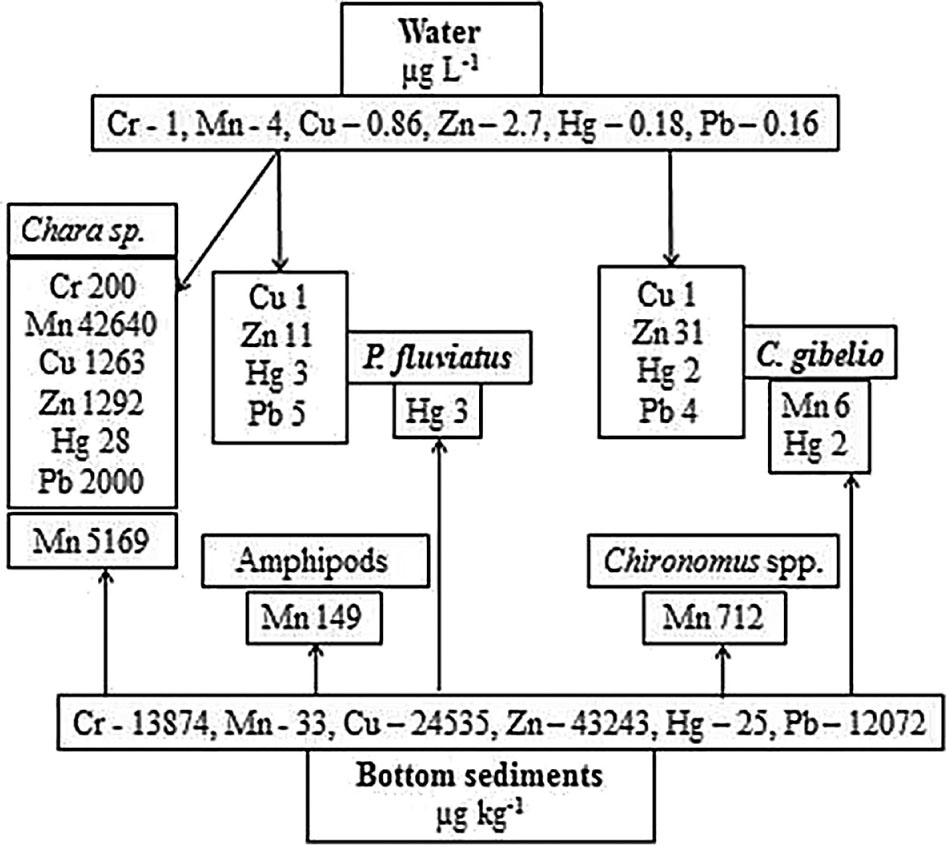
Fig. 4
Bioaccumulation factors in the ecosystem of the Lake Kenon (values – n times).
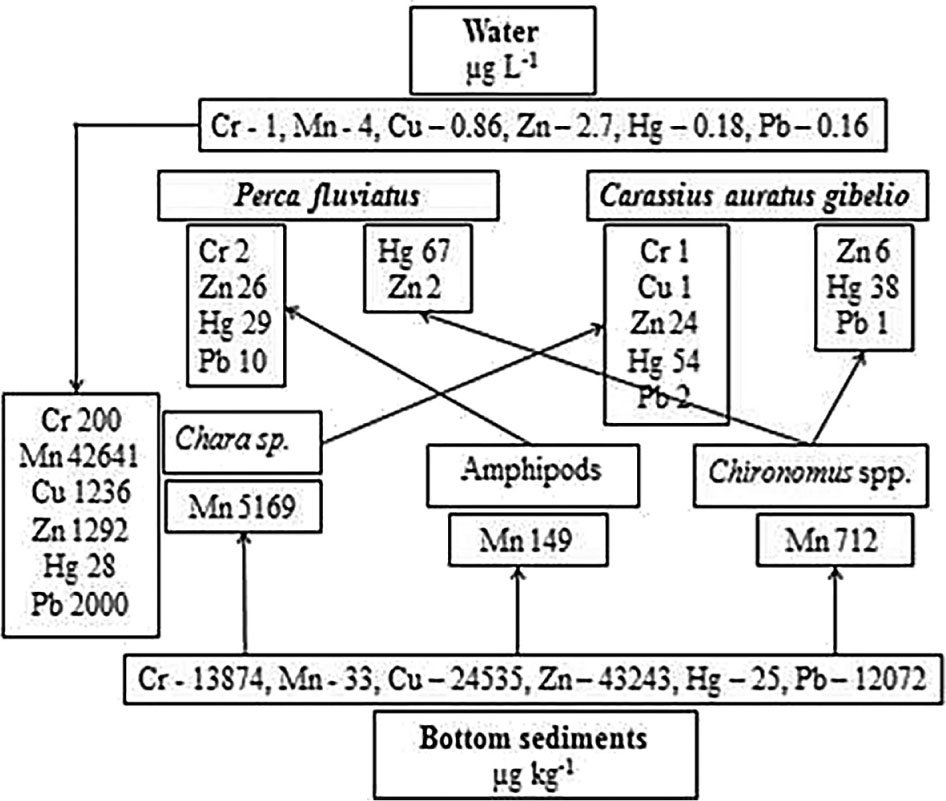
Fig. 5
Factors of trophic magnification in the ecosystem of the Lake Kenon.
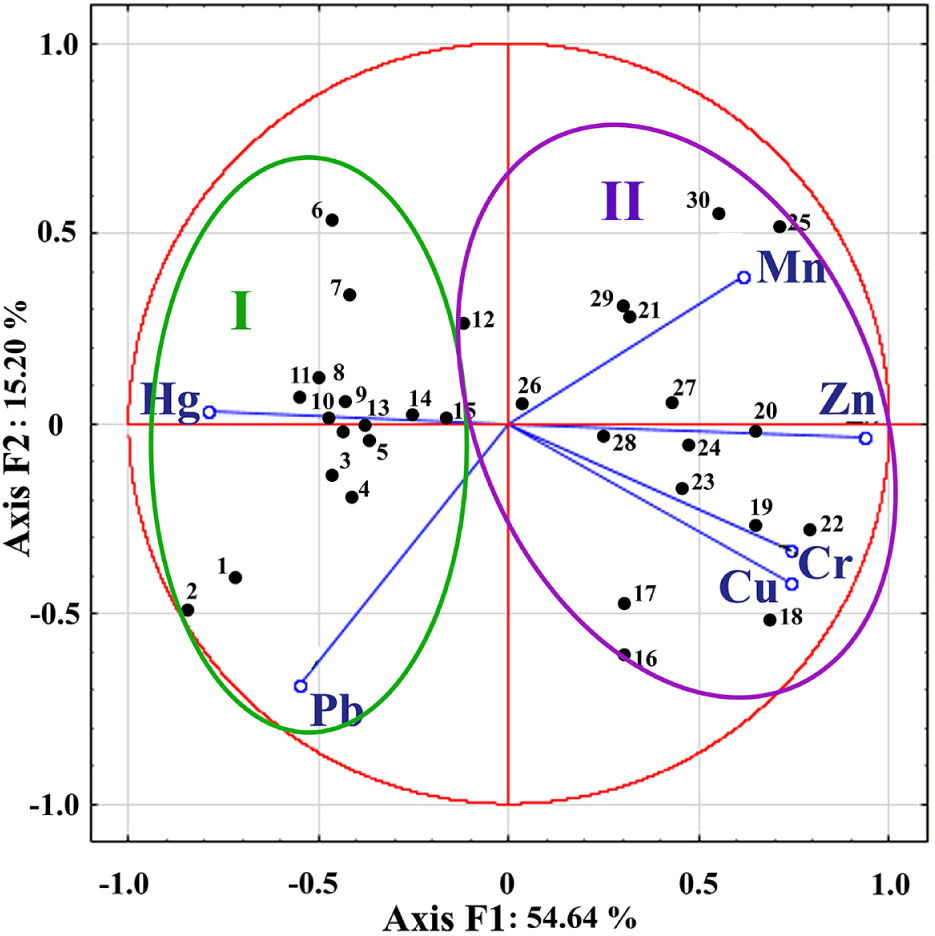
Fig. 6
Correlation of heavy metals in the muscles with fish species in the space of latent variables
I – Perca fluviatus (1–15: 1–5 – samples collected at the station of the thermal power plant; 6–11 – samples collected at the station “Neftebaza”; 12–15 – samples collected at the station “KSK”); II – Carassius auratus gibelio (16–30: 16–22 – samples collected at the station of the thermal power plant; 23–26 – samples collected at the station “Neftebaza”; 27–30 – samples, collected at the station “KSK”).