
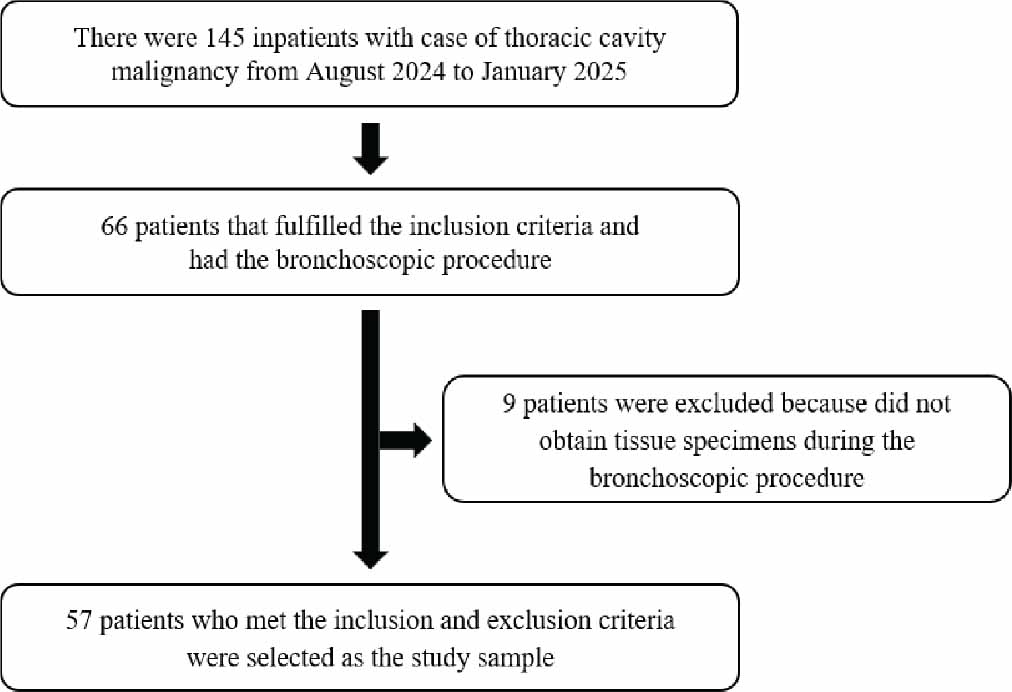
Figure 1.
Research sample selection.
Table 1.
Characteristics of research subjects
| Variables | N | % |
|---|---|---|
| Age (years) | ||
| • ≤40 | 5 | 8.77 |
| • >40 | 52 | 91.23 |
| Gender | ||
| • Male | 38 | 66.67 |
| • Female | 19 | 33.33 |
| BMI (kg/m2) | ||
| • Underweight | 28 | 49.12 |
| • Normoweight | 20 | 35.09 |
| • Overweight | 4 | 7.02 |
| • Obesity class I | 4 | 7.02 |
| • Obesity class II | 1 | 1.75 |
| Smoking status | ||
| • Non-smoker | 19 | 33.33 |
| • Mild brinkman index | 3 | 5.26 |
| • Medium brinkman index | 6 | 10.53 |
| • Severe brinkman index | 29 | 50.88 |
| History of pulmonary disease | ||
| • None | 29 | 50.88 |
| • Former TB | 5 | 8.77 |
| • COPD | 23 | 40.35 |
| Comorbidity | ||
| • None | 38 | 66.67 |
| • Hypertension | 12 | 21.05 |
| • Diabetes mellitus type 2 | 4 | 7.02 |
| • Heart failure | 4 | 7.02 |
| • Stroke | 1 | 1.75 |
| • Autoimmune disease | 1 | 1.75 |
| Drug history | ||
| • None | 17 | 29.82 |
| • Bronchodilators with/without inhaled | 23 | 40.35 |
| corticosteroids | ||
| • Anti-tuberculosis drugs | 5 | 8.77 |
| • Anti-hypertensives | 16 | 28.07 |
| • Anti-diabetics | 4 | 7.02 |
| • Oral corticosteroids | 1 | 1.75 |
| Clinical symptoms | ||
| • Shortness of breath | 23 | 40.35 |
| • Chest pain | 47 | 82.46 |
| • Chronic cough | 48 | 84.21 |
| • Haemoptysis | 5 | 8.77 |
| Cancer pain degree | ||
| • No pain | 10 | 17.54 |
| • Mild | 17 | 29.82 |
| • Moderate | 26 | 45.61 |
| • Severe | 4 | 7.02 |
| Types of thoracic cavity malignancy | ||
| • Lung cancer | 52 | 91.23 |
| • Mediastinal tumour | 2 | 3.51 |
| • Lung tumour metastasis | 3 | 5.26 |
| Pathology anatomy results | ||
| • Cancer type unknown | 16 | 28.07 |
| • Adenocarcinoma | 21 | 36.84 |
| • Squamous cell carcinoma | 14 | 24.56 |
| • Neuroendocrine carcinoma | 3 | 5.26 |
| • Tumour metastasis in lungs | 3 | 5.26 |
| Fungal culture results | ||
| • Positive culture | 44 | 77.19 |
| • Negative culture | 13 | 21.81 |
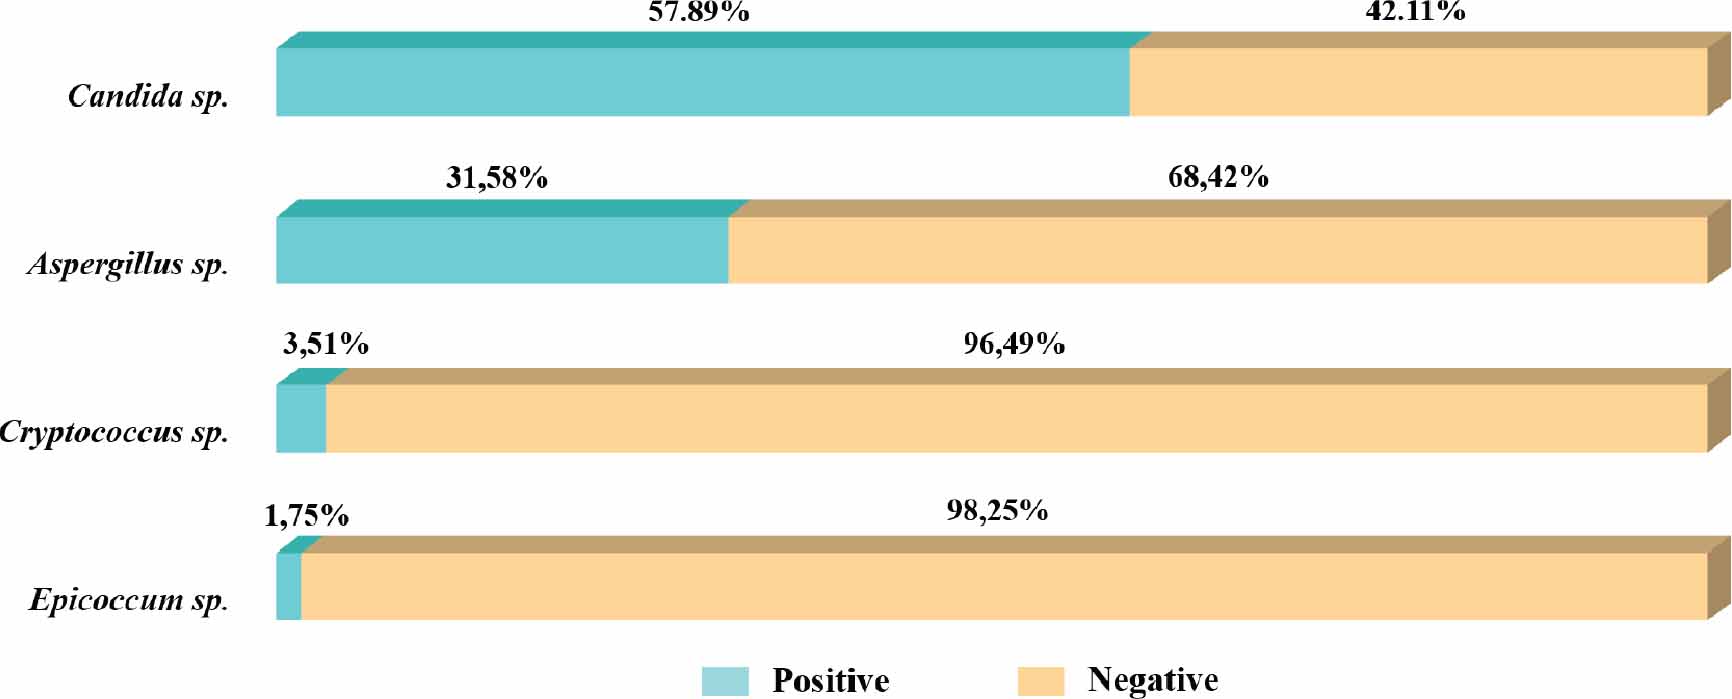
Figure 2.
Fungus positivity rates based on research subjects.
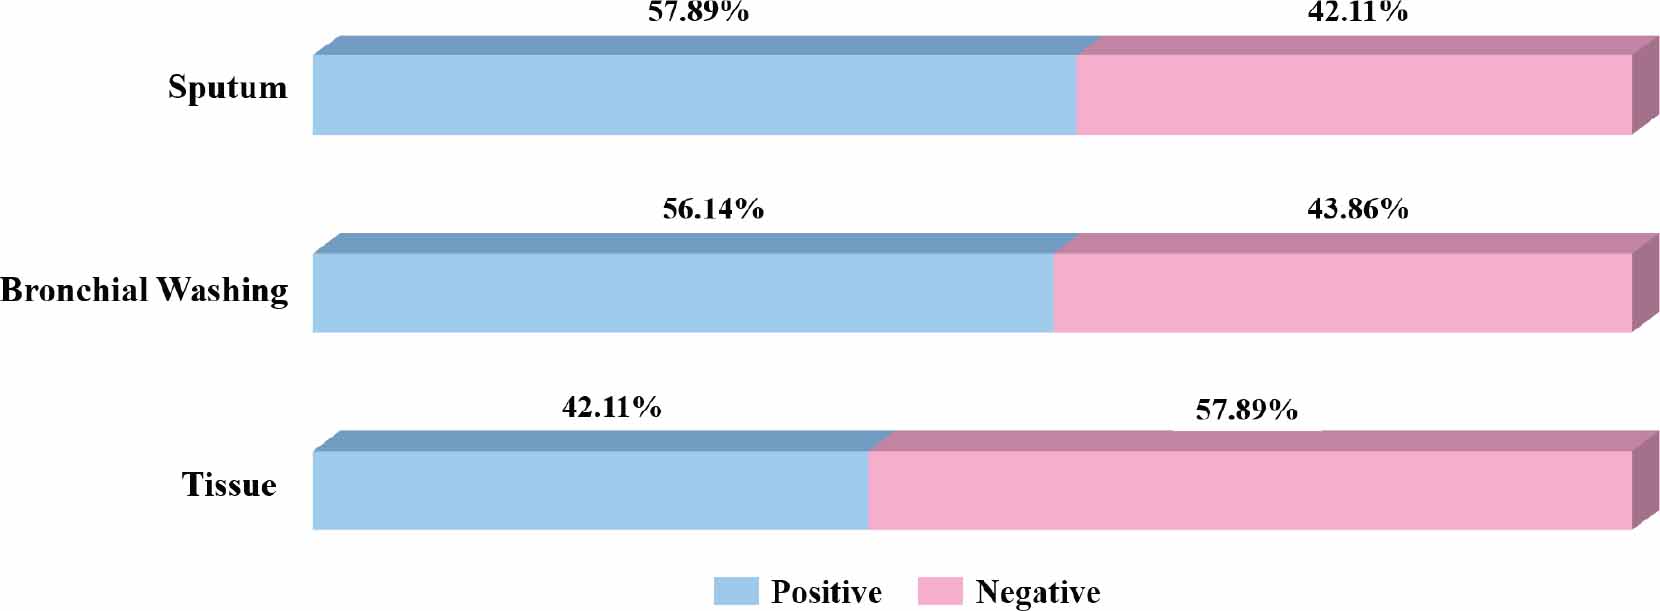
Figure 3.
Fungus positivity rates based on research subjects.
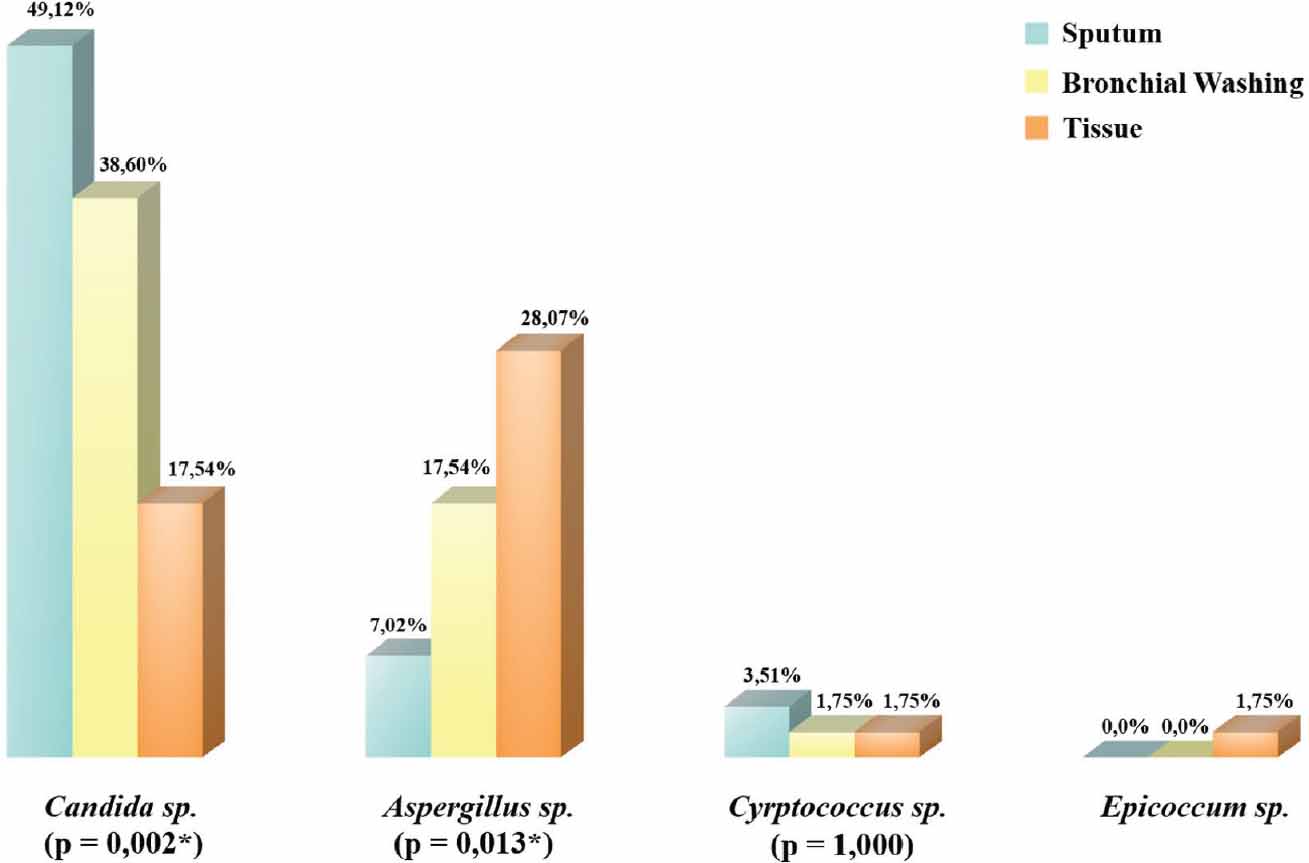
Figure 4.
Analysis of culture positivity rate and fungal species.
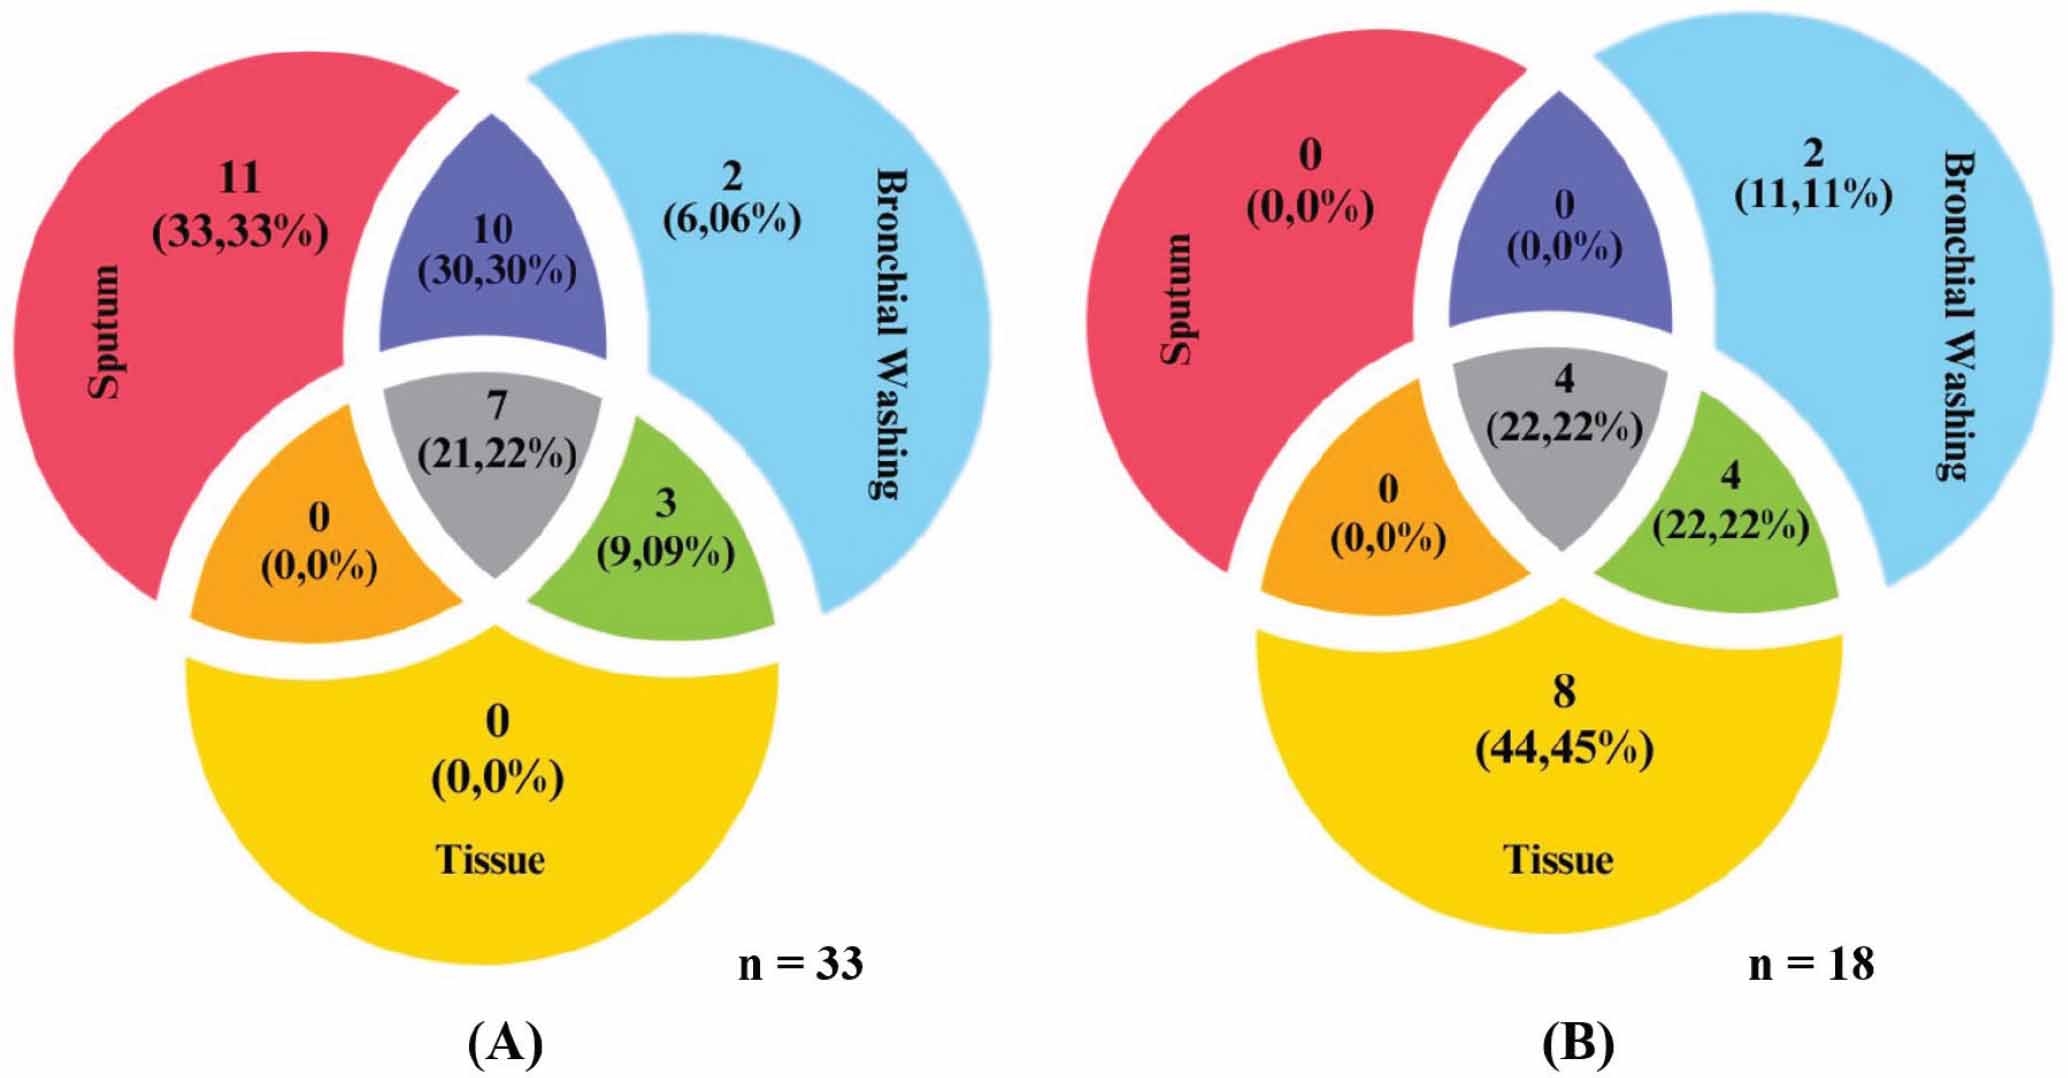
Figure 5.
Analysis of culture positivity rate and fungal species. (A) Candida sp. (B) Aspergillus sp.
Table 2.
Accuracy of test specimens for fungal culture positivity
| Isolate | Sputum versus tissue | Bronchial washing versus tissue | ||||||
|---|---|---|---|---|---|---|---|---|
| Sn (%) | Sp (%) | PPV (%) | NPV (%) | Sn (%) | Sp (%) | PPV (%) | NPV (%) | |
| Candida sp. | 70.0 | 55.32 | 25.0 | 89.66 | 100.0 | 74.47 | 45.46 | 100.0 |
| Aspergillus sp. | 25.0 | 100.0 | 100.0 | 77.36 | 50.0 | 95.12 | 80.0 | 82.98 |
| Cryptococcus sp. | 100.0 | 98.21 | 50.0 | 100.0 | 100.0 | 100.0 | 100.0 | 100.0 |
| Epicoccum sp. | 0.0 | 100.0 | 0.0 | 98.25 | 0.0 | 100.0 | 0.0 | 98.25 |