
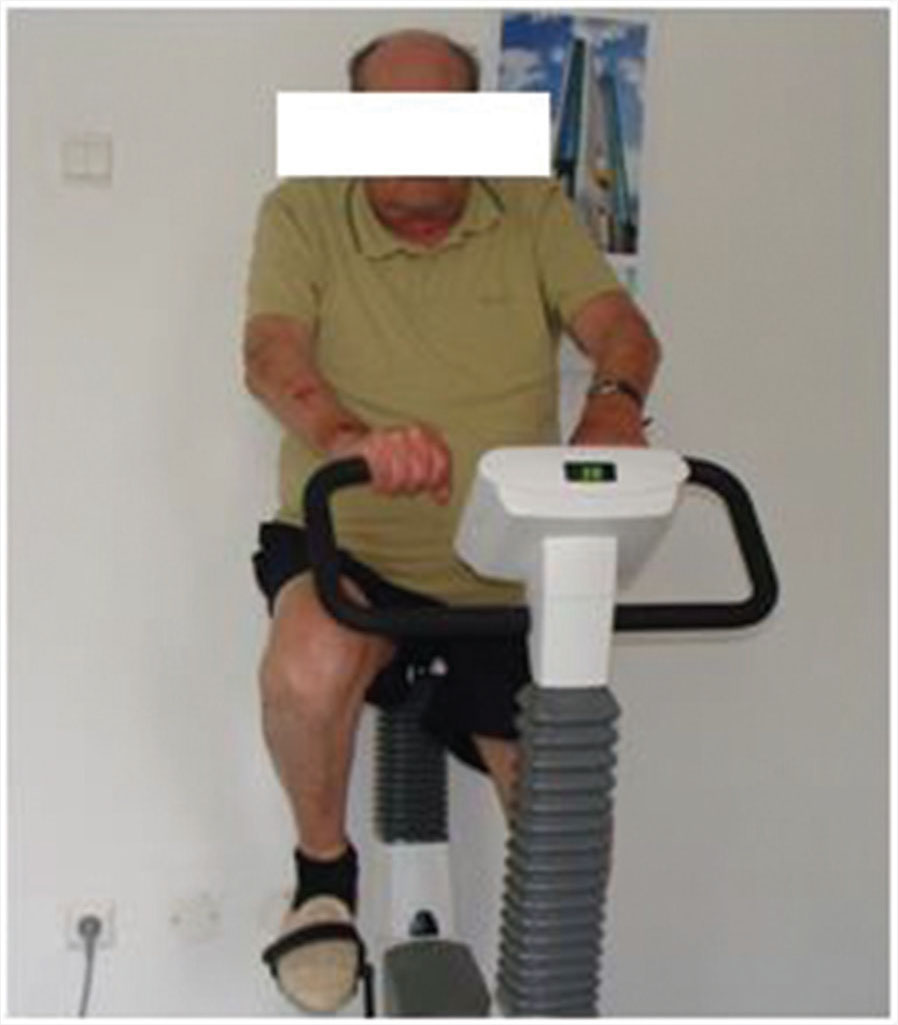
Figure 1
Cycling during RR.
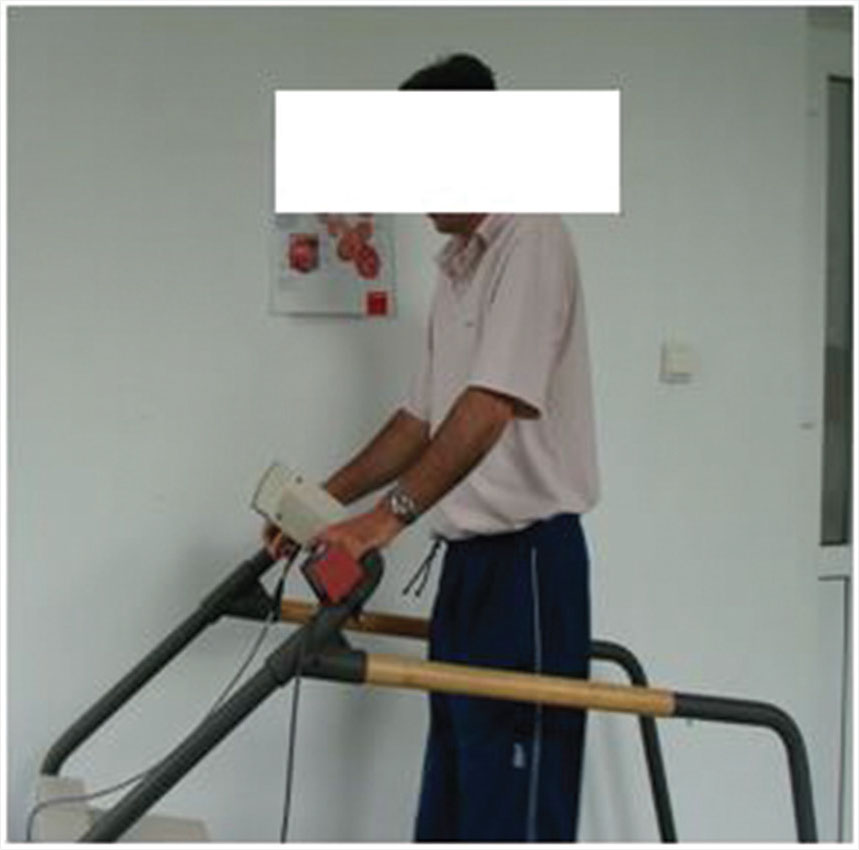
Figure 2
Treadmill exercise during RR.
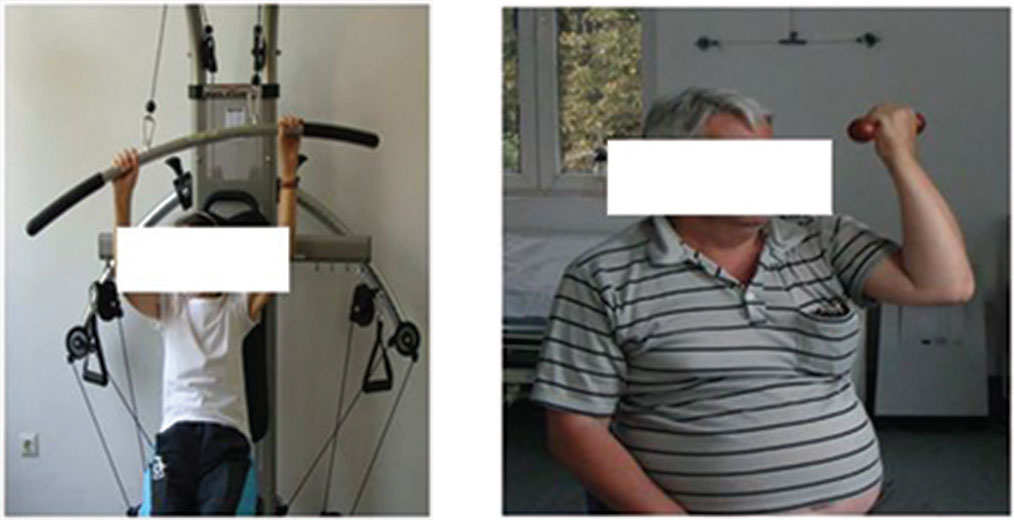
Figures 3 and 4
Upper limb exercises.
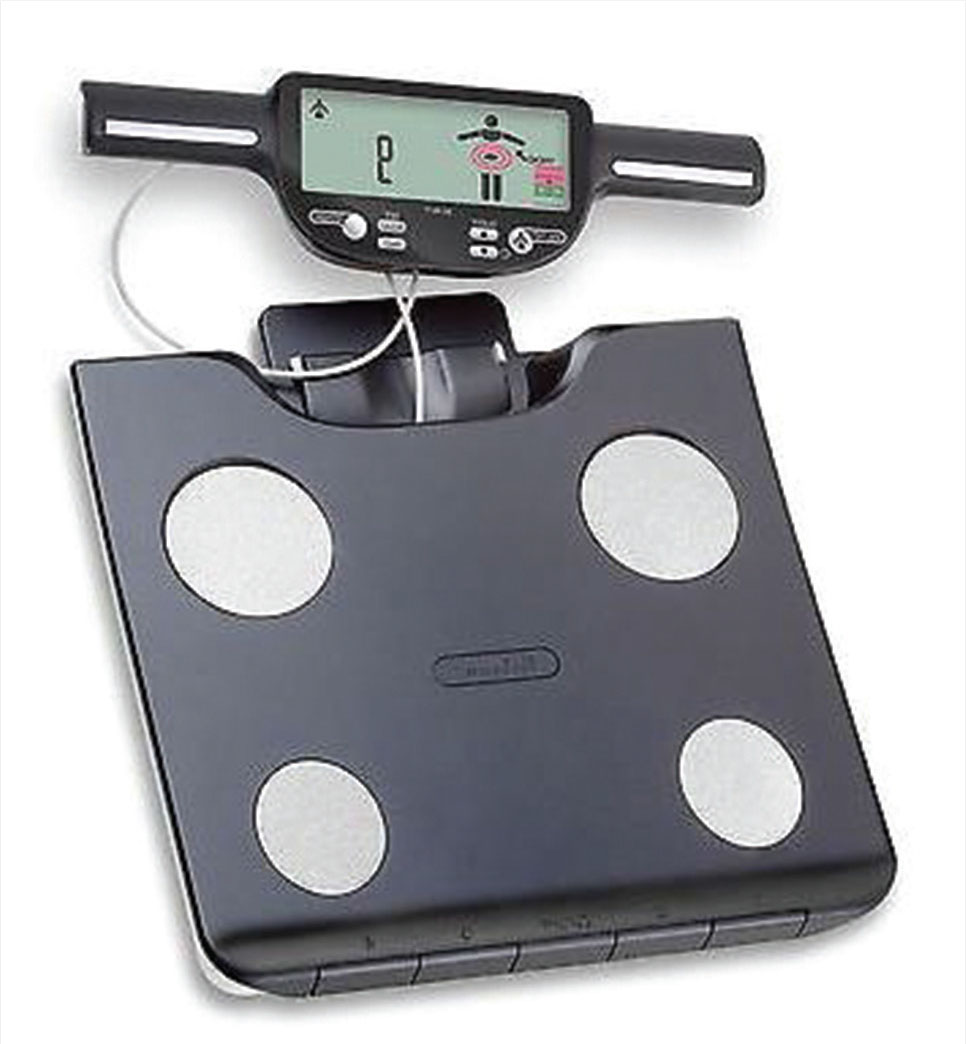
Figure 5
Body composition monitor, Tanita BC-601.
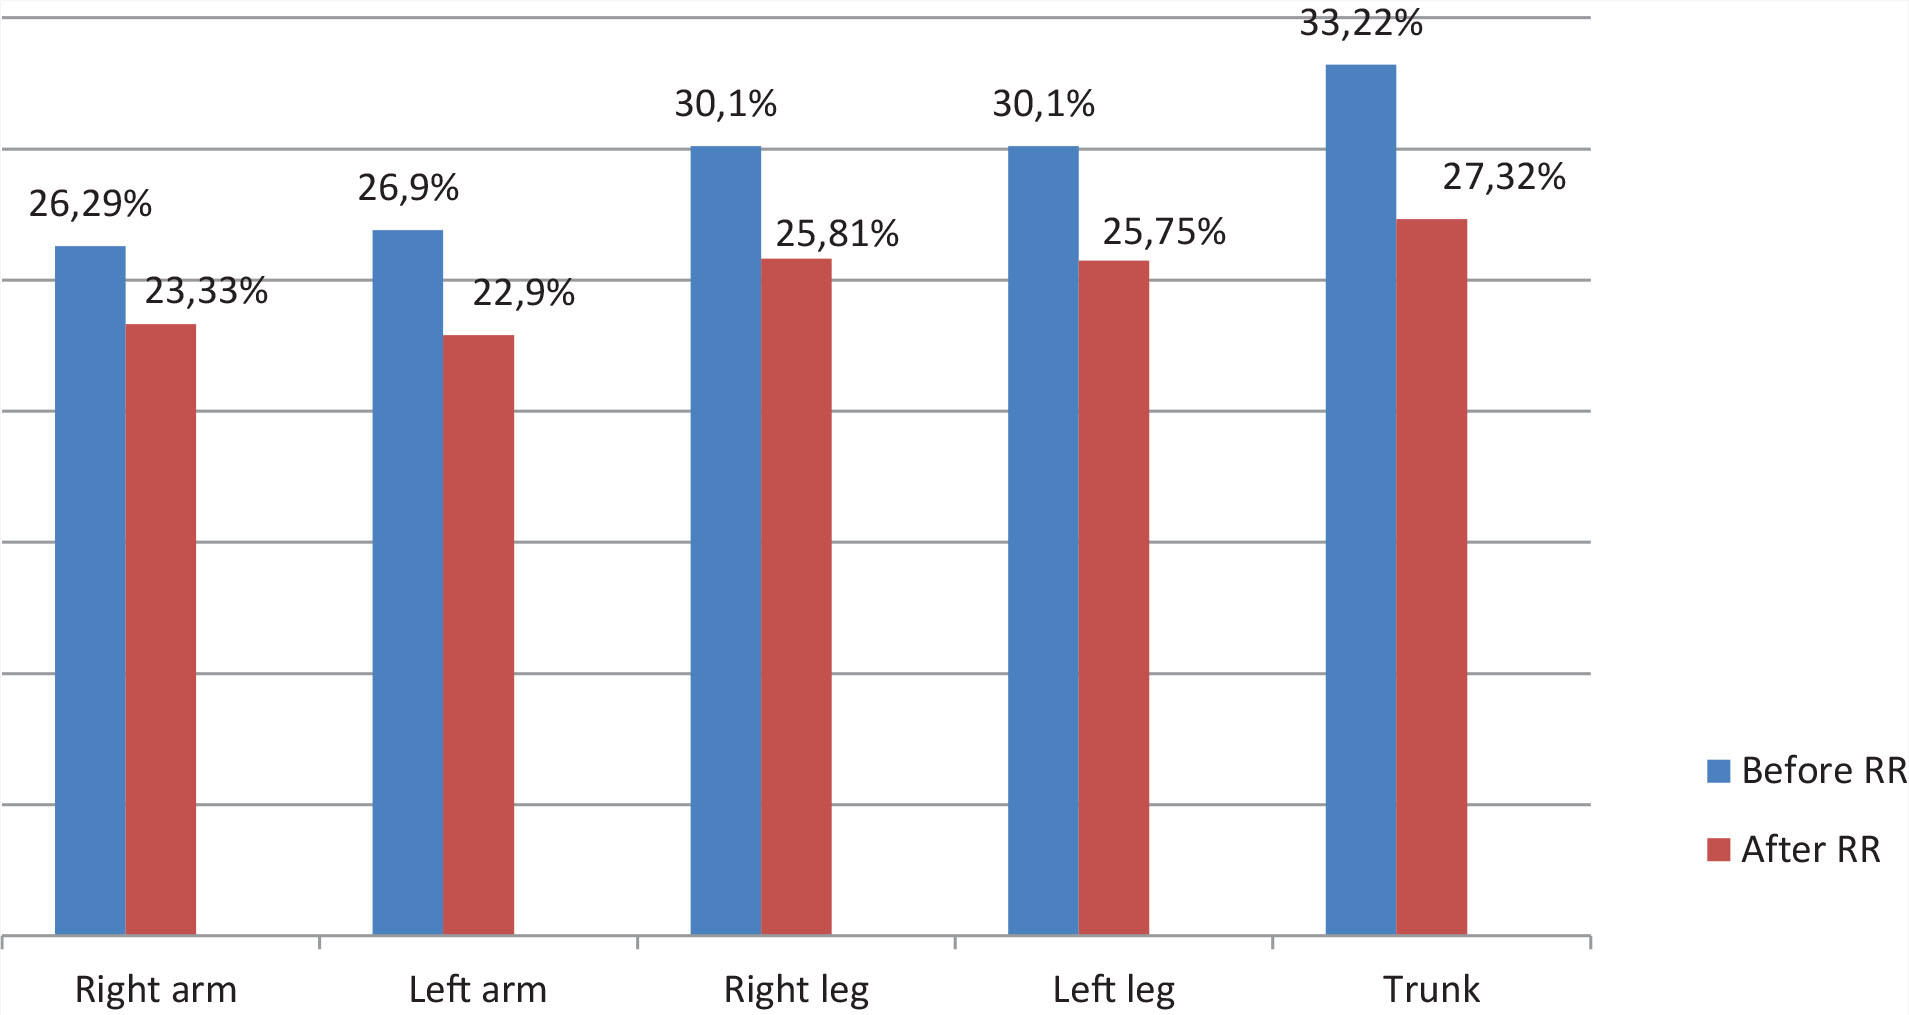
Figure 6
Changes on average body fat distribution on body segments (%), before and after RR (p < 0.05, statistically significant).
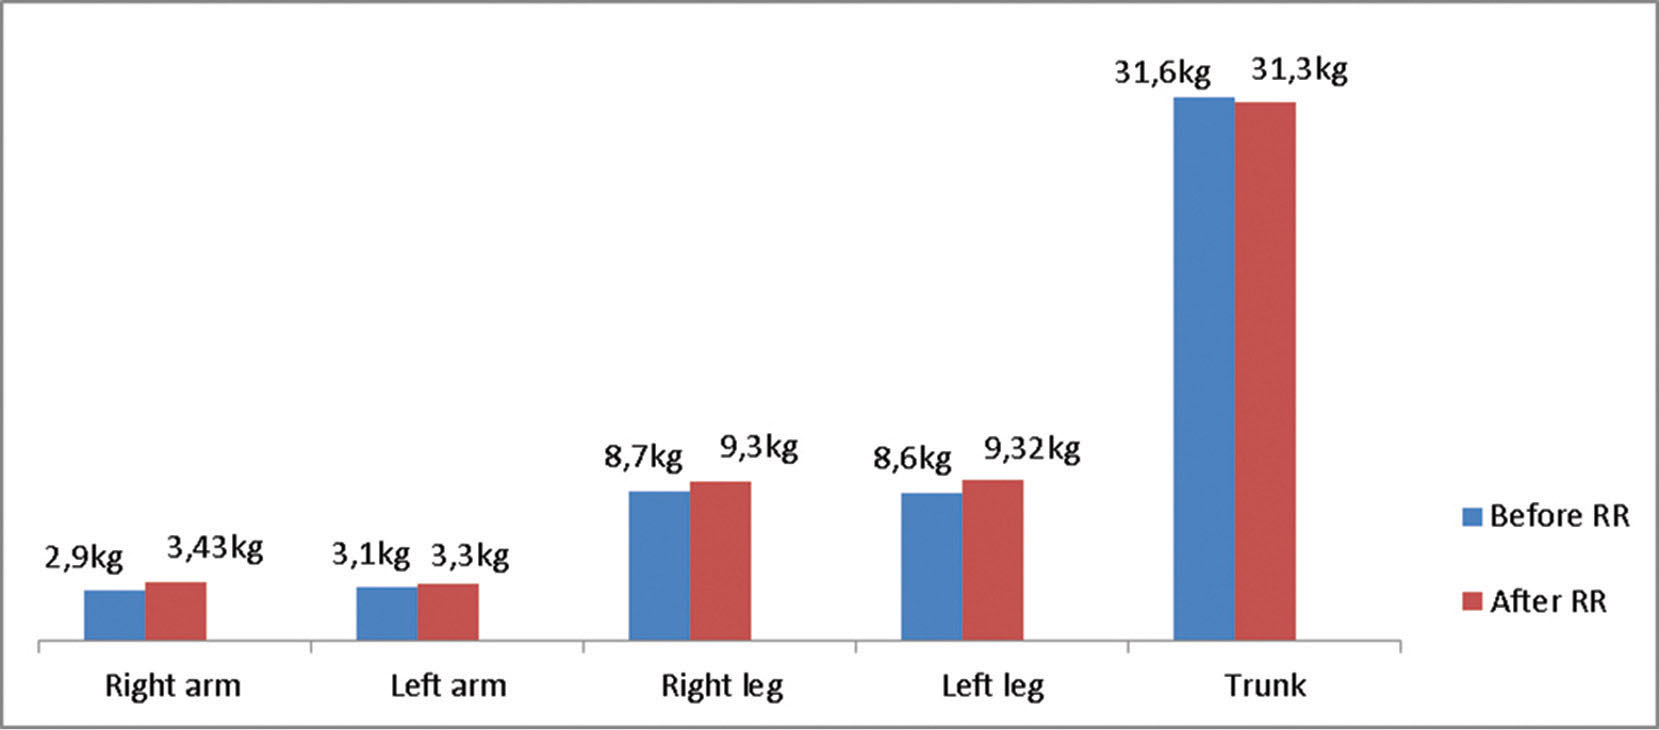
Figure 7
Average muscle mass distribution on body segments (kg), before and after RR.
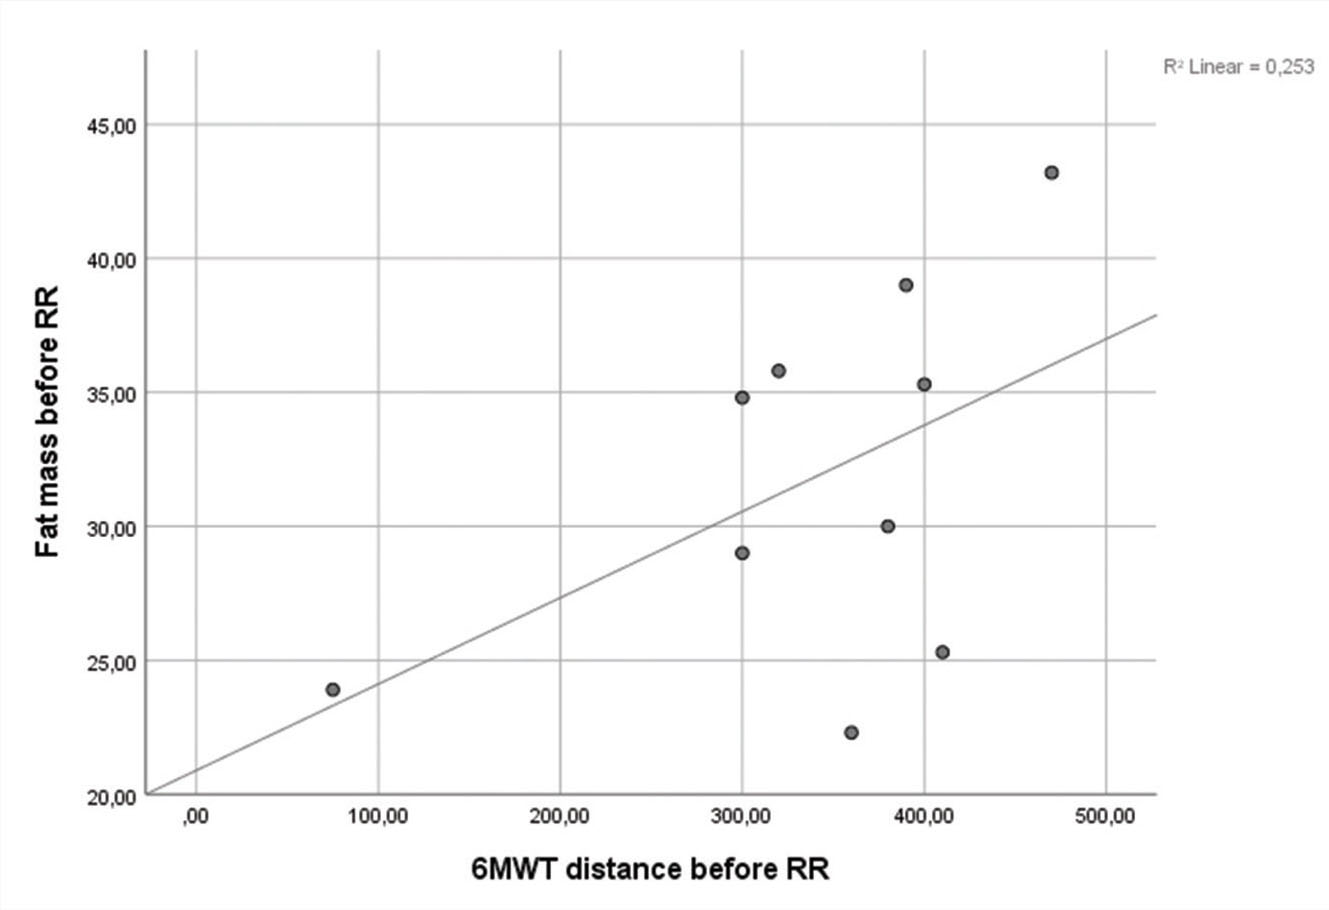
Figure 8
Correlation between the 6MWT distance and the total fat mass before RR programme (r = 0.253, p = 0.138); r = Pearson correlation index; statistically significant for p < 0.05.
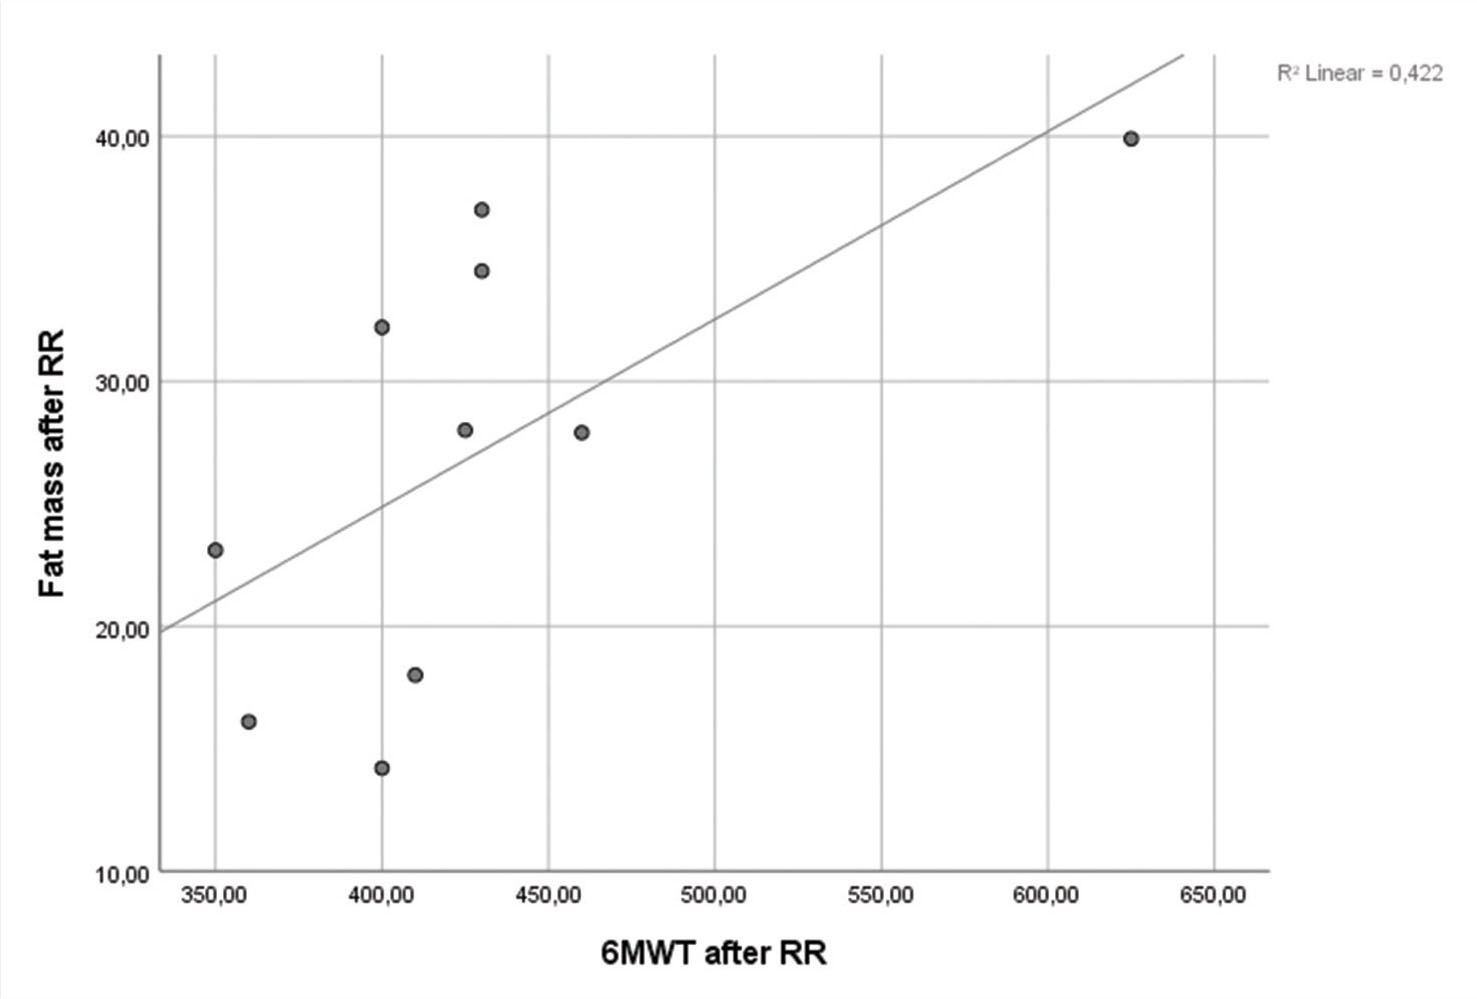
Figure 9
Correlation between the 6MWT distance and the total fat mass after RR programme (r = 0.422, p = 0.042); r = Pearson correlation index; statistically significant for p < 0.05.