
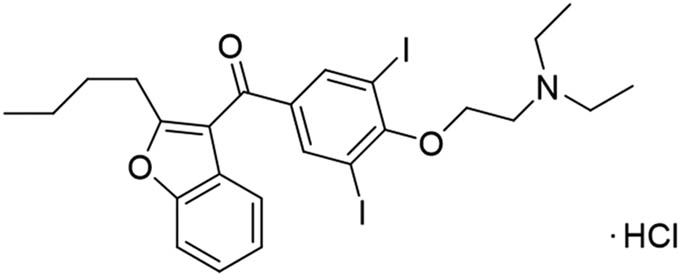
Figure 1
Chemical structure of amiodarone hydrochloride.
Table 1
Composition of AD nanosuspensions by the EPAS method
| Formulation | AD (mg) | PF-127 (mg) | PEG-6000 (mg) | PVPK30 (mg) | SDS (mg) | T-80 (mg) | Ethanol (mL) |
|---|---|---|---|---|---|---|---|
| 1 | 100 | 0 | 0 | 50 | 20 | 0 | 10 |
| 2 | 100 | 0 | 0 | 50 | 0 | 0 | 10 |
| 3 | 100 | 0 | 0 | 0 | 50 | 0 | 10 |
| 4 | 100 | 0 | 0 | 0 | 20 | 0 | 8 |
| 5 | 100 | 0 | 0 | 50 | 10 | 0 | 10 |
| 6 | 100 | 50 | 0 | 0 | 0 | 0 | 8 |
| 7 | 100 | 50 | 0 | 0 | 10 | 0 | 10 |
| 8 | 100 | 50 | 0 | 0 | 20 | 0 | 8 |
| 9 | 100 | 80 | 0 | 0 | 0 | 0 | 10 |
| 10 | 100 | 80 | 0 | 0 | 10 | 0 | 10 |
| 11 | 100 | 0 | 0 | 50 | 0 | 10 | 8 |
| 12 | 100 | 0 | 0 | 0 | 0 | 80 | 10 |
| 13 | 100 | 0 | 50 | 0 | 10 | 0 | 10 |
| 14 | 100 | 0 | 50 | 0 | 0 | 0 | 10 |
| 15 | 100 | 50 | 0 | 0 | 10 | 0 | 10 |
| 16 | 100 | 50 | 0 | 0 | 15 | 0 | 10 |
| 17 | 100 | 50 | 0 | 0 | 10 | 0 | 8 |
| 18 | 100 | 50 | 0 | 20 | 20 | 0 | 10 |
| 19 | 100 | 50 | 0 | 0 | 10 | 0 | 8 |
| 20 | 100 | 50 | 0 | 0 | 10 | 0 | 8 |
| 21 | 100 | 0 | 0 | 0 | 0 | 0 | 10 |
Table 2
Effect of the ratio of steric stabilizers to drug, the ratio of electrostatic stabilizers to drug, milling time, and milling speed on mean particle size d (90) and PDI
| Run | Ration of steric stabilizers to drug (mg) | Ration of electrostatic stabilizers to drug (mg) | Milling time (h) | Milling speed (Hz) | MPS d (90) nm | PDI |
|---|---|---|---|---|---|---|
| 1 | 300 | 150 | 8 | 30 | 279.1 | 0.317 |
| 2 | 300 | 80 | 8 | 30 | 215.3 | 0.221 |
| 3 | 300 | 50 | 8 | 30 | 221.9 | 0.298 |
| 4 | 300 | 80 | 6 | 30 | 228.0 | 0.271 |
| 5 | 300 | 80 | 12 | 30 | 205.6 | 0.214 |
| 6 | 350 | 80 | 8 | 30 | 246.4 | 0.230 |
| 7 | 400 | 80 | 8 | 30 | 288.7 | 0.252 |
| 8 | 300 | 80 | 8 | 35 | 210.1 | 0.197 |
| 9 | 300 | 80 | 8 | 40 | 195.7 | 0.248 |
| 10 | 300 | 80 | 6 | 35 | 204.5 | 0.217 |
| 11 | 350 | 80 | 6 | 35 | 224.9 | 0.247 |
| 12 | 350 | 80 | 8 | 35 | 212.4 | 0.235 |
| 13 | 400 | 80 | 8 | 35 | 237.1 | 0.217 |
| 14 | 400 | 50 | 8 | 35 | 255.3 | 0.240 |
| 15 | 400 | 150 | 8 | 35 | 287.0 | 0.371 |
| 16 | 350 | 150 | 8 | 35 | 321.9 | 0.298 |
| 17 | 300 | 150 | 8 | 35 | 390.7 | 0.383 |
| 18 | 300 | 50 | 8 | 35 | 226.7 | 0.224 |
| 19 | 350 | 50 | 8 | 35 | 217.0 | 0.222 |
| 20 | 350 | 50 | 8 | 40 | 195.4 | 0.256 |
| 21 | 350 | 50 | 12 | 40 | 189.6 | 0.247 |
| 22 | 350 | 80 | 12 | 40 | 225.3 | 0.295 |
| 23 | 350 | 80 | 8 | 40 | 243.4 | 0.276 |
| 24 | 350 | 150 | 8 | 40 | 289.5 | 0.354 |
| 25 | 300 | 150 | 8 | 40 | 274.5 | 0.342 |
mg, milligram; h, hours; nm, nanometer; MPS d (90), mean particle size d (90).
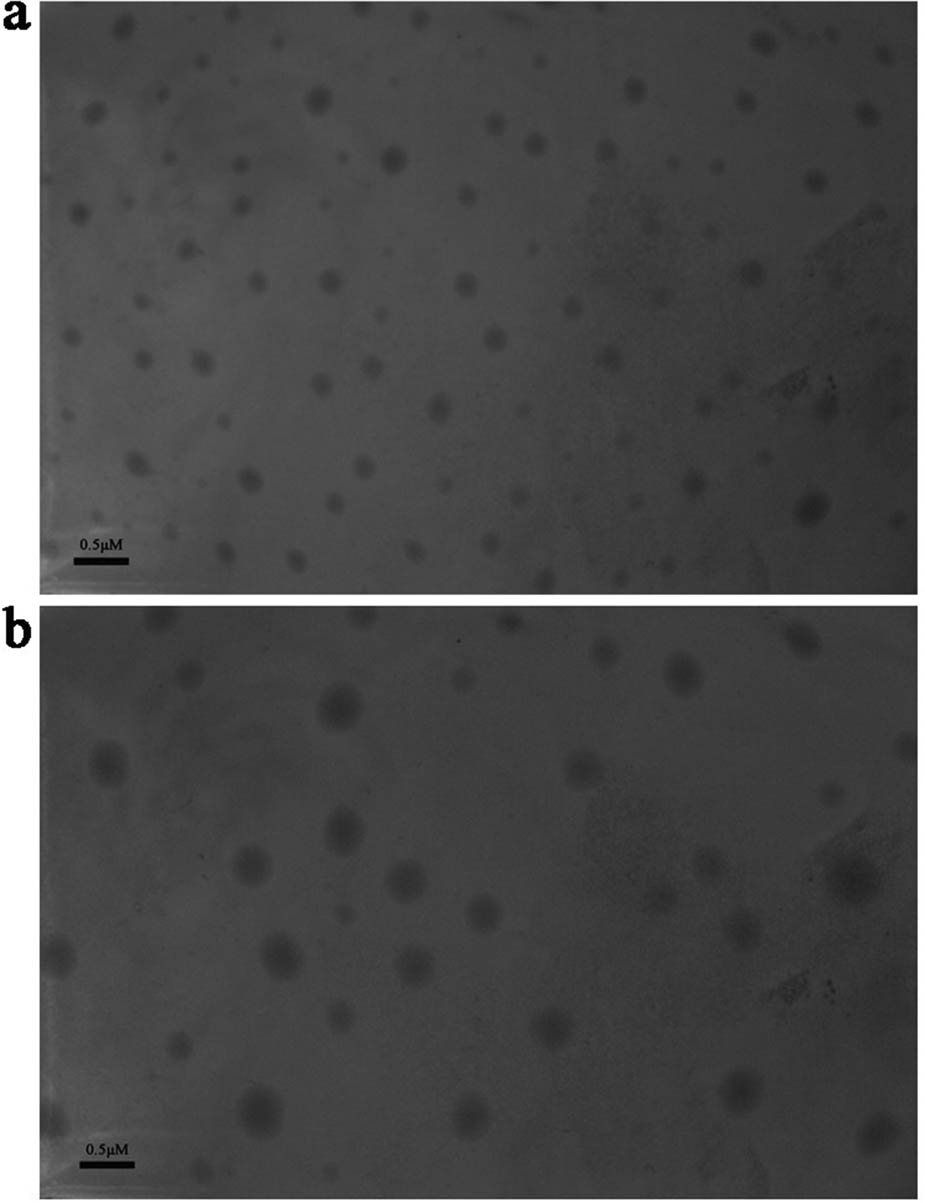
Figure 2
TEM images of the wet-milling nanosuspension (a) and the EPAS nanosuspension (b).
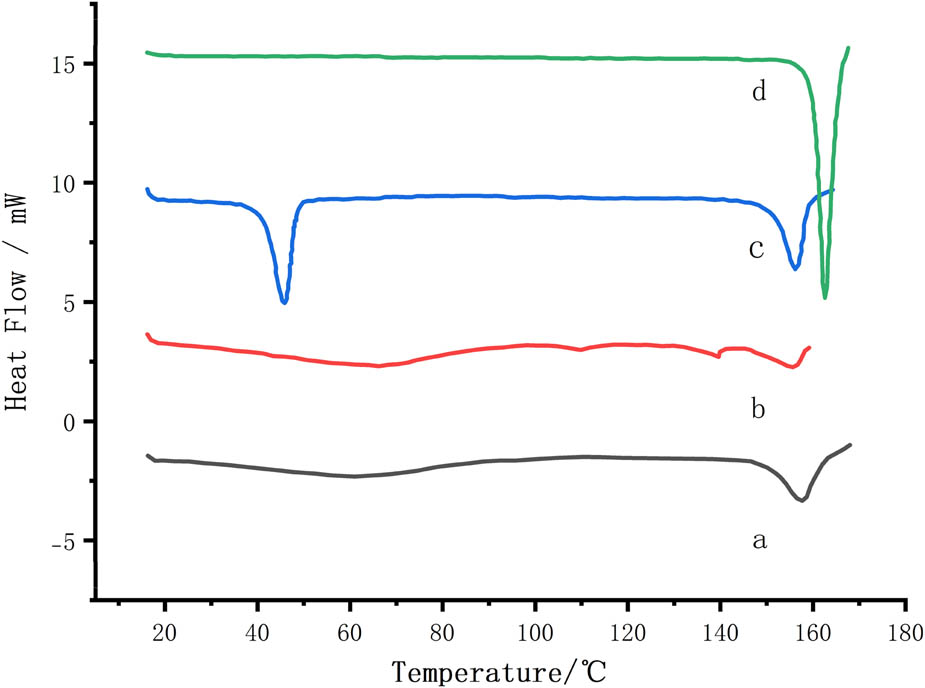
Figure 3
DSC spectra of (a) physical mixture (PM) powder, (b) the NS-A powders, (c) NS-B powders, and (d) AD.
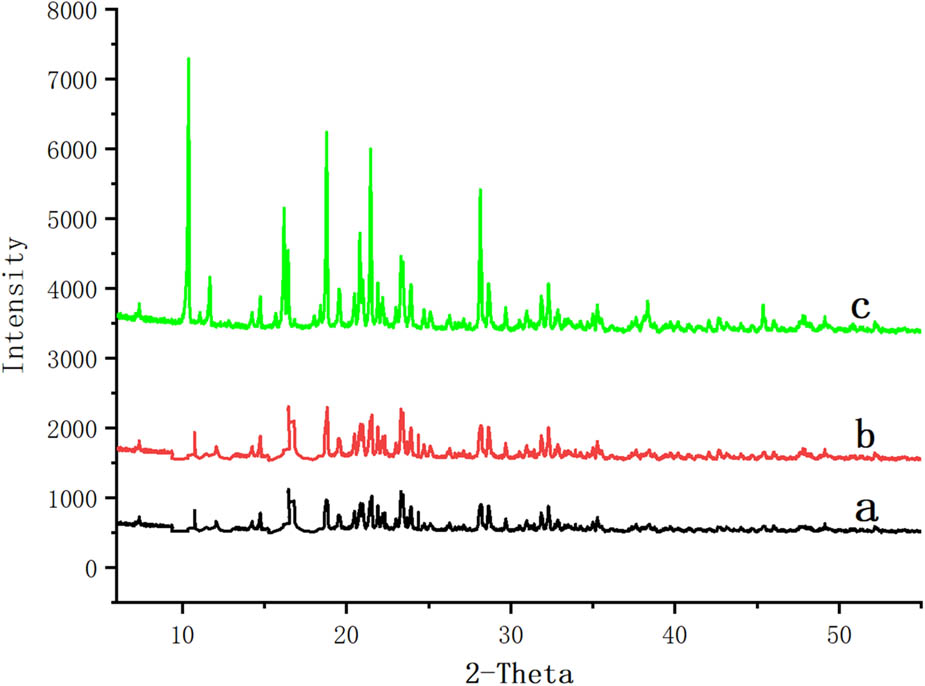
Figure 4
XRPD spectra of (a) NS-B, (b) NS-A, and (c) AD powders.
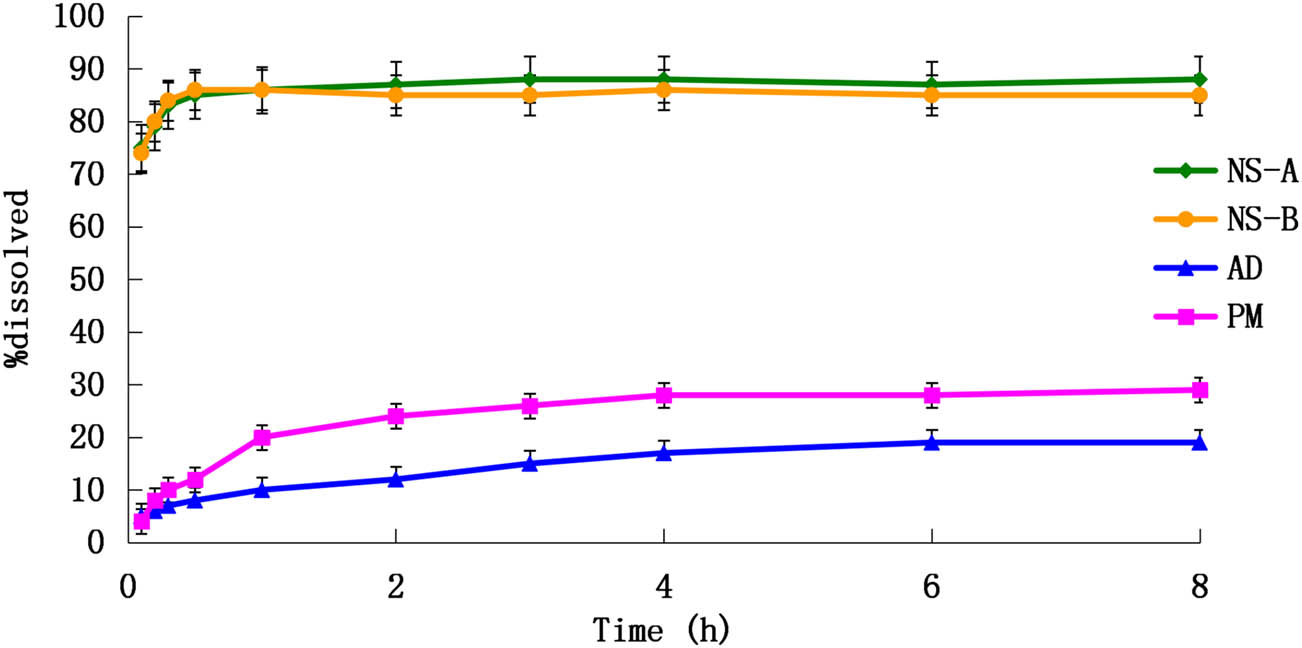
Figure 5
Dissolution profiles for raw AD (AD), physical mixture of AD (PM), the EPAS dried powder (NS-A) and wet-milling dried powder (NS-B) at 37°C and 100 rpm (n = 3).
Table 3
The stability of the EPAS dried powder (NS-A)
| Time month | Physical appearance | Colour change | MPS d (90) nm | PDI |
|---|---|---|---|---|
| 0 month | Homogenous | No change | 226 ± 0.32 | 0.223 ± 0.005 |
| 1 month | Homogenous | No change | 233 ± 0.86 | 0.237 ± 0.008 |
| 2 month | Homogenous | No change | 252 ± 1.12 | 0.248 ± 0.014 |
| 3 month | Homogenous | No change | 259 ± 1.35 | 0.265 ± 0.017 |
Stability studies at 0, 1, 2 and 3 months’ time period at 25°C and RH 75%.
Table 4
The stability of the wet-milling dried powder (NS-B)
| Time month | Physical appearance | Colour change | MPS d (90) nm | PDI |
|---|---|---|---|---|
| 0 month | Homogenous | No change | 205 ± 0.57 | 0.217 ± 0.004 |
| 1 month | Homogenous | No change | 223 ± 1.07 | 0.235 ± 0.008 |
| 2 month | Homogenous | No change | 235 ± 1.31 | 0.257 ± 0.016 |
| 3 month | Homogenous | No change | 255 ± 1.62 | 0.268 ± 0.018 |
Stability studies at 0, 1, 2 and 3 months’ time period at 25°C and RH 75%.
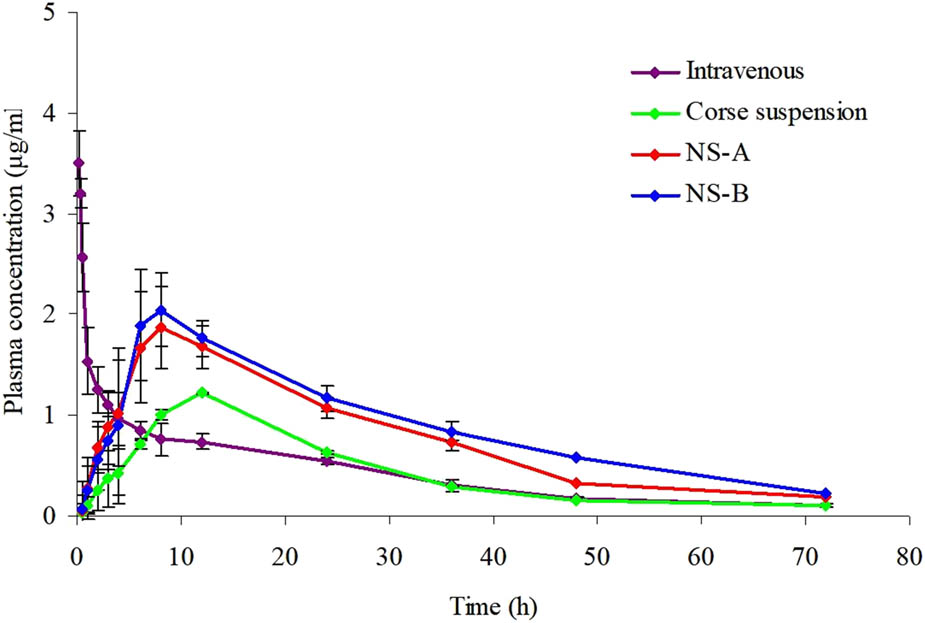
Figure 6
Plasma concentration-time profiles of AD after intravenous AD coarse suspension (20 mg/kg), oral nanosuspension and AD coarse suspension administrations of 50 mg/kg in the rats. Two different oral formulations were tested: nanosuspension and coarse suspension. Data are expressed as mean ± SD (n = 6).
Table 5
Pharmacokinetic parameters in three groups: coarse suspension of oral AD (50 mg/kg), nanosuspension of oral AD (50 mg/kg), and intravenous AD (20 mg/kg)
| Parameter | Intravenous | Coarse suspensions | NS-A | NS-B |
|---|---|---|---|---|
| Dose (mg/kg) | 20 | 50 | 50 | 50 |
| C max (μg/mL) | 3.503 ± 0.329 | 1.217 ± 0.225 | 1.873 ± 0.31** | 2.049 ± 0.29** |
| T max (h) | — | 12 ± 0 | 8 ± 0.765* | 8 ± 1.155* |
| AUC0–∞ (μg h/mL) | 37.446 ± 7.076 | 31.19 ± 4.594 | 60.59 ± 3.375* | 70.304 ± 4.563* |
| T 1/2 (h) | 23.20 ± 9.867 | 11.98 ± 0.11 | 18.98 ± 2.15* | 20.013 ± 3.25* |
| F r | — | 33.31% | 64.72% | 75.91% |
Data are expressed as mean ± SD (n = 6) (*p < 0.05, **p < 0.01, vs. control).
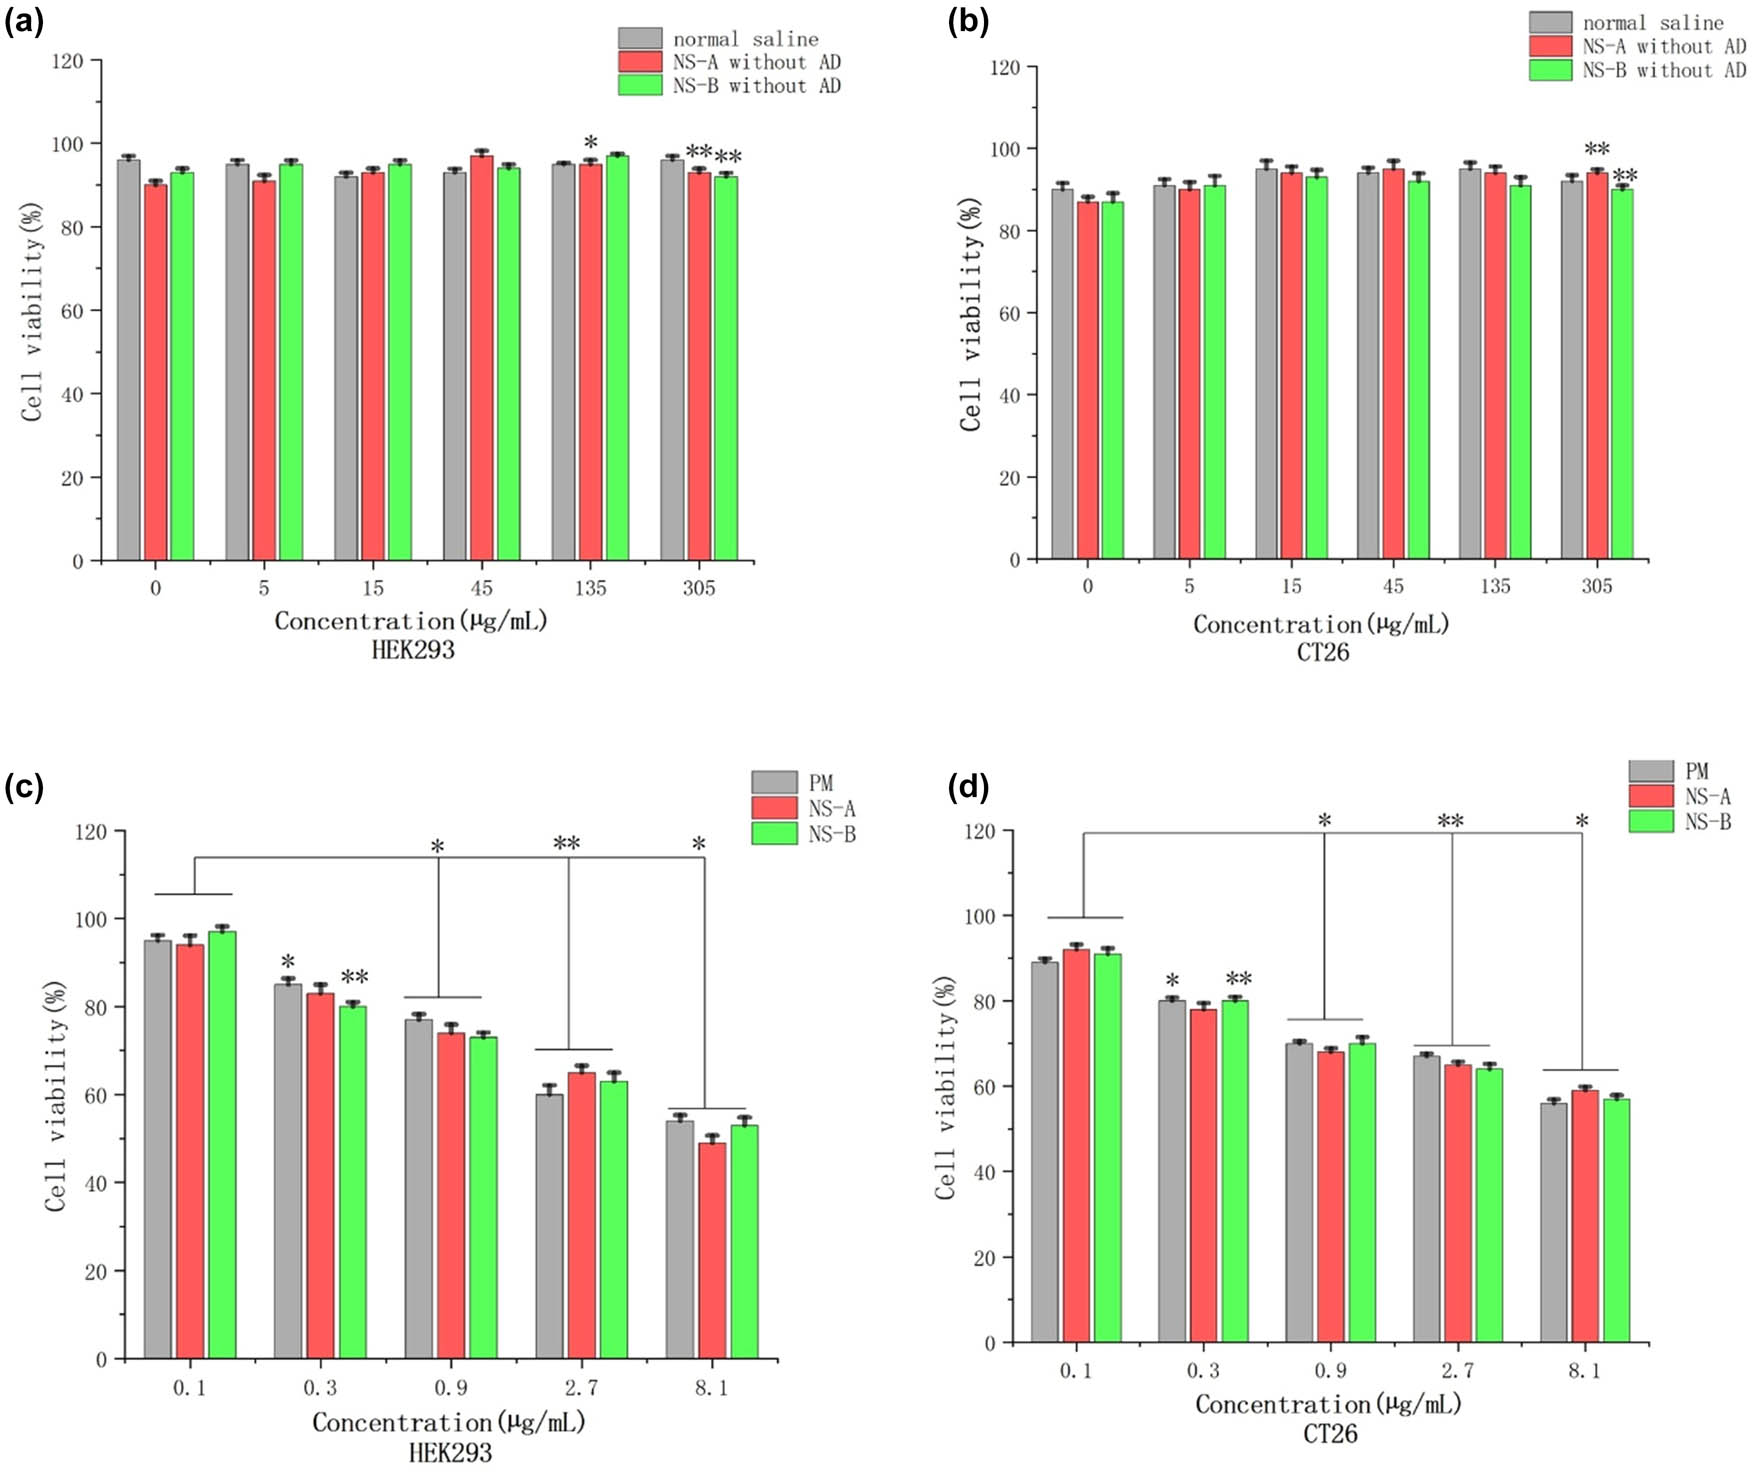
Figure 7
Cytotoxicity of normal saline, NS-A, and NS-B without AD, at different concentrations to HEK293 (a) and CT26 (b) cells was measured by MTT assay. Cells were treated with normal saline, NS-A, and NS-B without AD for 3 days. Each column represented the mean ± SD for three independent experiments (*p < 0.05, **p < 0.01 vs. control). Cytotoxicity of PM, NS-A, and NS-B at different concentrations to HEK293 (c) and CT26 (d) cells was measured by MTT assay. Cells were treated with PM, NS-A, or NS-B for 3 days. Each column represented the mean ± SD for three independent experiments (*p < 0.05, **p < 0.01 vs. control).