
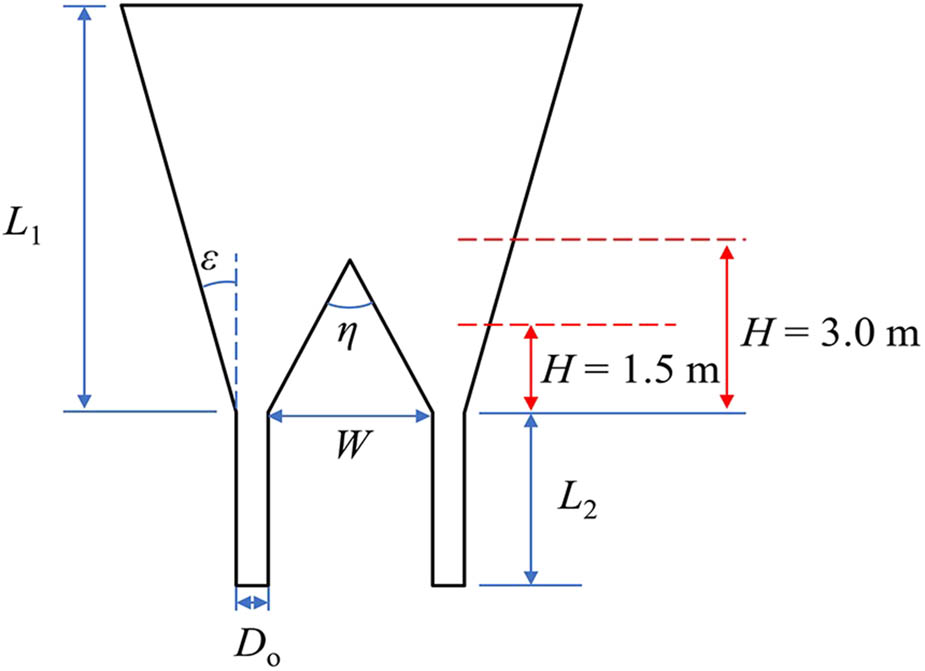
Figure 1
Schematic diagram of the dual-outlet silo.
Source: Author’s contribution.
Table 1
Model geometry and parameter values
| Parameter | Value |
|---|---|
| L 1 (m) | 7.05 |
| L 2 (m) | 3.00 |
| W (m) | 2.23 |
| D o (m) | 0.26, 0.52, 0.78 |
| ε (°) | 15.0 |
| η (°) | 54.0 |
| d p (μm) | 200 |
| ϕ e (°) | 30 |
Source: Author’s contribution.
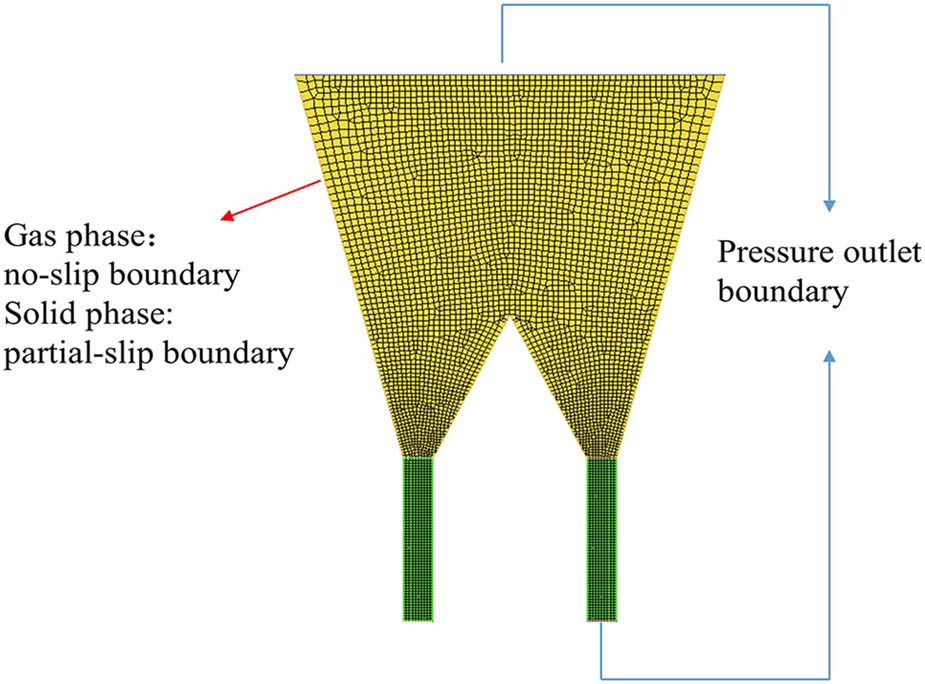
Figure 2
Computational mesh and boundary conditions.
Source: Author’s contribution.
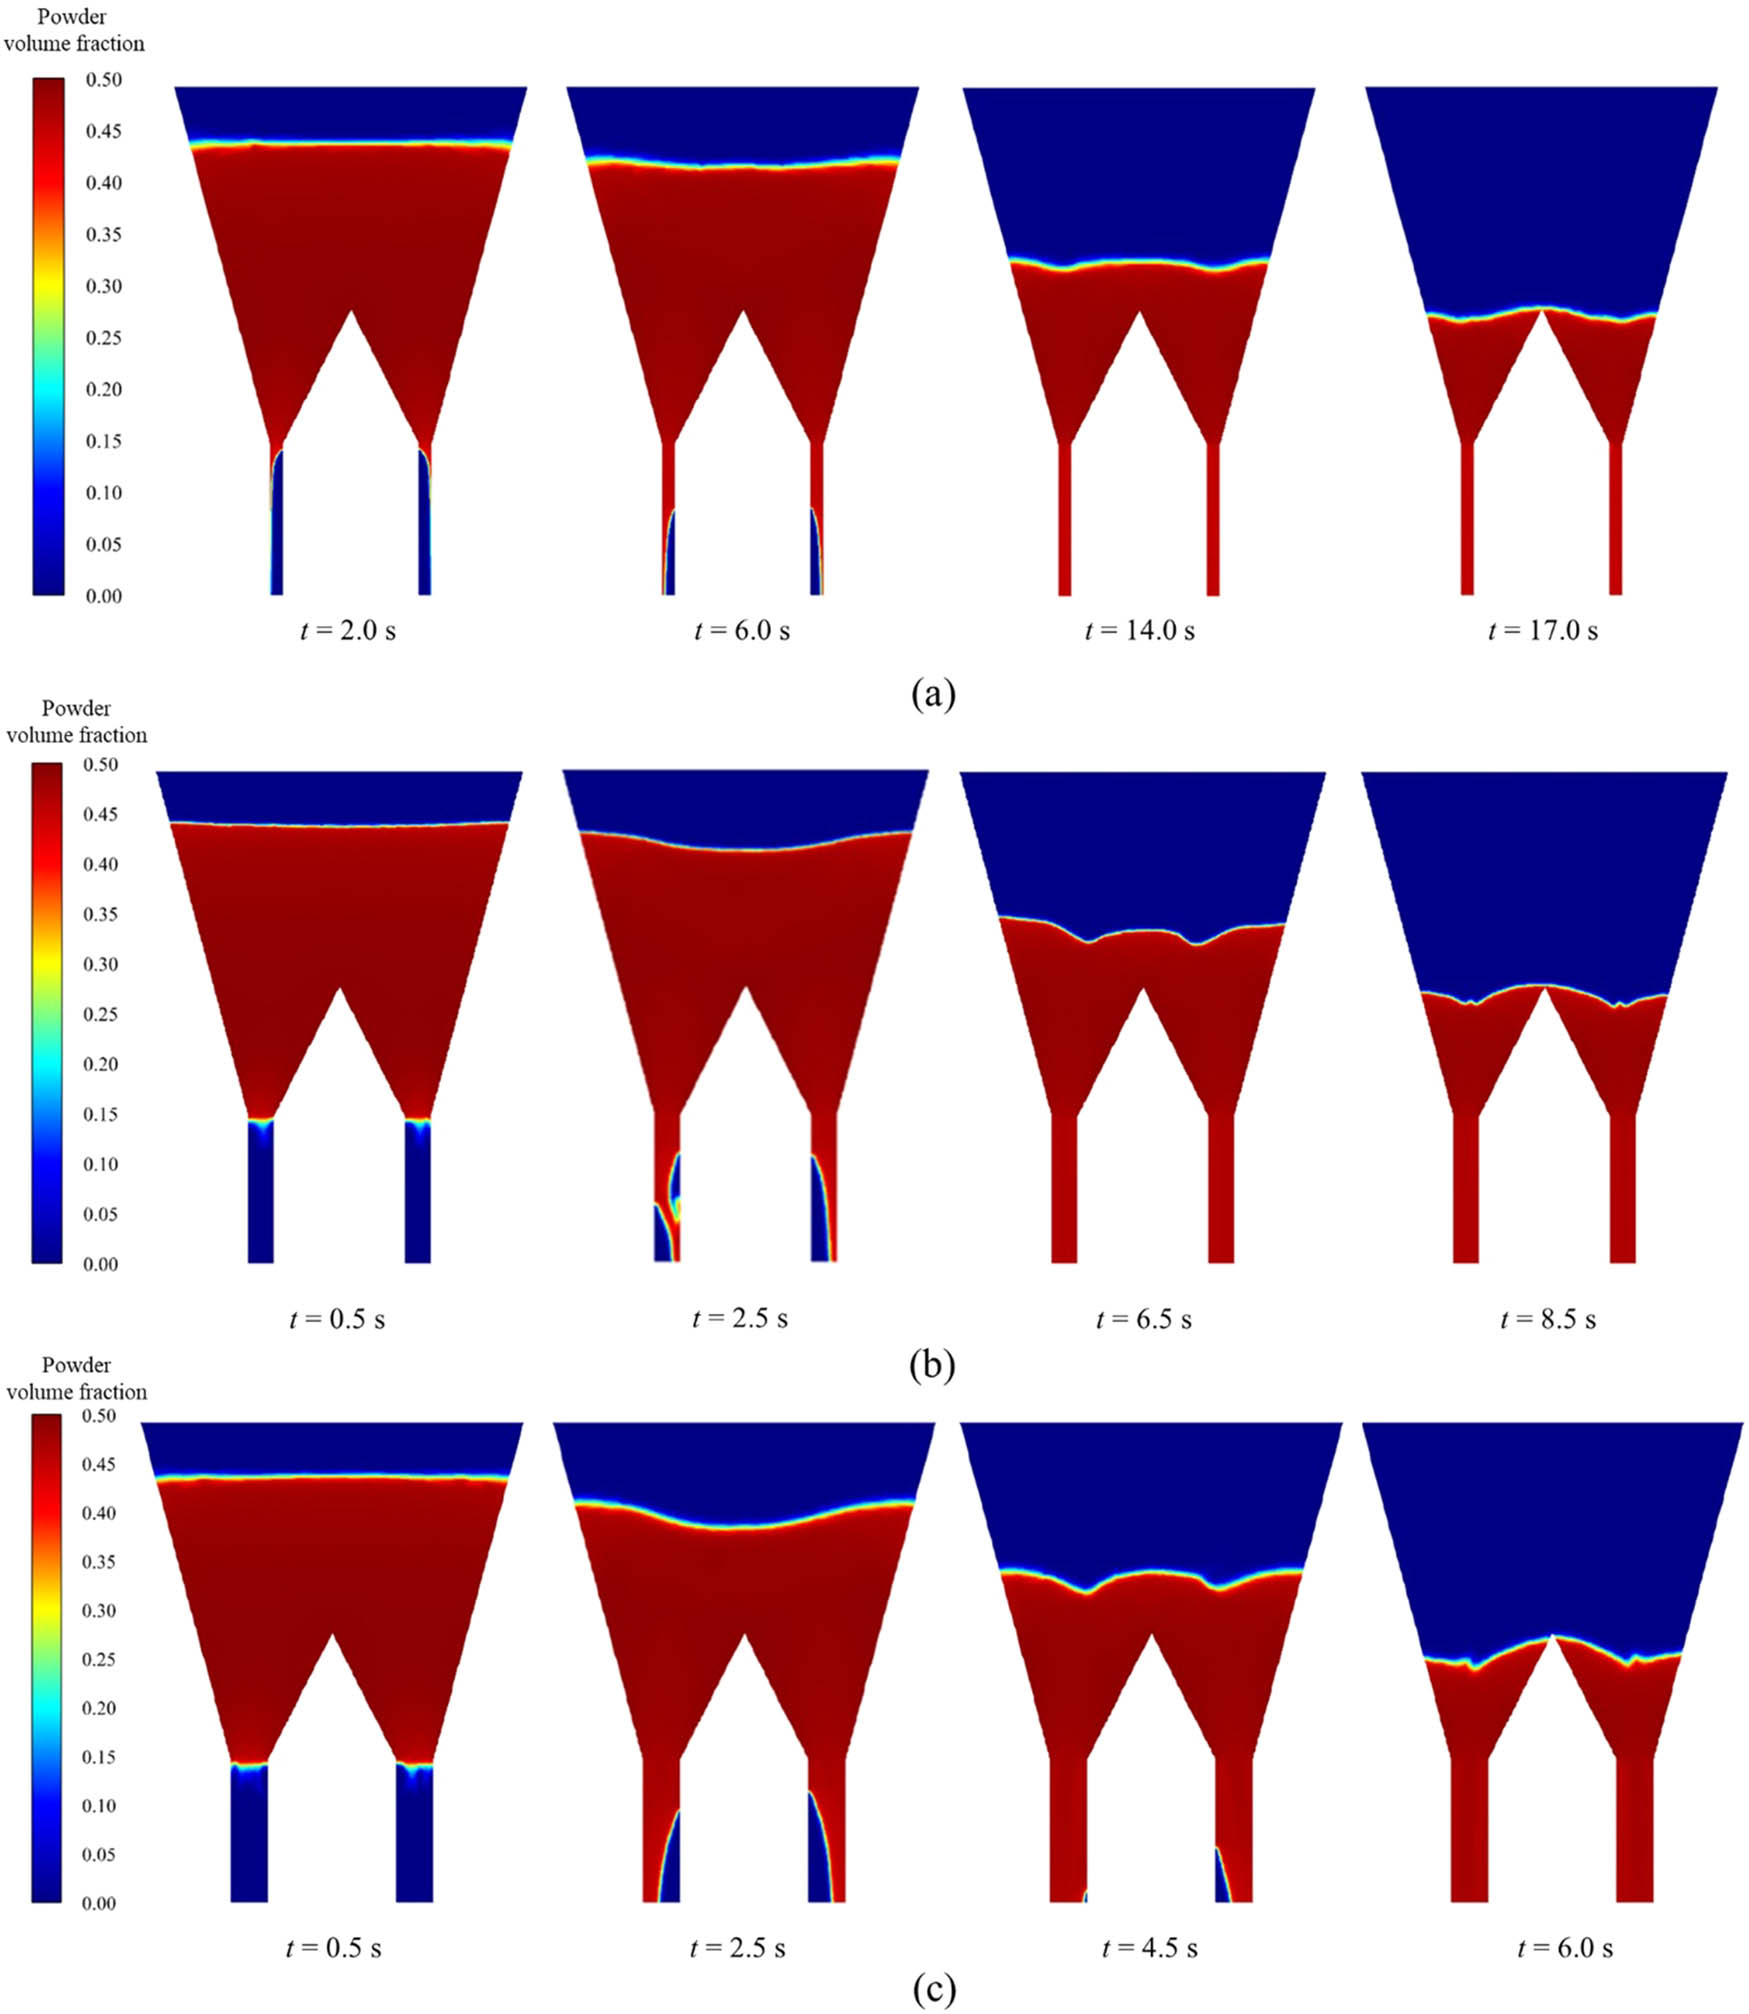
Figure 3
Contours of powder volume fraction in the silo system during discharge. (a) D o = 0.26 m, (b) D o = 0.52 m, (c) D o = 0.78 m.
Source: Author’s contribution.
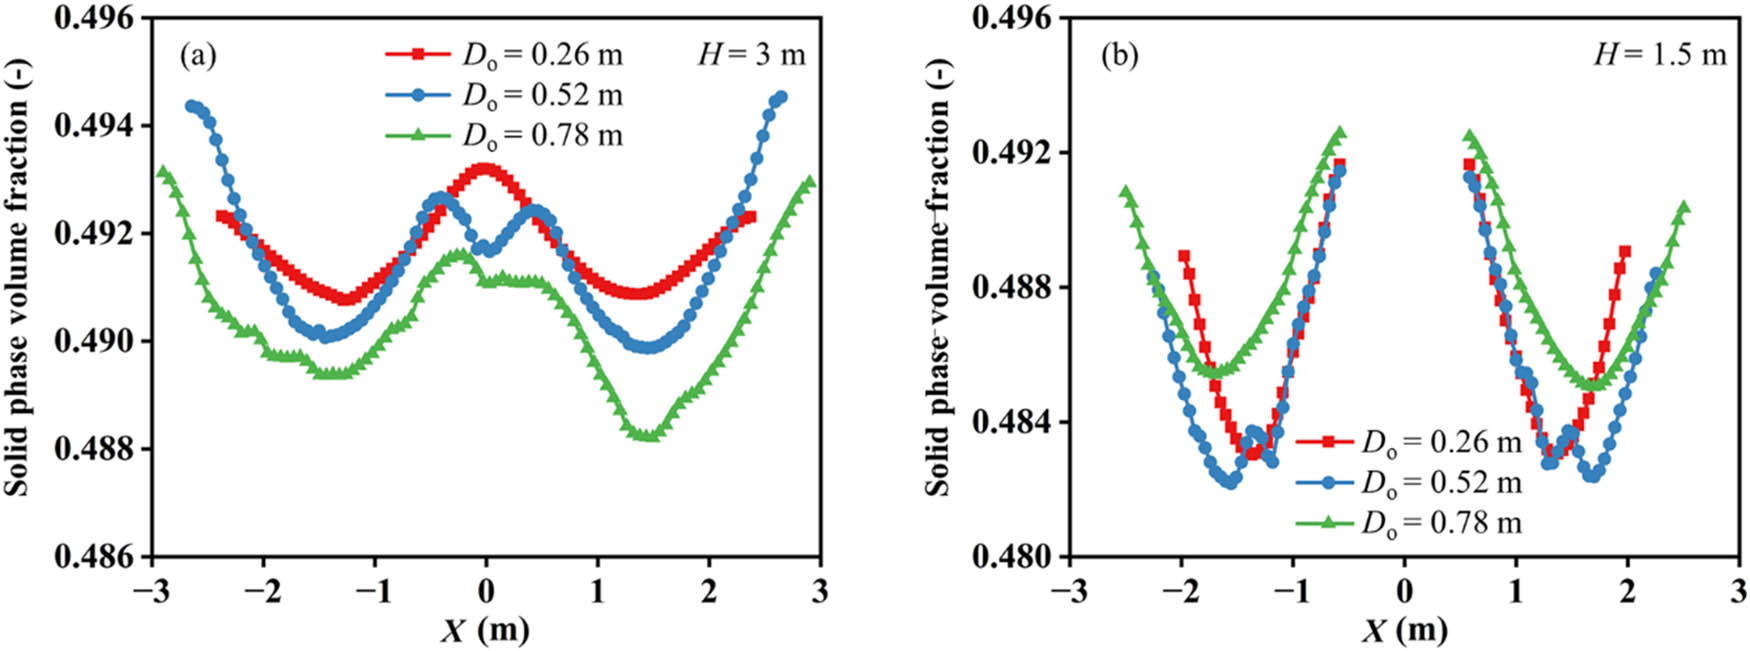
Figure 4
Powder volume fraction at discharge time t = 2.5 s. (a) H = 3.0 m, (b) H = 1.5 m.
Source: Author’s contribution.
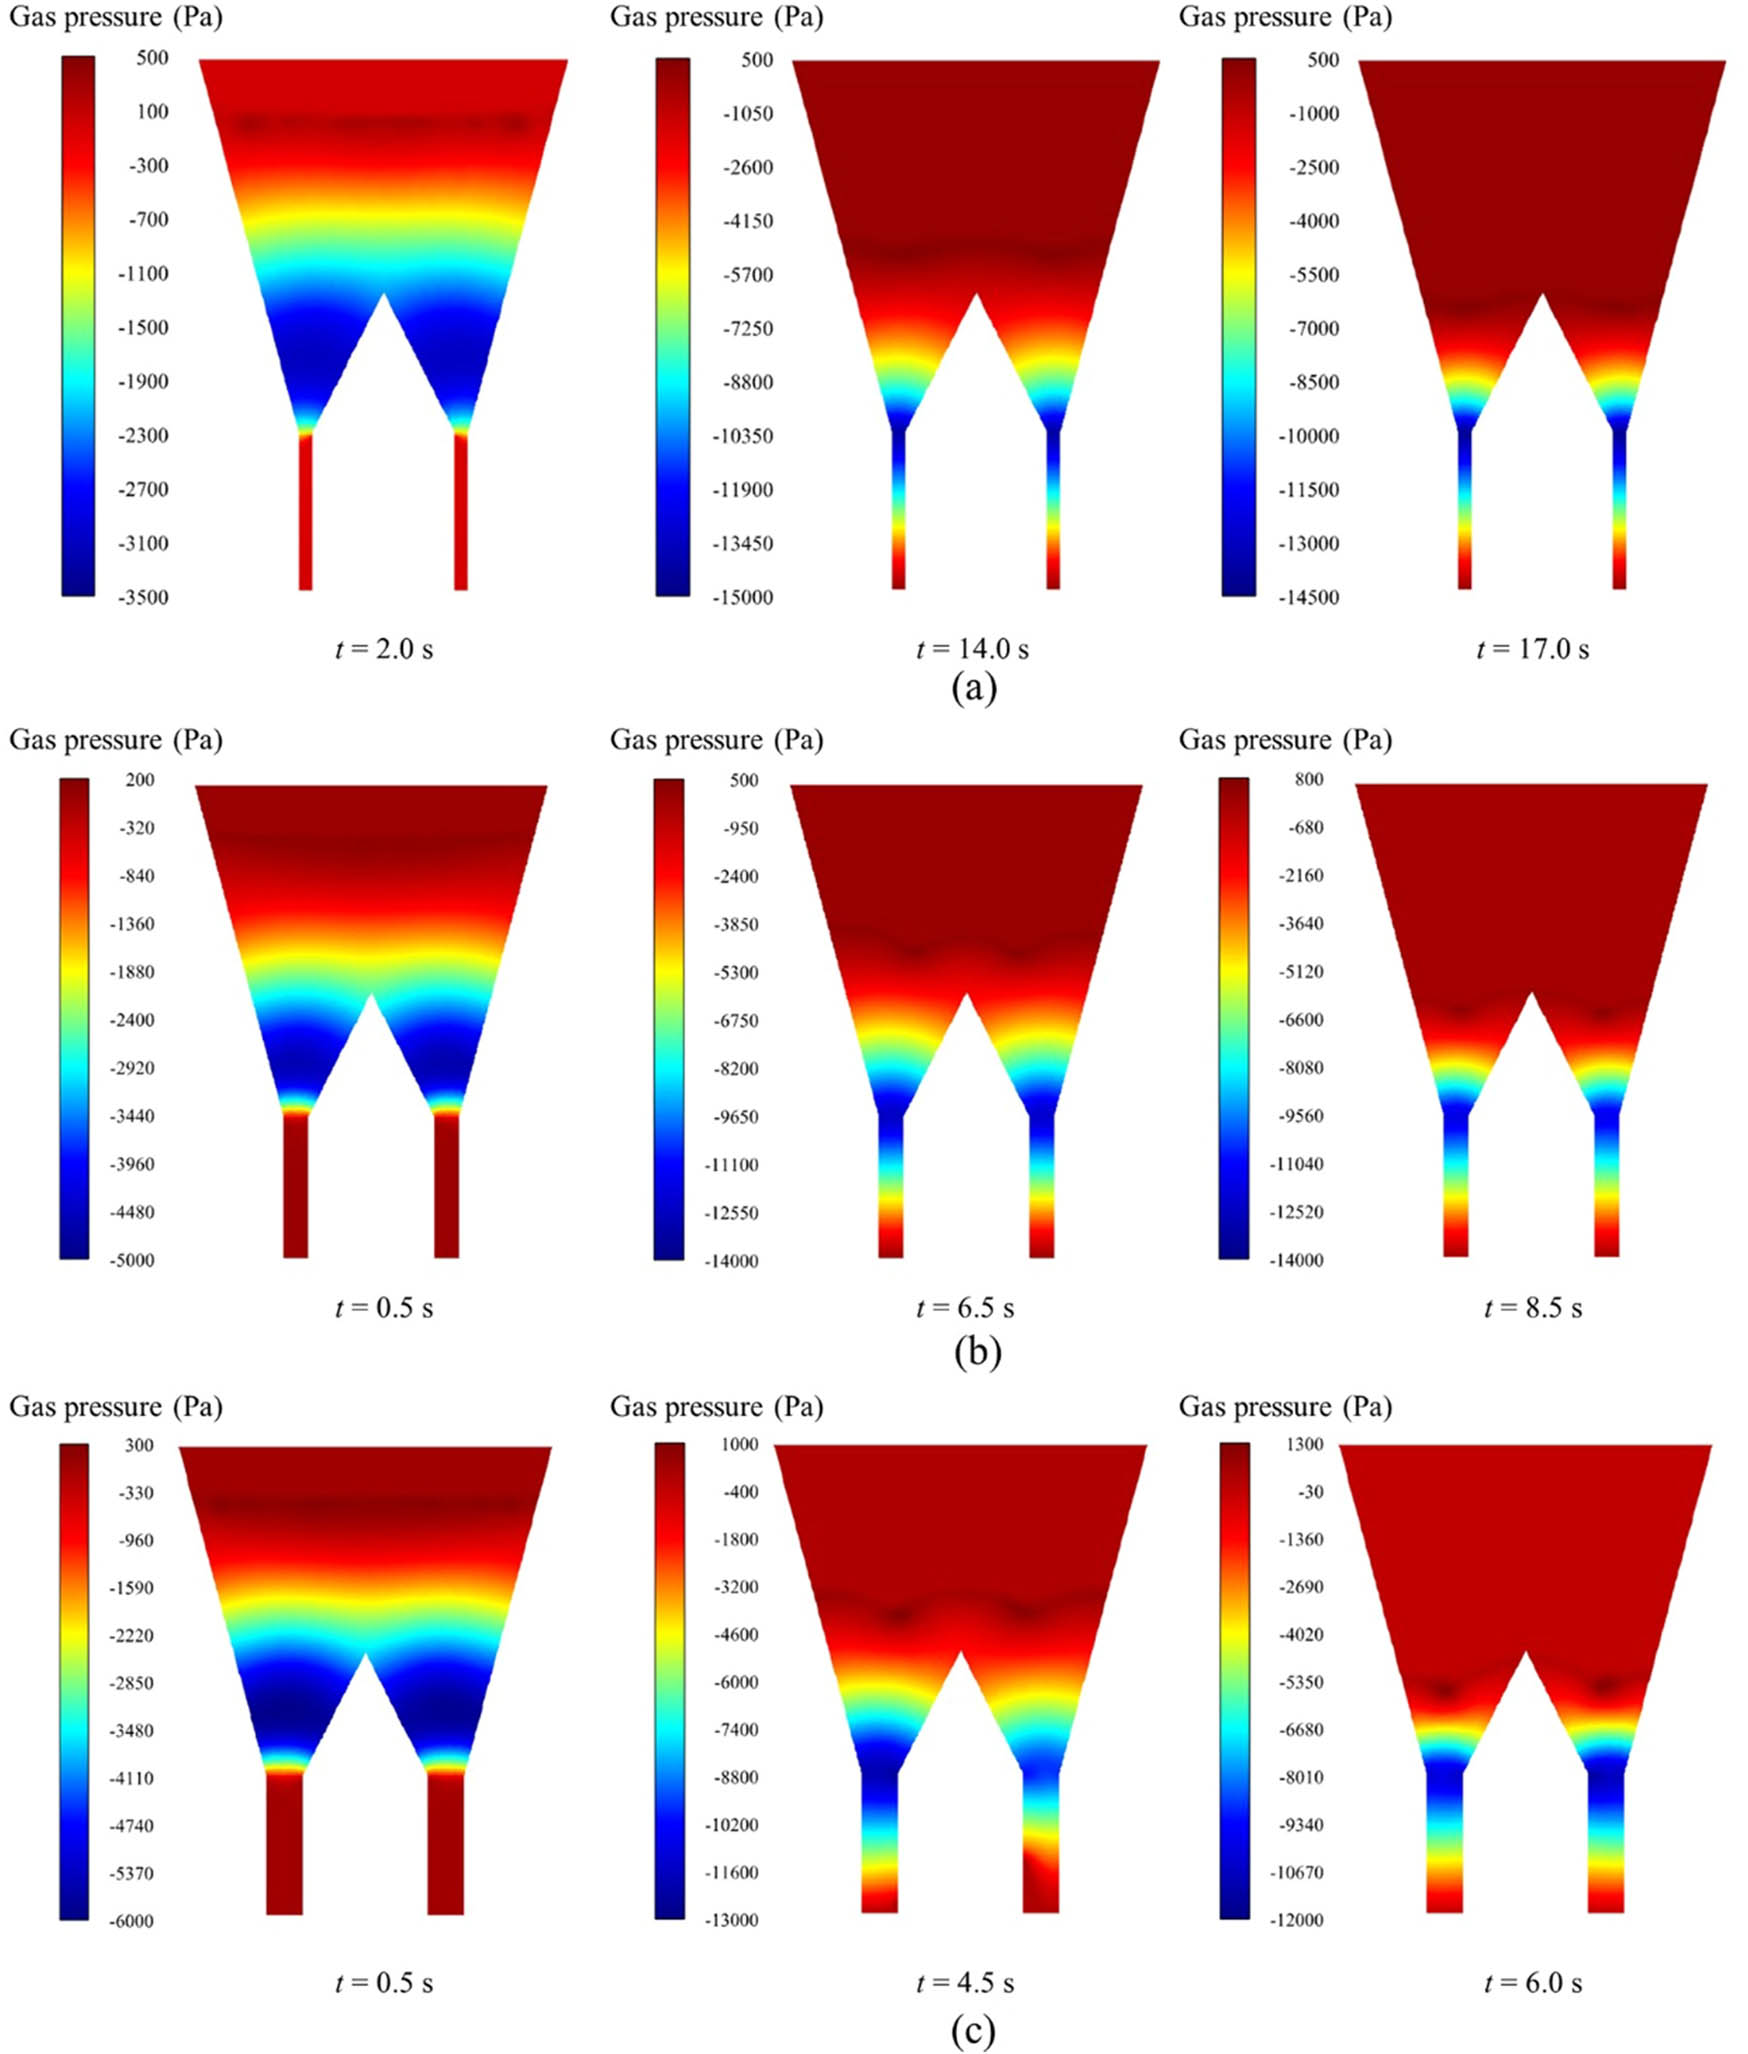
Figure 5
Contours of gas pressure in the hopper during discharge. (a) D o = 0.26 m, (b) D o = 0.52 m, (c) D o = 0.78 m.
Source: Author’s contribution.
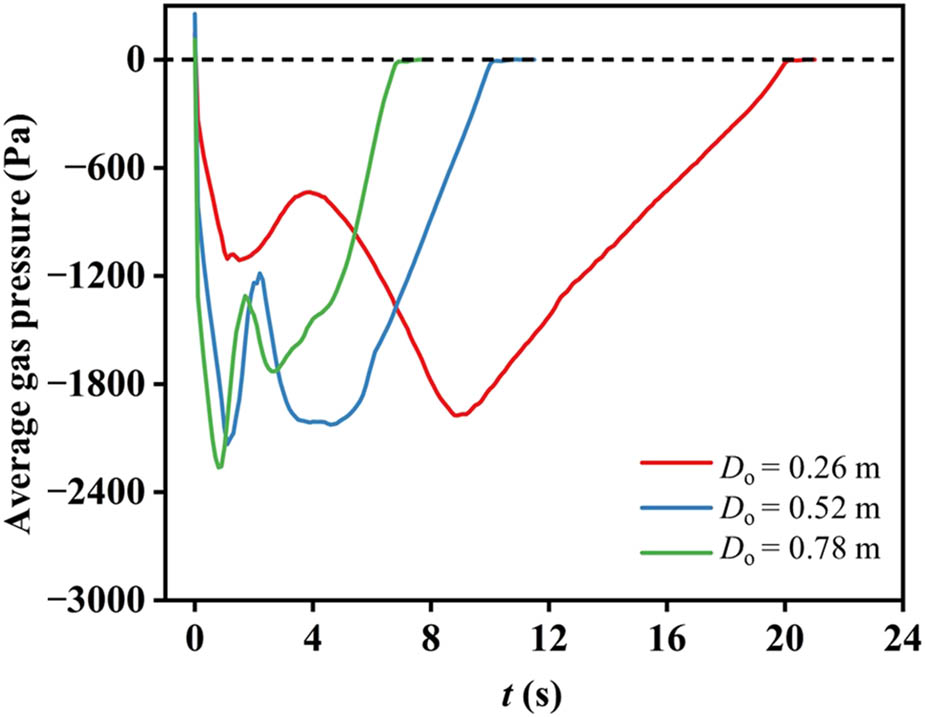
Figure 6
Average gas pressure in the silo system during discharge.
Source: Author’s contribution.
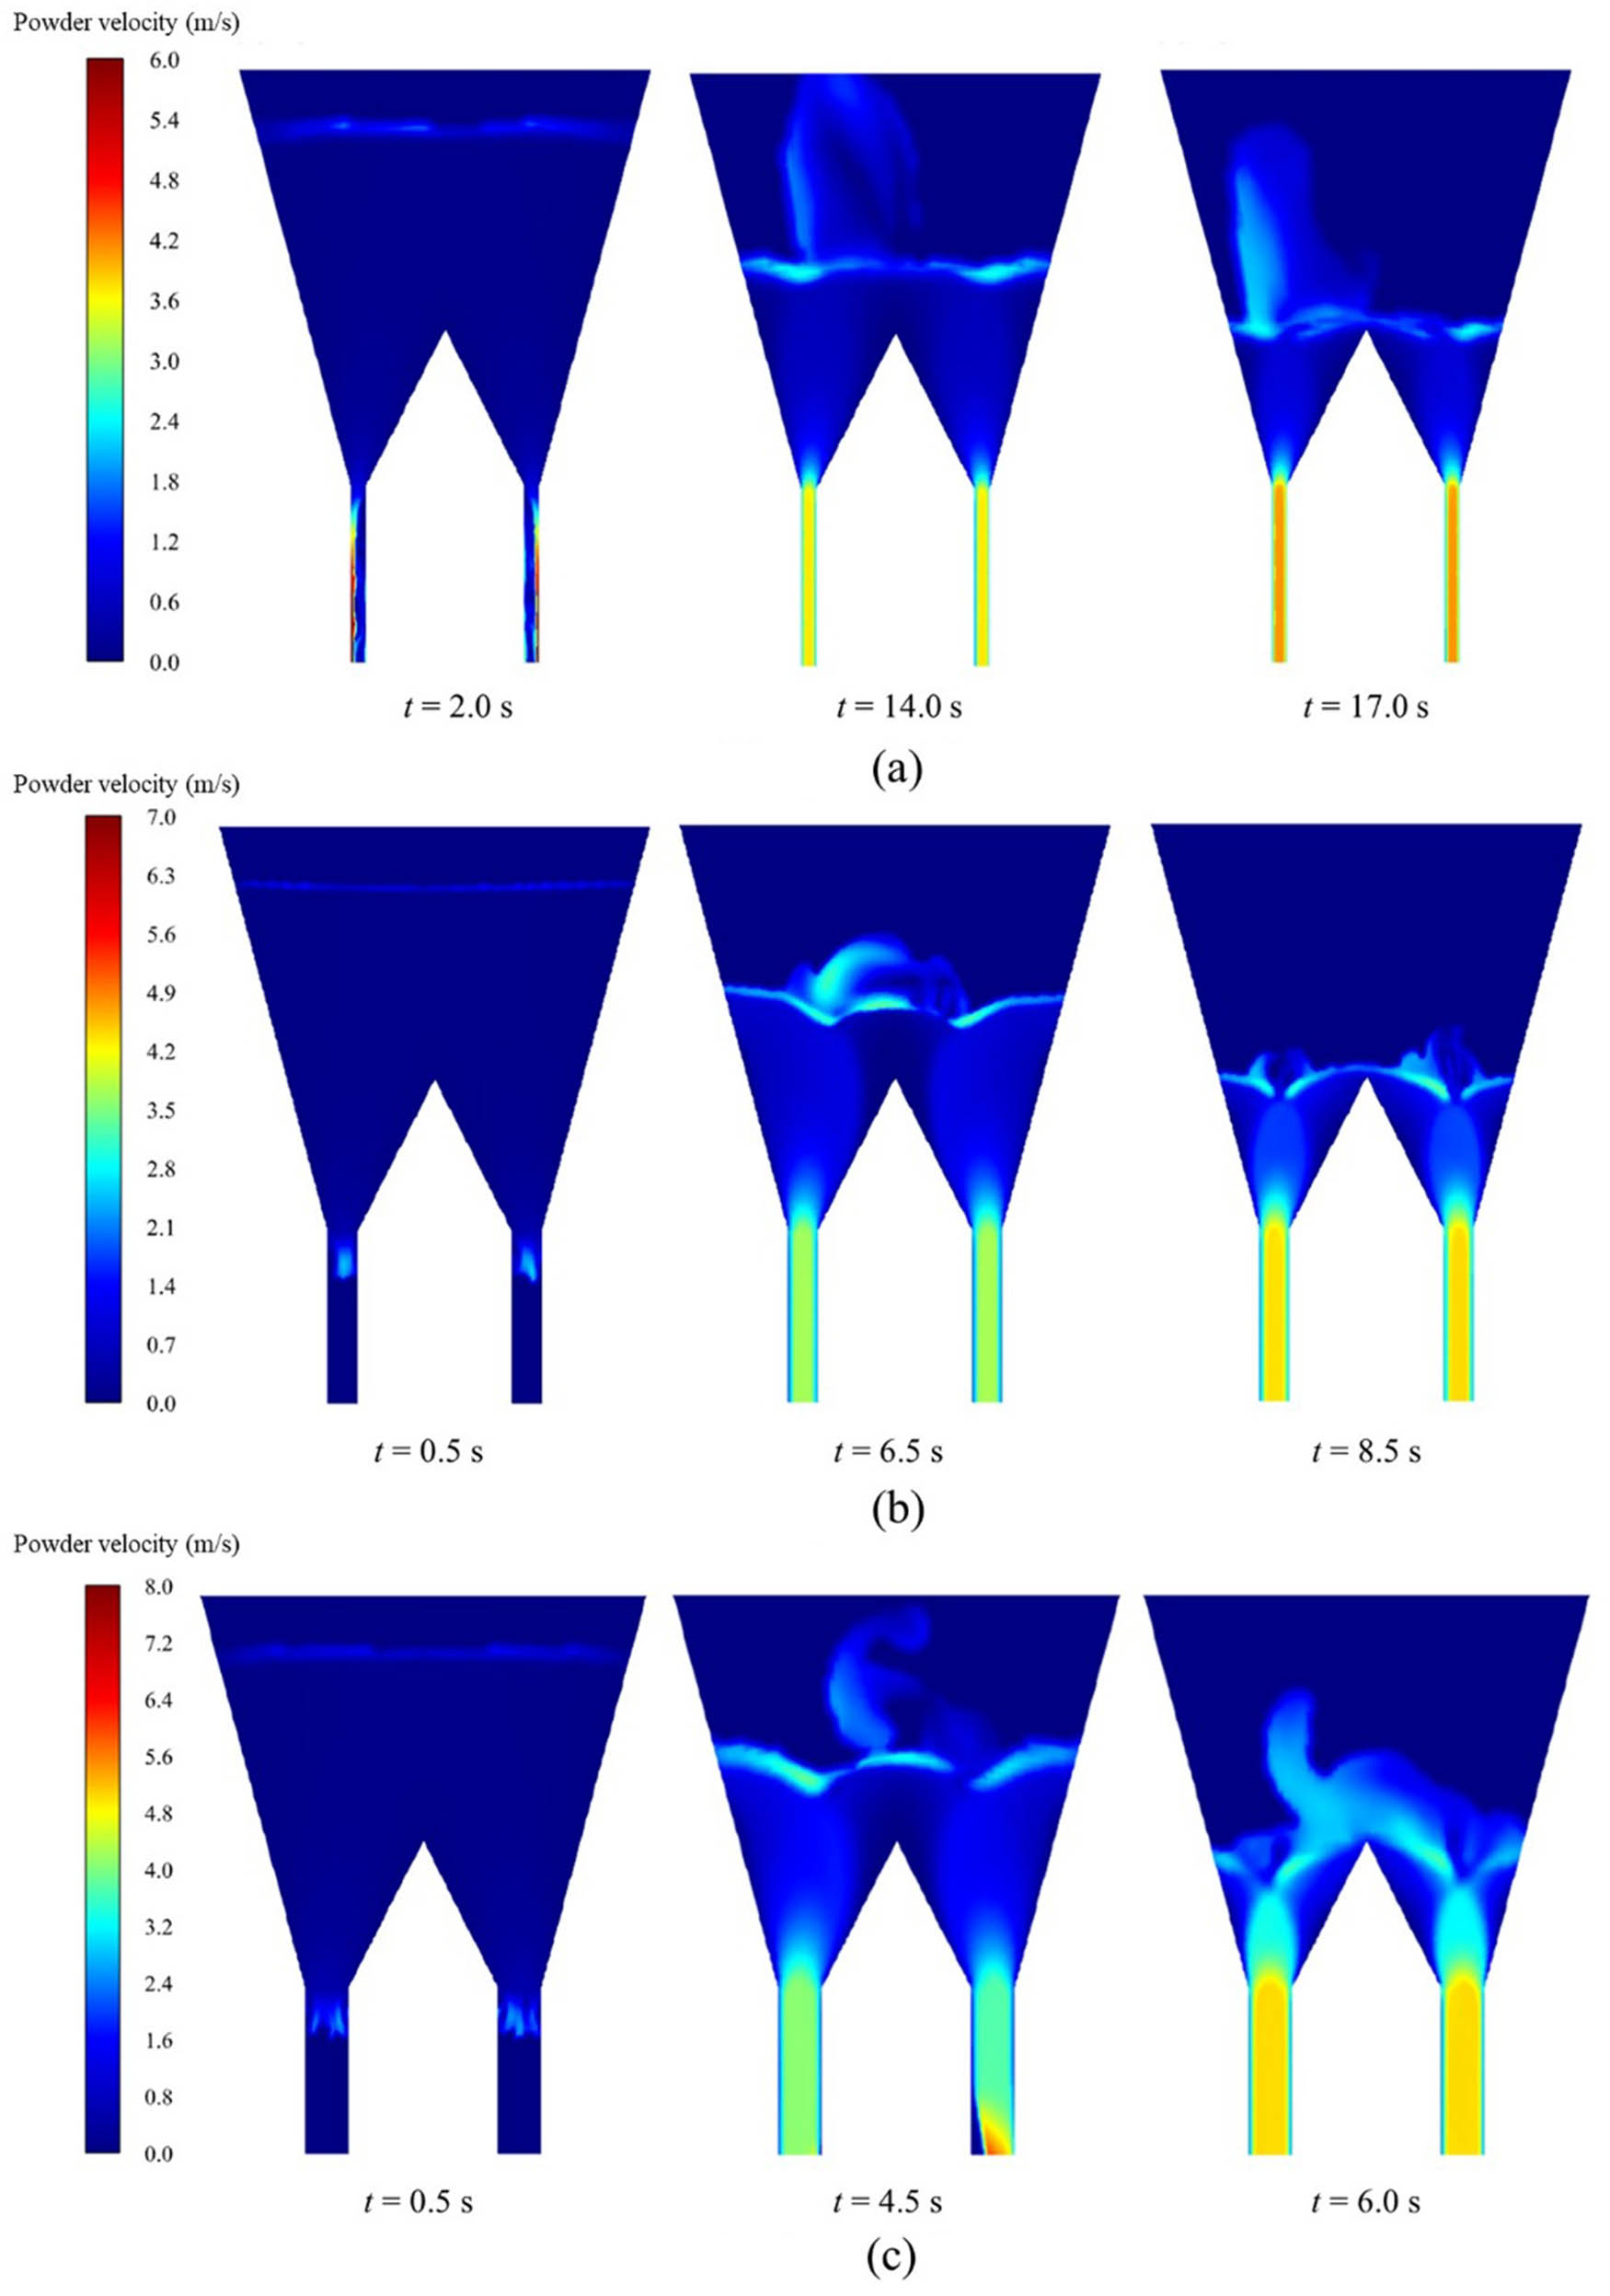
Figure 7
Contours of powder velocity in the silo system during discharge. (a) D o = 0.26 m, (b) D o = 0.52 m, (c) D o = 0.78 m.
Source: Author’s contribution.
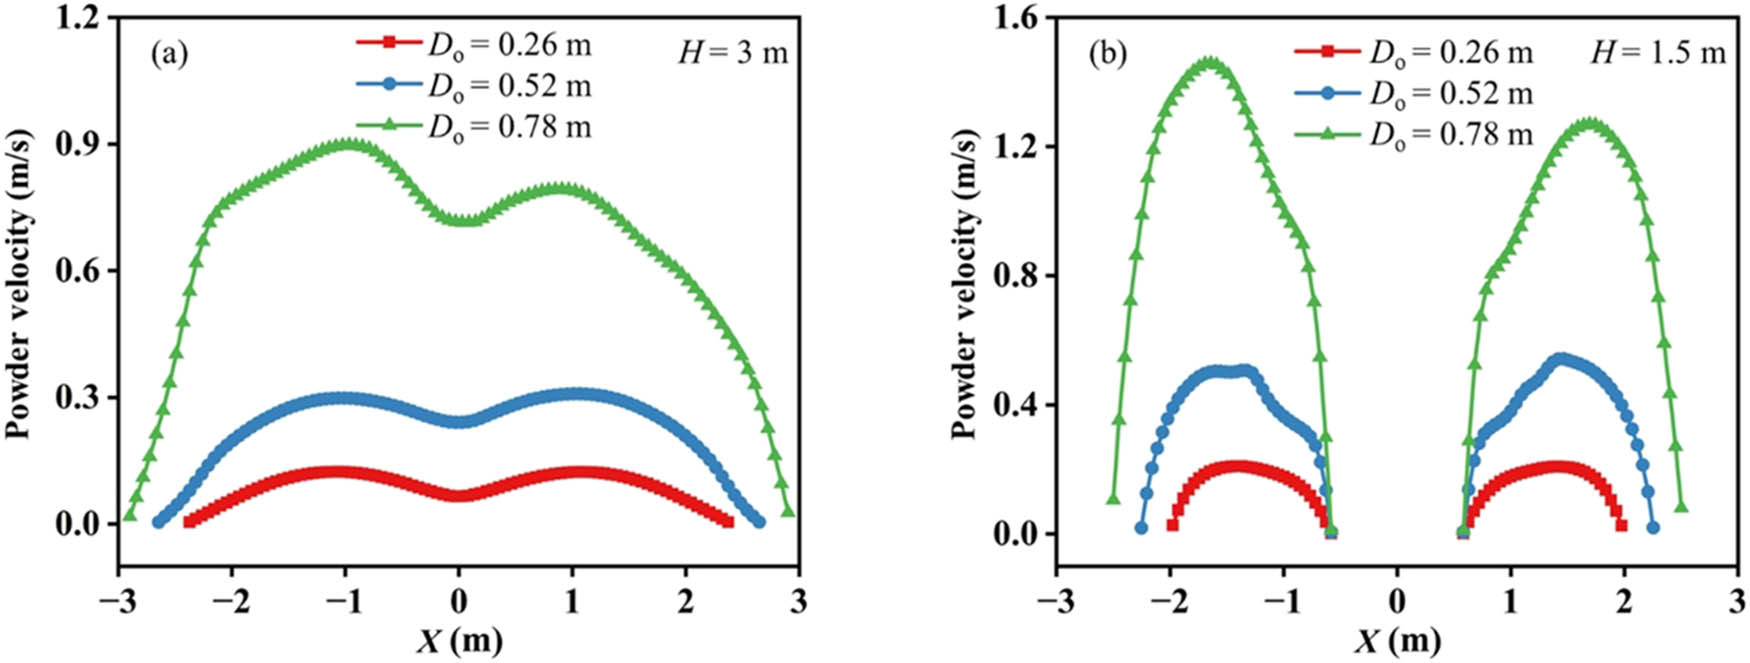
Figure 8
Powder velocity at discharge time t = 2.5 s. (a) H = 3.0 m, (b) H = 1.5 m.
Source: Author’s contribution.
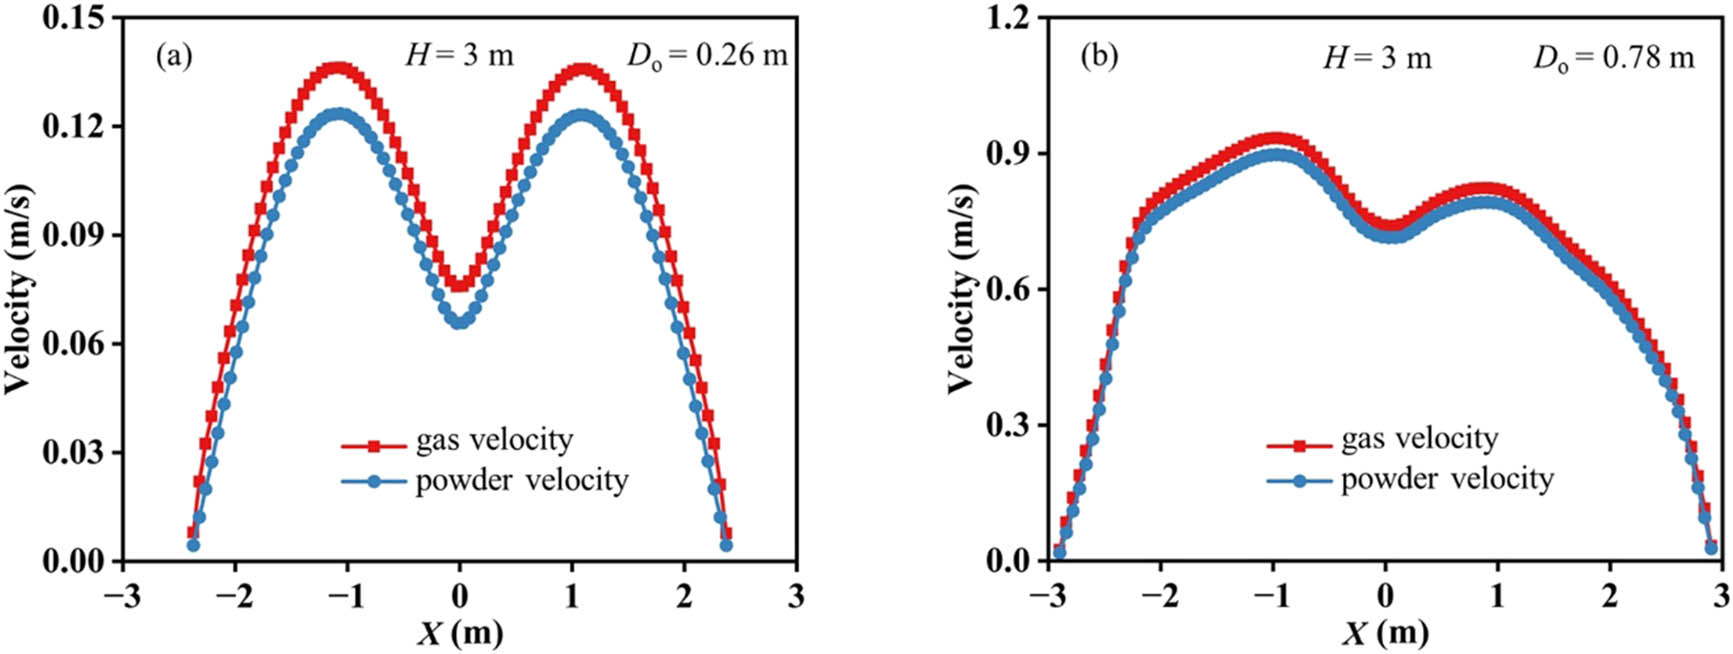
Figure 9
Gas and powder velocity at H = 3 m when t = 2.5 s. (a) D o = 0.26 m, (b) D o = 0.78 m.
Source: Author’s contribution.
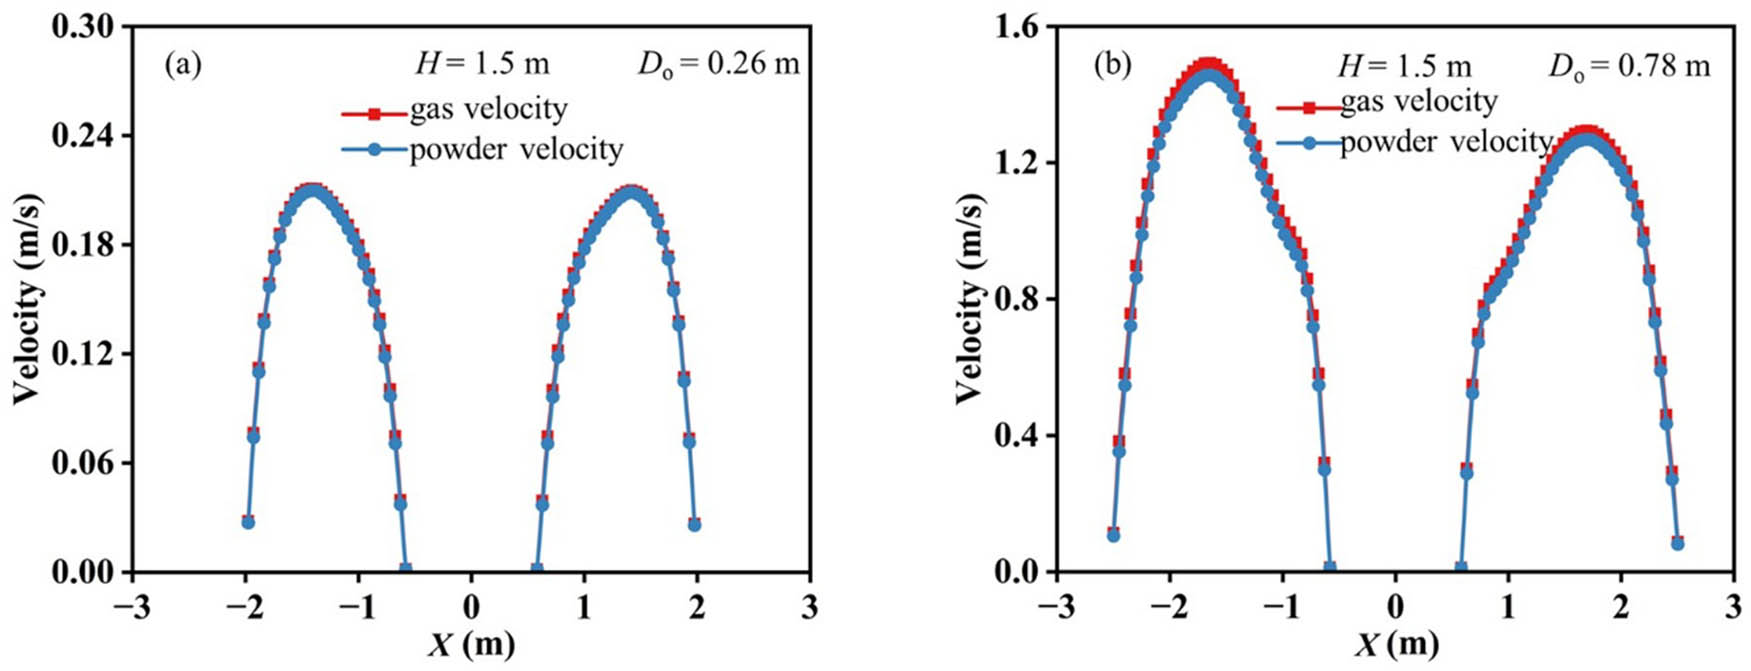
Figure 10
Gas and powder velocity at H = 1.5 m when t = 2.5 s. (a) D o = 0.26 m, (b) D o = 0.78 m.
Source: Author’s contribution.
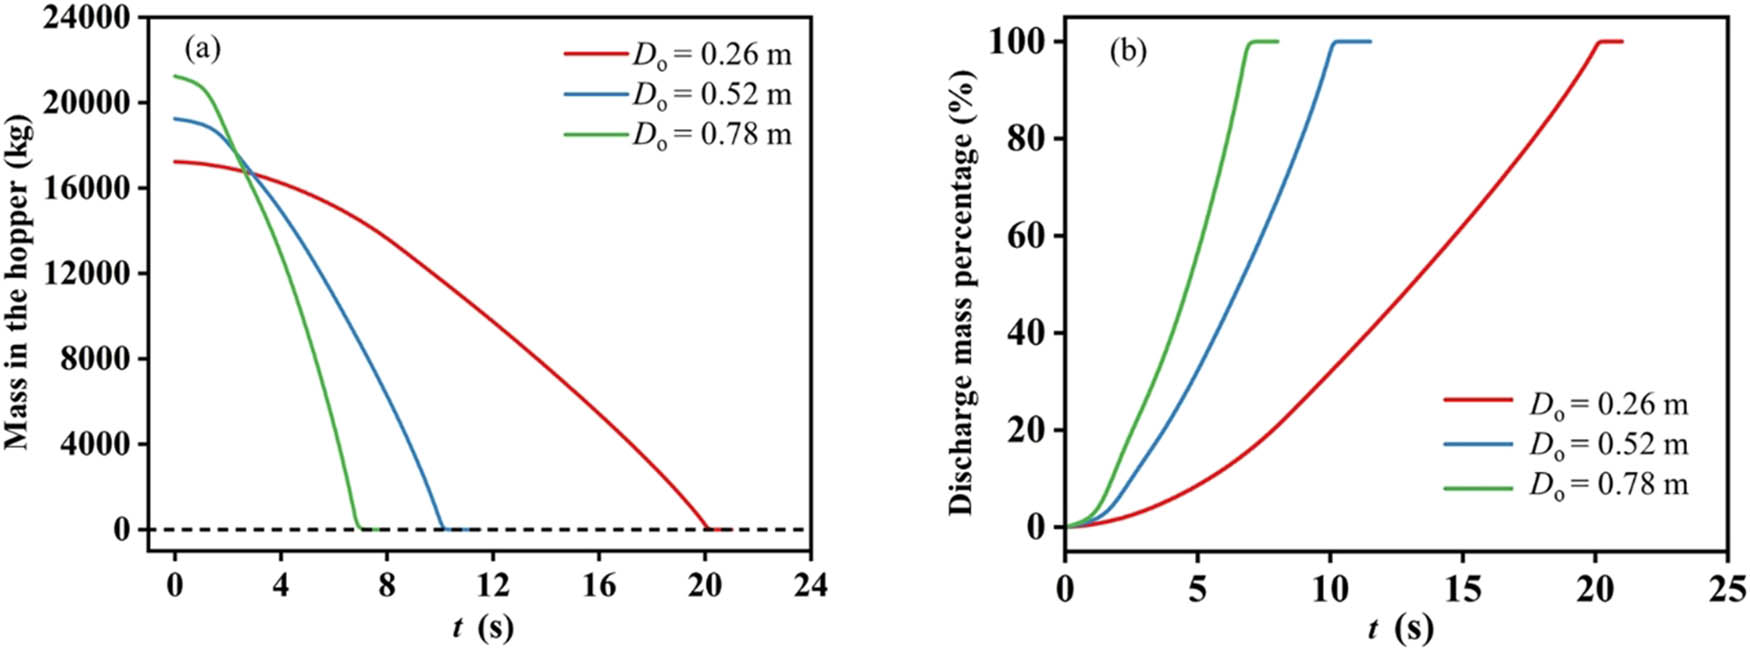
Figure 11
Discharge mass properties during the hopper emptying process. (a) Mass in the hopper, (b) discharge mass percentage.
Source: Author’s contribution.
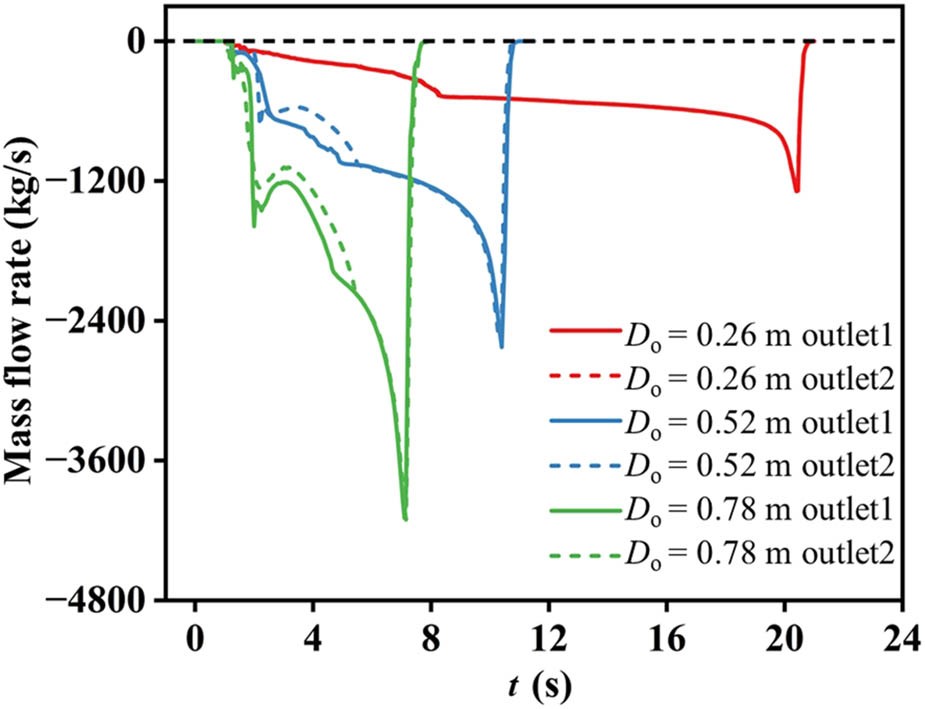
Figure 12
Mass flow rate properties during discharge.
Source: Author’s contribution.