
Figure 1.
Figure 2.
Figure 3.
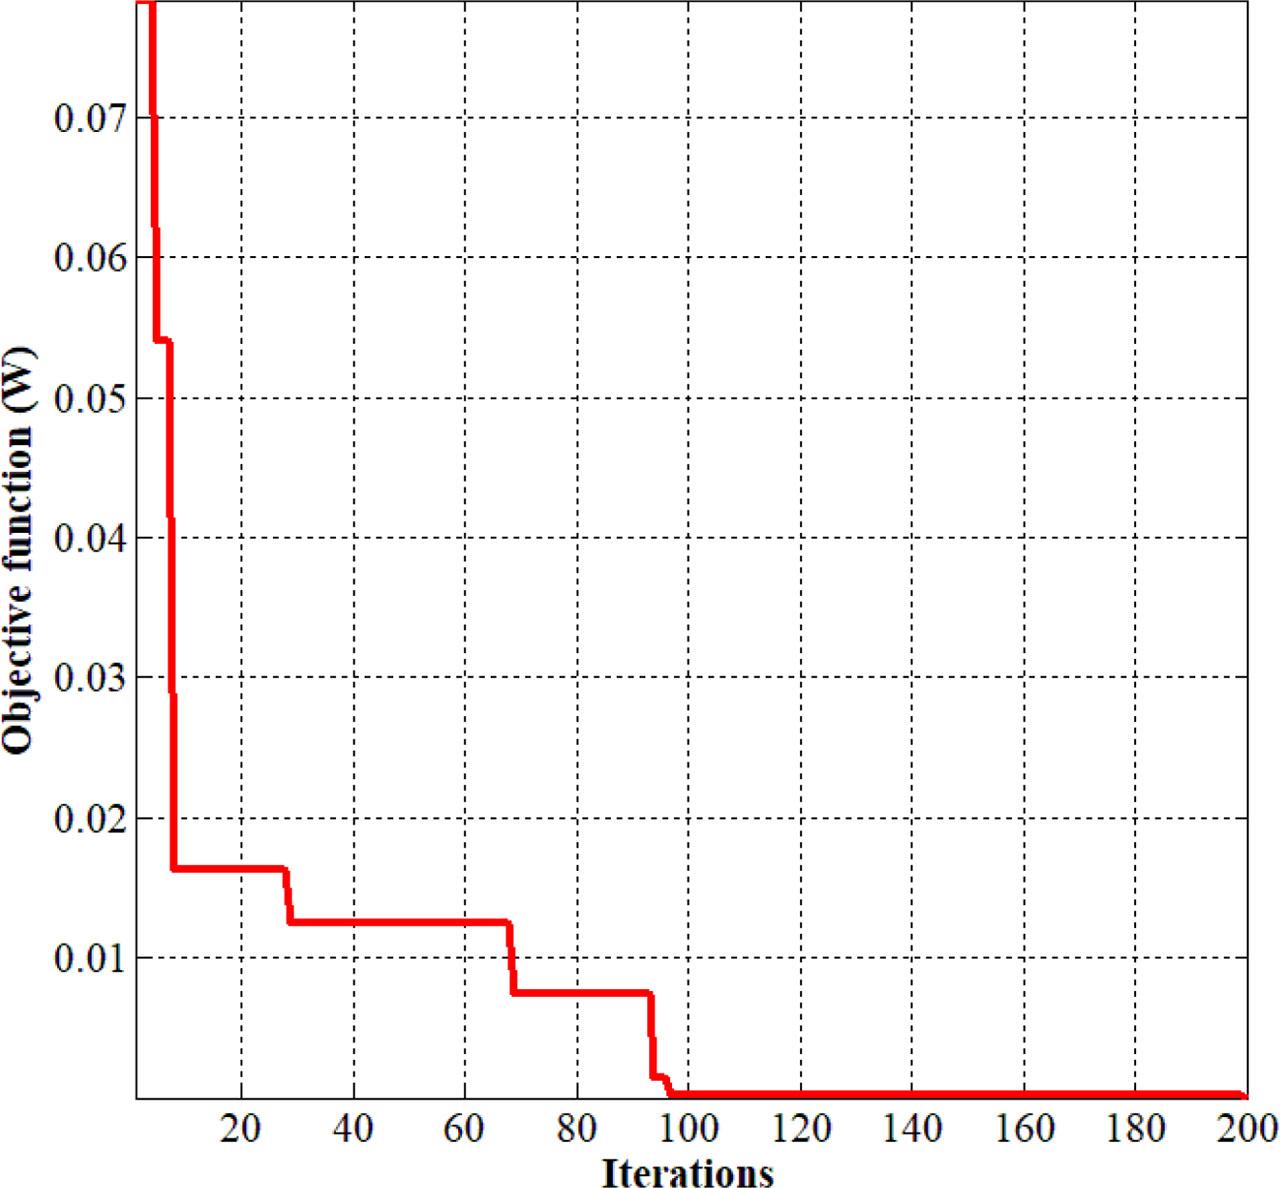
Figure 4.
Figure 5.
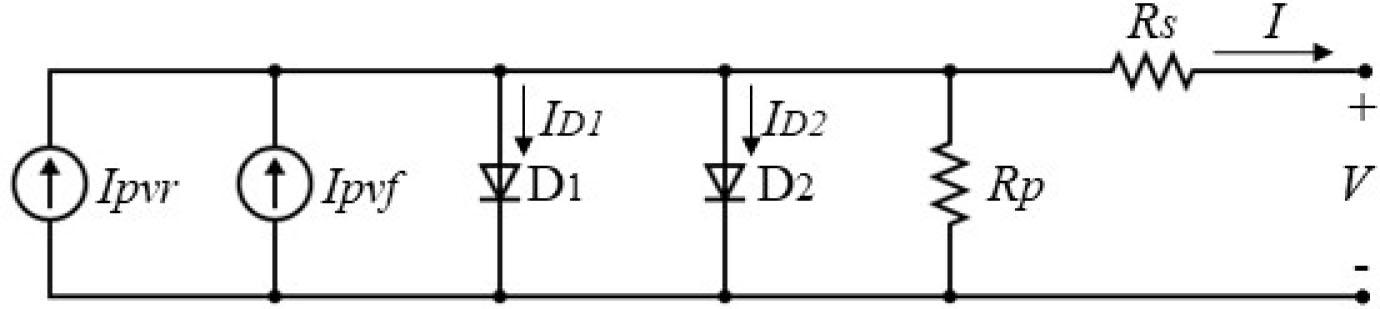
Figure 6.
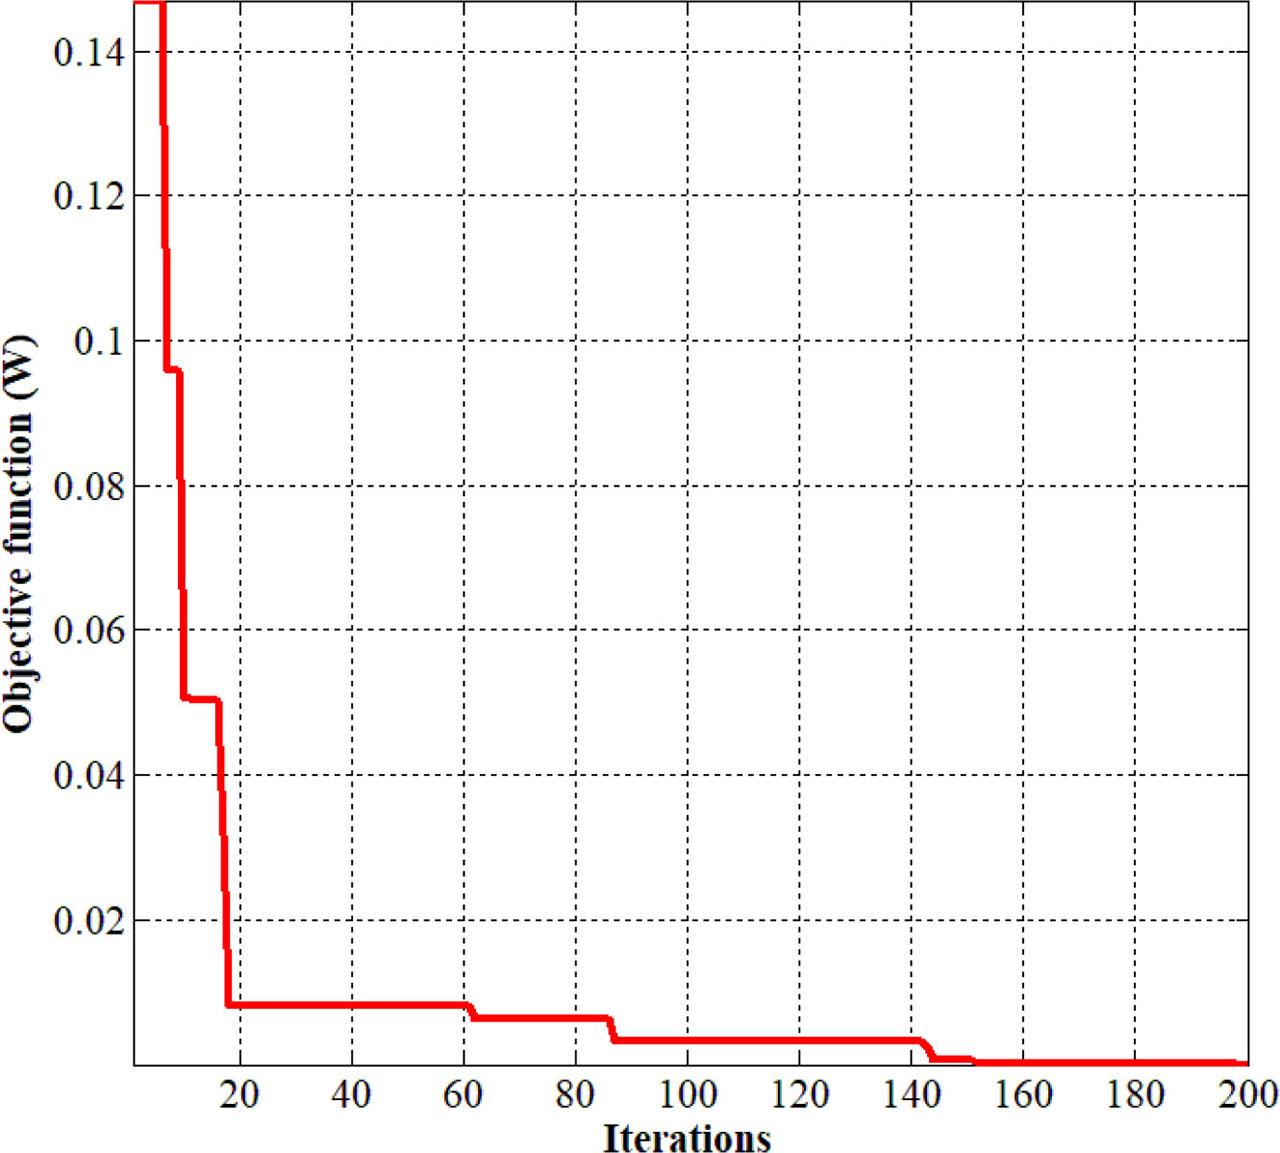
Figure 7.
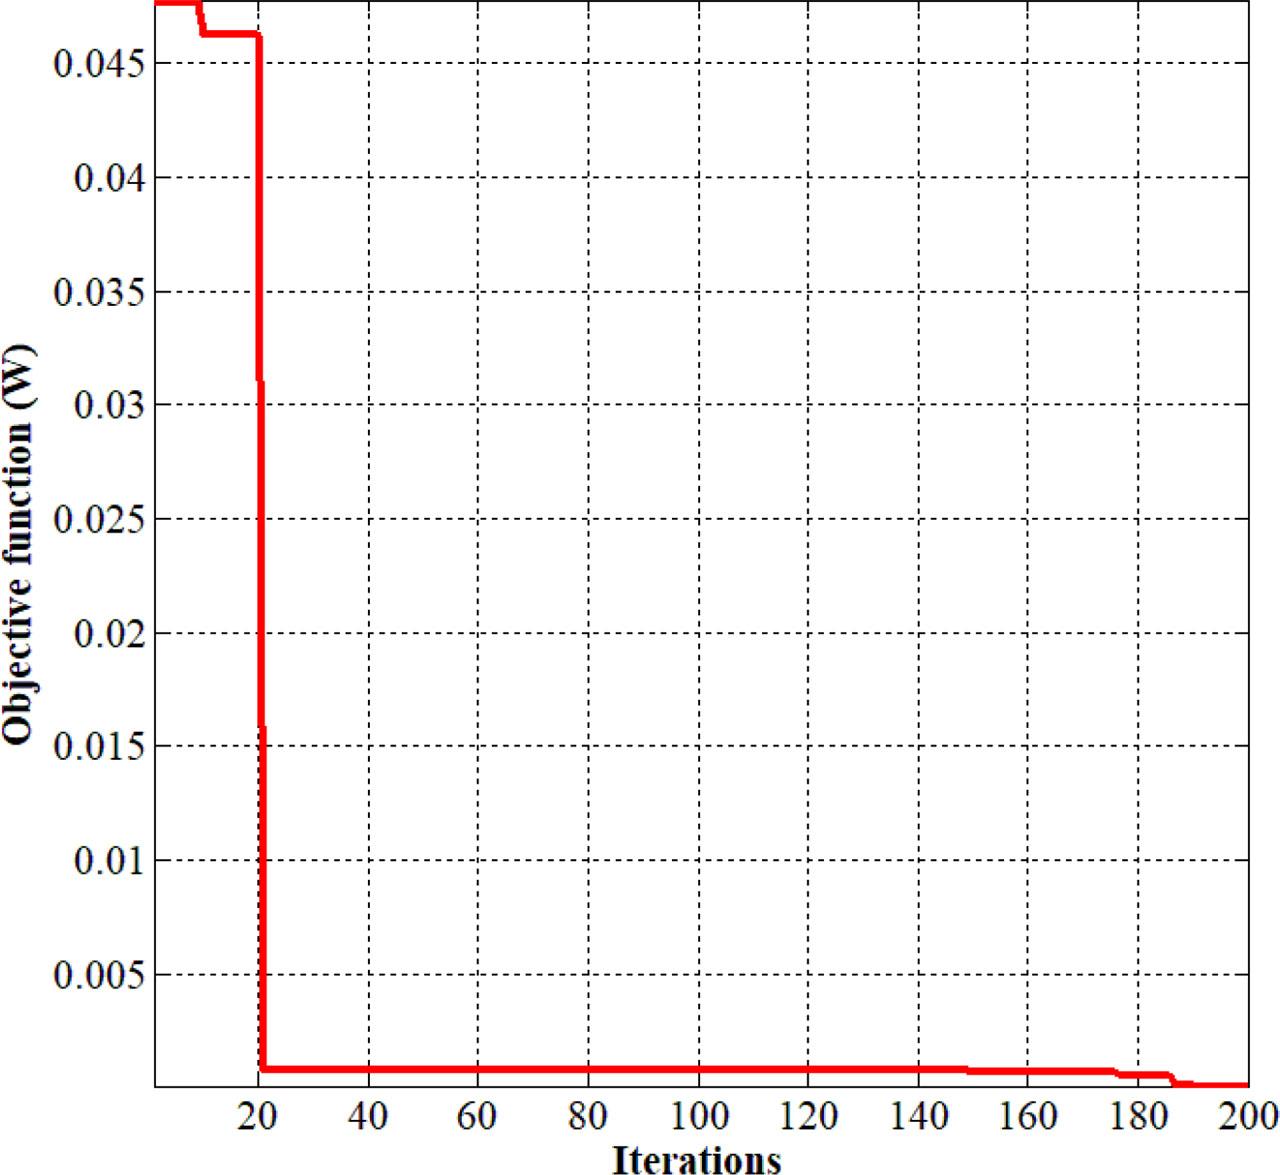
Figure 8.
Optimization data at 1,000 W/m2
| Variables | Unit | Catalog data | MVO solution |
|---|---|---|---|
| Vmppt | (V) | 41.65 | 41.6500012 |
| Rs | (Ω) | / | 0.20019324 |
| ∆P | (W) | / | 1.512/10−5 |
| Pmppt | (W) | 578.102 | 578.10202 |
Optimization data for other solar irradiations
| Parameter | Unit | Values | ||
|---|---|---|---|---|
| 200 (W/m2) | 600 (W/m2) | 1,000 (W/m2) | ||
| Vmppt | (V) | 40.16001 | 41.3000064 | 41.6500012 |
| Rs | (Ω) | 0.2 | 0.2 | 0.20019324 |
| ∆P | (W) | 4.872/10−5 | 6.502/10−5 | 1.512/10−5 |
| Pmppt, MVO | (W) | 110.44005 | 313.46707 | 578.10202 |
| Pmppt, catalog | (W) | 110.44 | 313.467 | 578.10202 |
Parameters of the analyzed module given by the producer with included bifaciality of 10%
| Parameters | Unit | Values |
|---|---|---|
| Peak power | (Wp) | 578 |
| Maximum voltage per MPPT | (V) | 41.65 |
| Maximum current per MPPT | (A) | 13.88 |
| Open circuit voltage | (V) | 49.93 |
| Short circuit current | (A) | 14.93 |
| Ns | (# of cells) | 60 |
| KI | (%/°C) | 0.00543 |
| KV | (%/°C) | −0.136 |
| GSTC | (W/m2) | 1,000 |
Optimization parameters and their optimization bounds
| Variables | Description | Lower boundary | Upper boundary |
|---|---|---|---|
| Vmppt (V) | Voltage at MPPT | 40 | 42 |
| Rs (Ω) | PV cell series resistance | 0.1 | 0.3 |
Comparative optimization data at 1,000 W/m2 and 20°C
| Methods | Parameters | ||
|---|---|---|---|
| Vmpp | Pmpp | ∆P | |
| (V) | (W) | (W) | |
| Catalogue data | 41.65 | 578.102 | / |
| MVO | 41.6500004 | 578.10205 | 5.373/10−6 |
| GA | 41.362 | 578.11667 | 0.014674 |
Standard parameters of the analyzed module given by the producer
| Parameters | Unit | Values |
|---|---|---|
| Peak power | (Wp) | 540 |
| Maximum voltage per MPPT | (V) | 41.64 |
| Maximum current per MPPT | (A) | 12.97 |
| Open circuit voltage | (V) | 49.60 |
| Short circuit current | (A) | 13.86 |
| Efficiency | (%) | 20.9 |
| Area of the module | (m2) | 2.58 |