
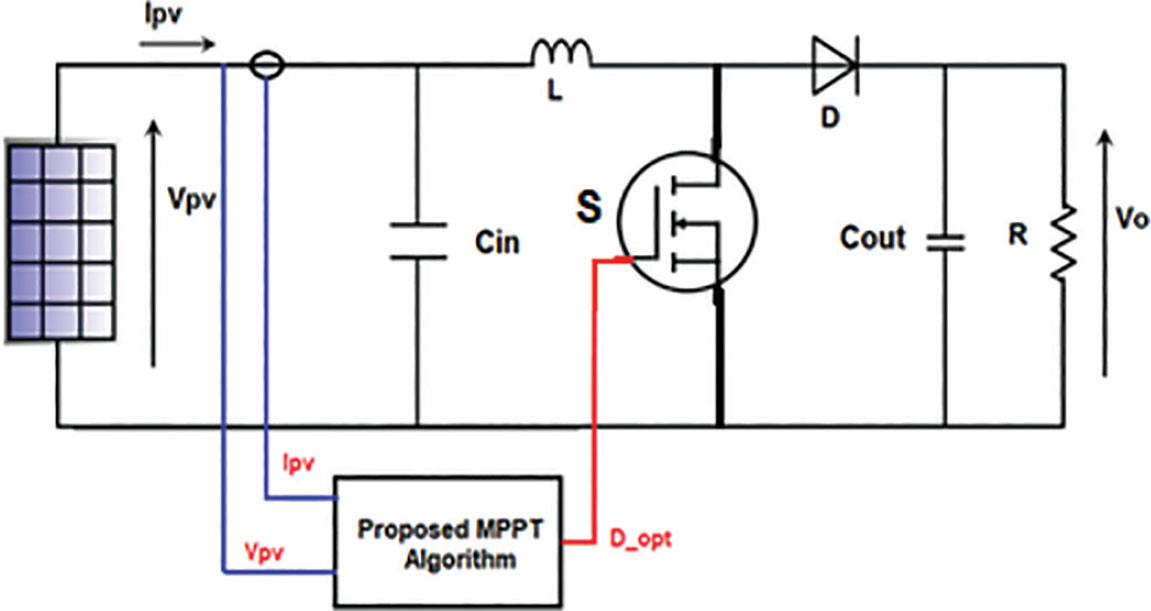
Figure 1.
General PV conversion chain. PV, photovoltaic.
Table 1.
Electrical specifications of the PV panels.
| Pmax | Voc | Isc | Vmp | Imp | |
|---|---|---|---|---|---|
| PV module | 213.15 W | 36.3 V | 7.84 A | 29 V | 7.35 A |
| PV installation | 426.3 W | 72.6 V | 7.84 A | 58 V | 7.35 A |
Table 2.
Electrical specifications of the boost converter.
| Parameter | Noun | Value |
|---|---|---|
| Boost converter | ||
| L | Inductance (mH) | 1.1478 |
| Cin | Input capacitor (µF) | 6,800 |
| Cout | Output capacitor (µF) | 3,300 |
| F | PWM frequency (kHz) | 10 |
| Load | ||
| R | Resistive load (Ω) | 100 |
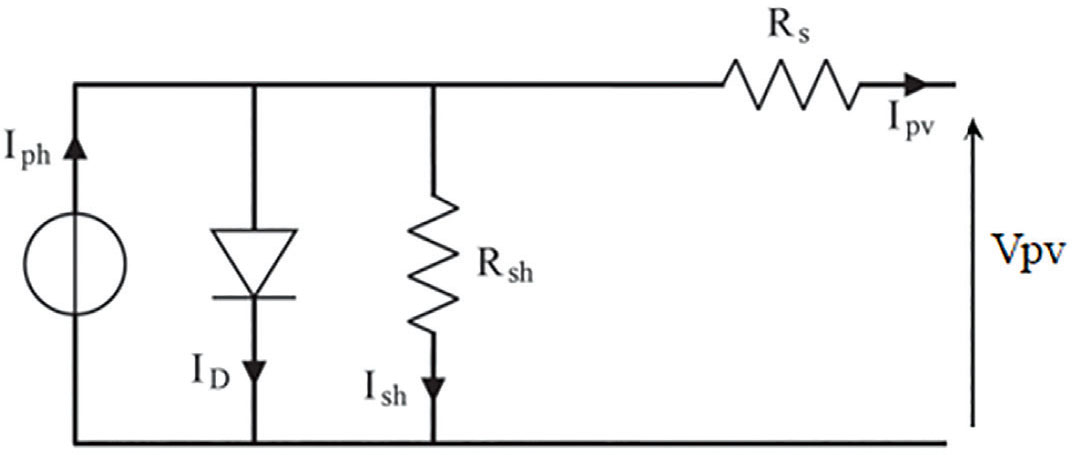
Figure 2.
Equivalent circuit diagram of solar cell.
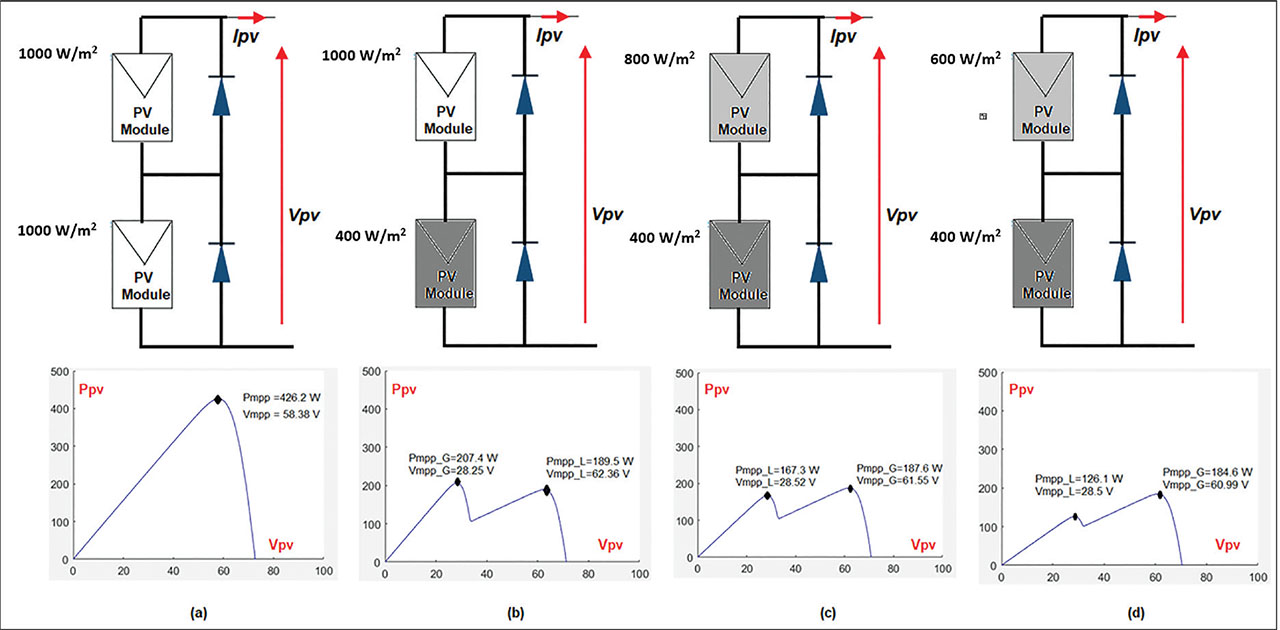
Figure 3.
Configuration of PV modules under different static PSCs. (A) Scenario 1—STC. (B) Scenario 2. (C) Scenario 3. (D) Scenario 4. PSCs, partial shading conditions; PV, photovoltaic; STC, standard test conditions.
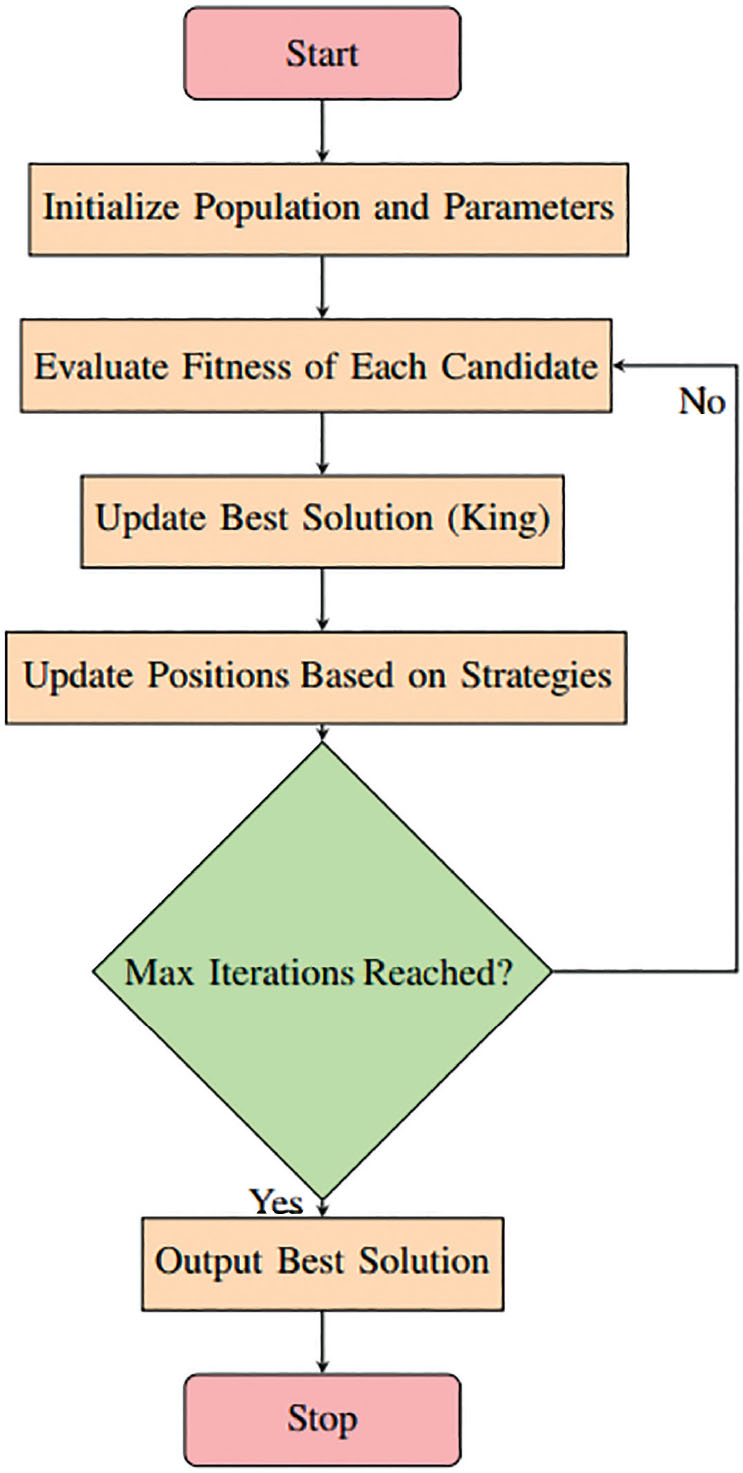
Figure 4.
Flowchart of WSO algorithm. WSO, war strategy optimization.
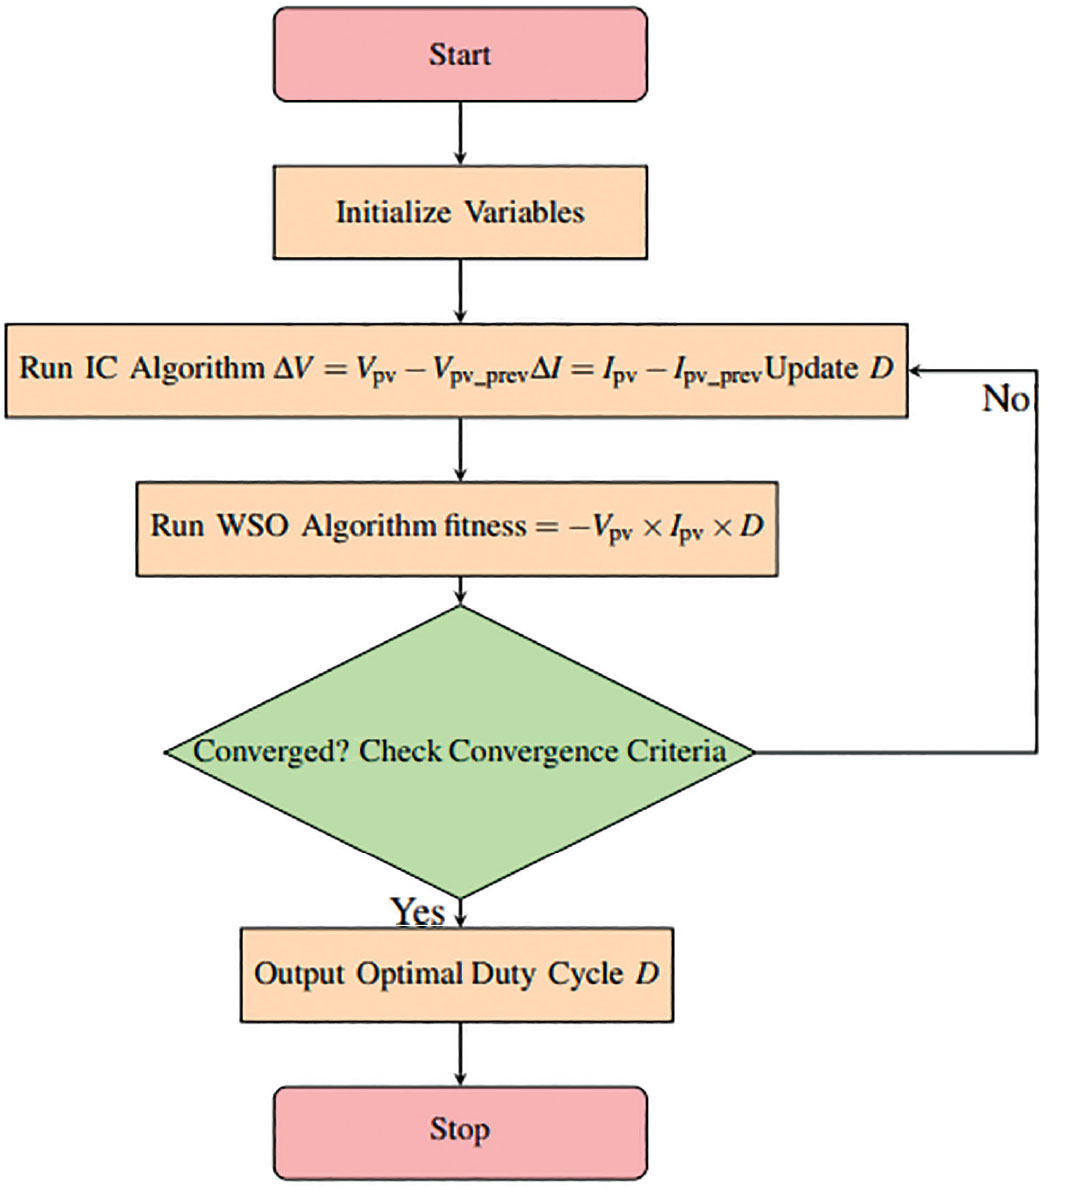
Figure 5.
Flowchart of hybrid WSO-IC Algorithm. WSO-IC, war strategy optimization-incremental conductance.
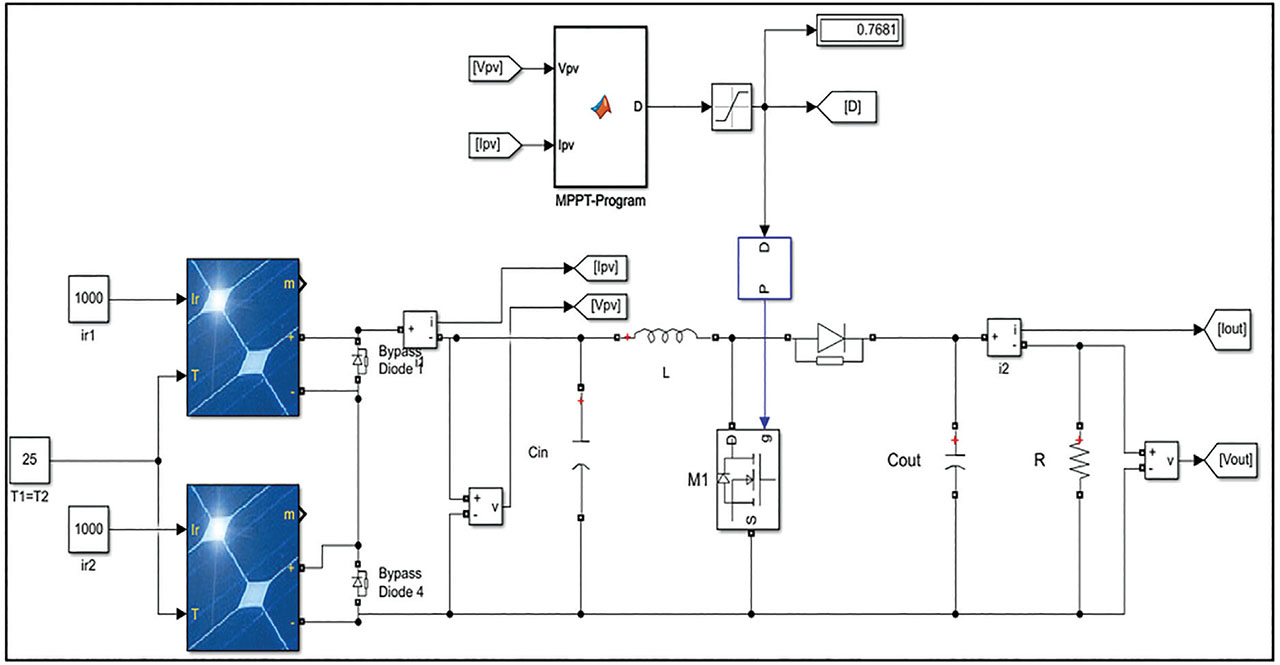
Figure 6.
Diagram of the 426.3 W peak power PV system simulated in SIMULINK. PV, photovoltaic.
Table 3.
Optimal duty cycle calculated for each scenario
| Scenario | Pmpp (W) | D_opt |
|---|---|---|
| Scenario 1 | Pmpp = 426.3 | D_opt_G = 0.71721425 |
| Scenario 2 | Pmpp_G = 207.4 | D_opt_G = 0.80383836 |
| Pmpp_L = 189.5 | D_opt_L = 0.54699656 | |
| Scenario 3 | Pmpp_G = 187.6 | D_opt_G = 0.55062217 |
| Pmpp_L = 167.3 | D_opt_L = 0.77950357 | |
| Scenario 4 | Pmpp_G = 184.6 | D_opt_G = 0.55110705 |
| Pmpp_L = 126.1 | D_opt_L = 0.74620251 |
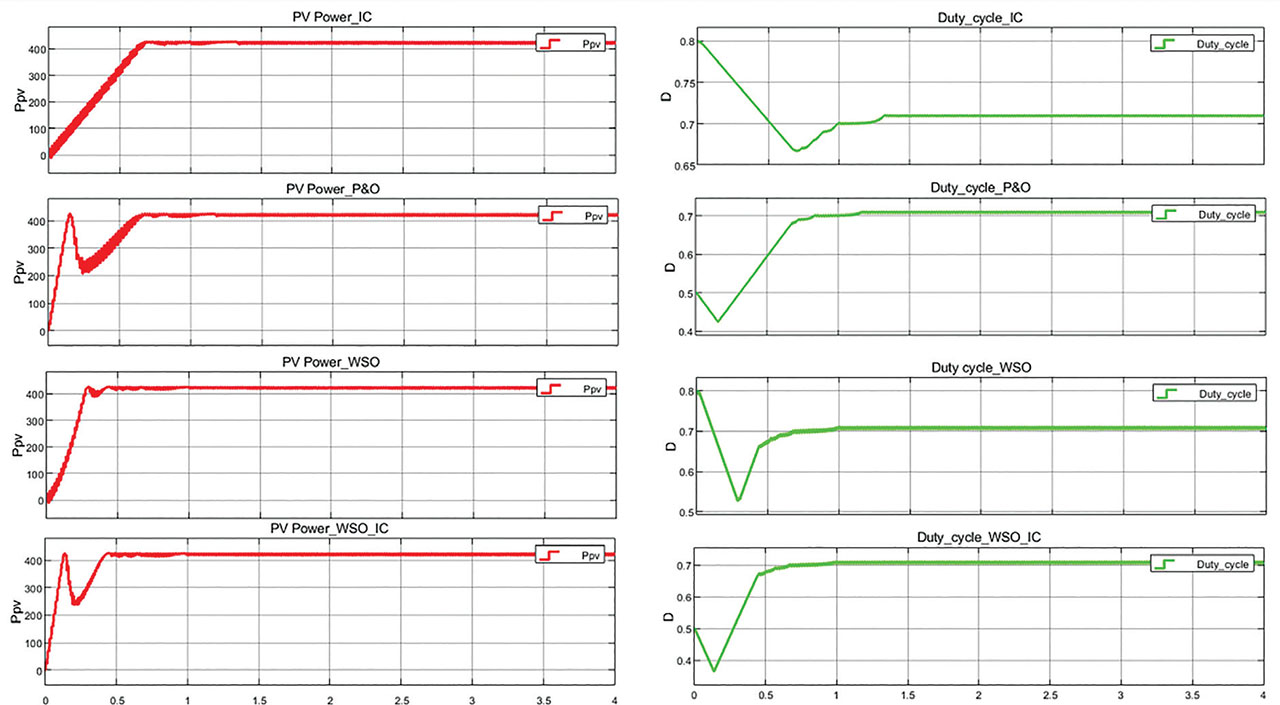
Figure 7.
Power Ppv and duty cycle under standard conditions (Scenario 1-STC). STC, standard test conditions.
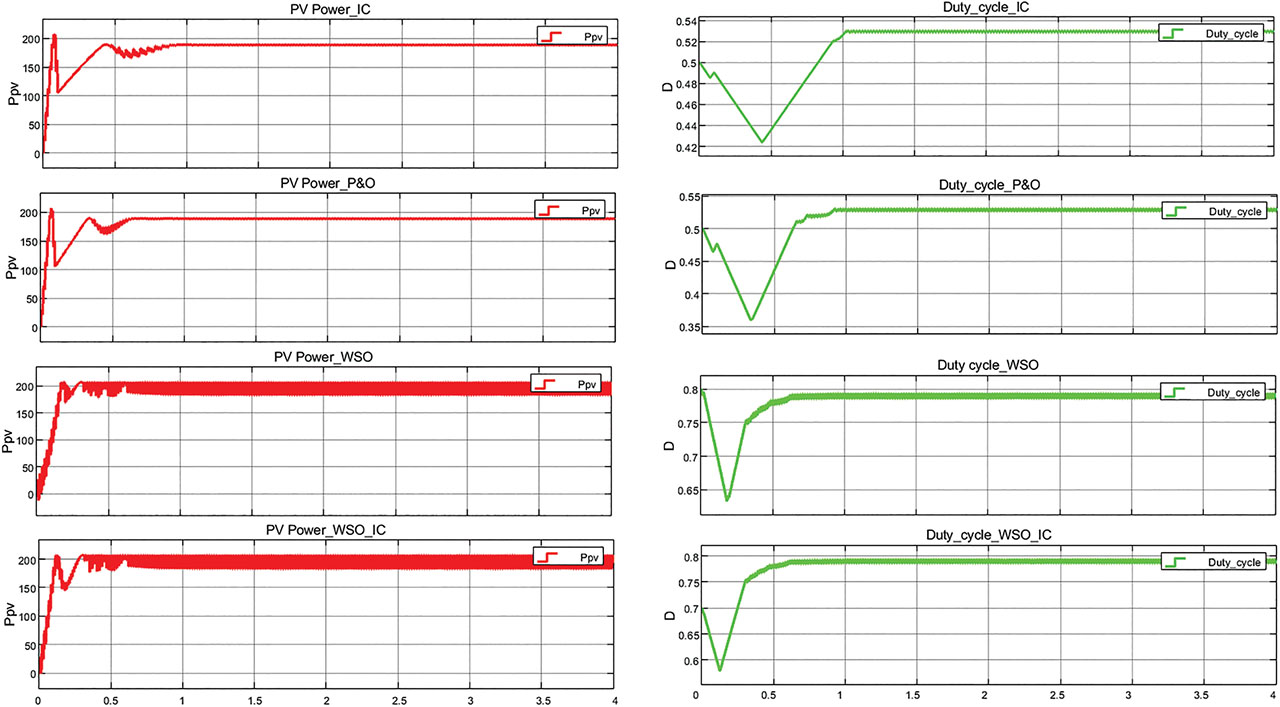
Figure 8.
Power Ppv and duty cycle under PSCs (Scenario 2). PSCs, partial shading conditions.
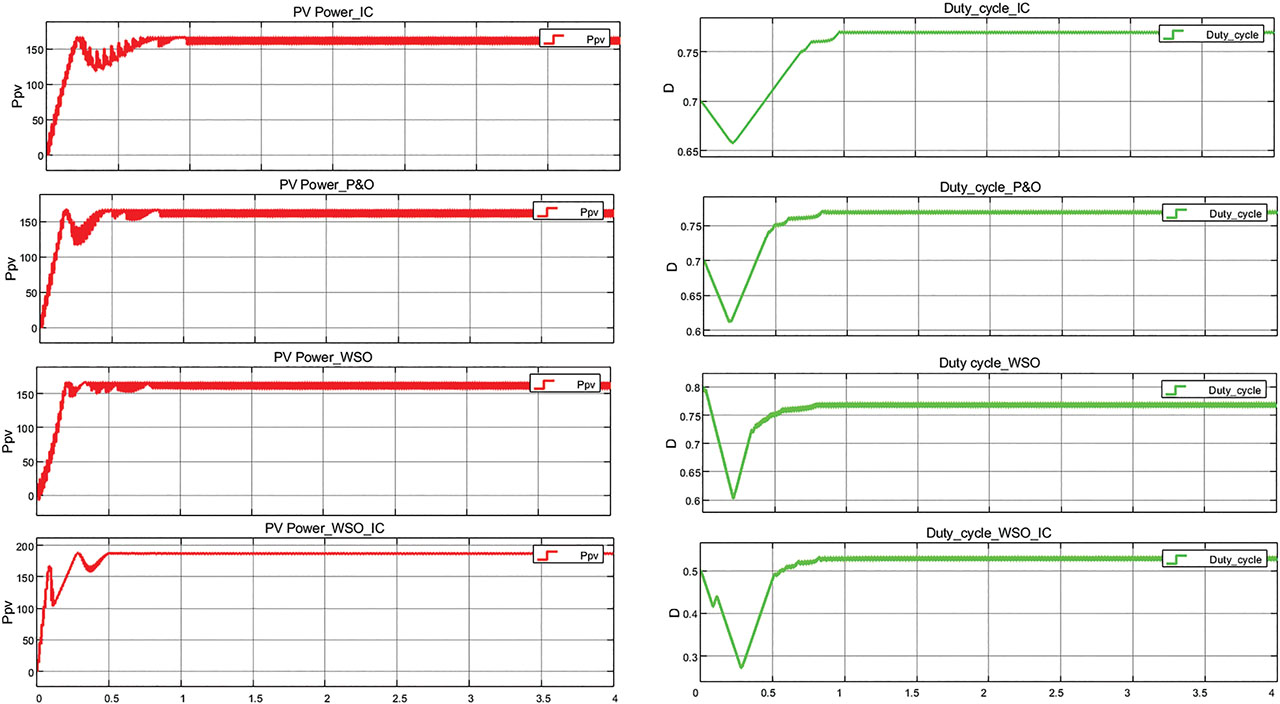
Figure 9.
Power Ppv and duty cycle under PSCs (Scenario 3). PSCs, partial shading conditions.
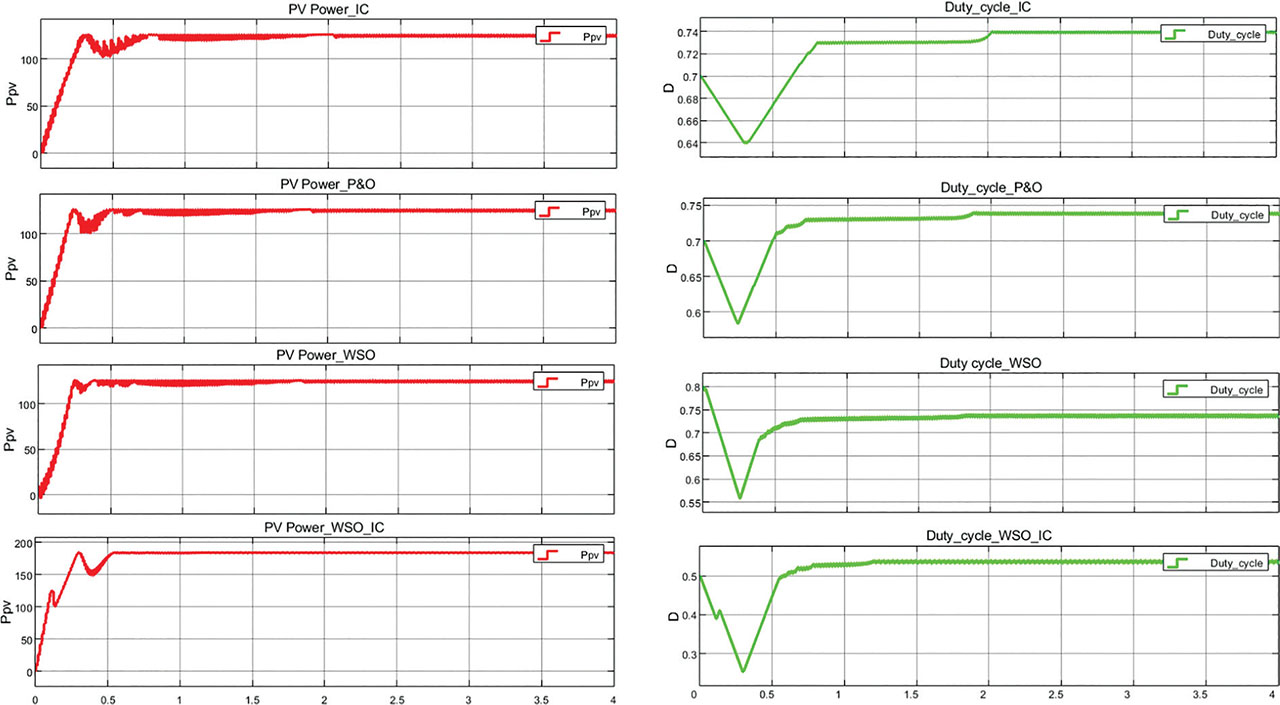
Figure 10.
Power Ppv and duty cycle under PSCs (Scenario 4). PSCs, partial shading conditions.
Table 4.
Comparison of algorithm performance across different scenarios
| Algorithm | Convergence time (ms) | Duty cycle | Tracking error (%) | Ppv (w) | Efficiency (%) |
|---|---|---|---|---|---|
| Scenario 1: Ir1 = Ir2 = 1000 W/m2, T1 = T2 = 25 C, Pmpp = 426.3 W, Dopt G = 0.71721435 | |||||
| IC | 648.689 | 0.7103 | 0.9641 | 426.130 | 99.96 |
| P&O | 628.276 | 0.7108 | 0.8943 | 426.124 | 99.96 |
| WSO | 352.368 | 0.7101 | 0.9919 | 426.106 | 99.95 |
| WSO-IC | 398.437 | 0.7116 | 0.7828 | 426.148 | 99.96 |
| Scenario 2: Ir1 = 1000 W/m2, Ir2 = 400 W/m2, T1 = T2 = 25 C, Pmpp G = 207.4 W, Dopt G = 0.80383836 | |||||
| IC | 768.902 | 0.5305 | 34.0041 | 189.453 | 91.35 |
| P&O | 517.483 | 0.5308 | 33.9668 | 189.450 | 91.35 |
| WSO | 254.545 | 0.7925 | 1.4105 | 204.705 | 98.70 |
| WSO-IC | 271.329 | 0.7938 | 1.2488 | 207.356 | 99.98 |
| Scenario 3: Ir1 = 800 W/m2, Ir2 = 400 W/m2, T1 = T2 = 25 C, Pmpp G = 187.6 W, Dopt G = 0.55062217 | |||||
| IC | 567.832 | 0.7704 | 39.9145 | 167.000 | 89.02 |
| P&O | 405.594 | 0.7699 | 39.8236 | 167.200 | 89.13 |
| WSO | 271.329 | 0.7714 | 40.0961 | 167.200 | 89.13 |
| WSO-IC | 442.281 | 0.5313 | 3.5092 | 187.600 | 100.00 |
| Scenario 4: Ir1 = 600 W/m2, Ir2 = 400 W/m2, T1 = T2 = 25 C, Pmpp G = 184.6 W, Dopt G = 0.55110705 | |||||
| IC | 623.776 | 0.7401 | 34.2933 | 125.800 | 68.15 |
| P&O | 433.566 | 0.7400 | 34.2752 | 125.900 | 68.20 |
| WSO | 338.462 | 0.7391 | 34.1119 | 125.700 | 68.09 |
| WSO-IC | 492.350 | 0.5378 | 2.4146 | 184.500 | 99.95 |
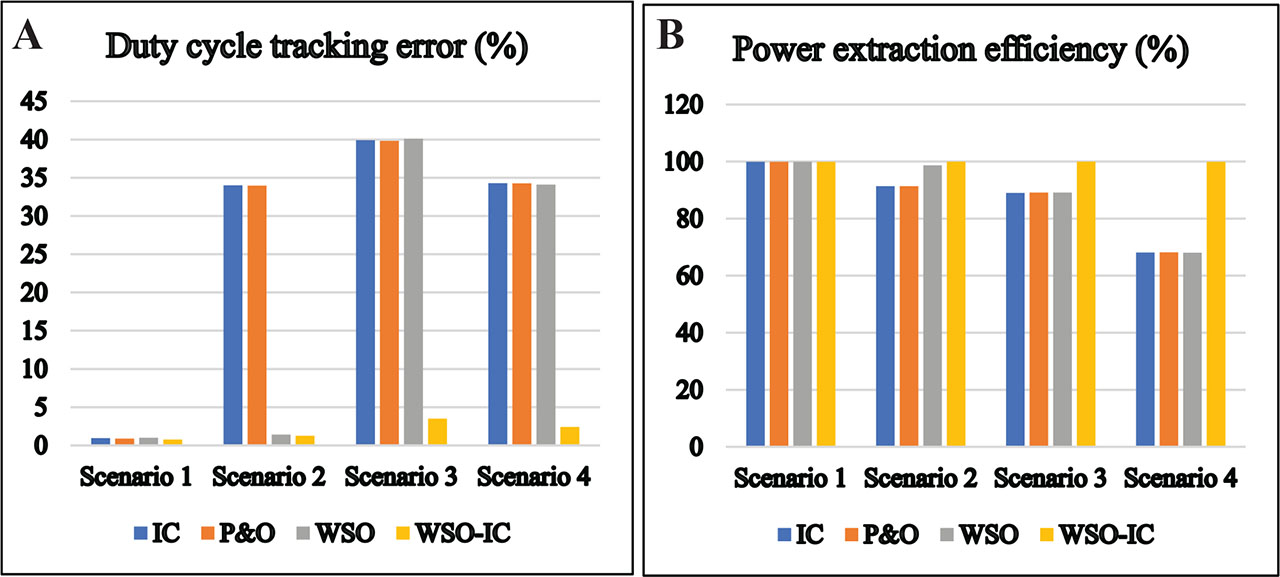
Figure 11.
Quantitative comparison between the performances of IC, P&O, WSO, and WSO-IC methods for different shading patterns. (A) Duty cycle tracking error and (B) power extraction efficiency. IC, incremental conductance; P&O, perturb and observe; WSO, war strategy optimization; WSO-IC, war strategy optimization-incremental conductance.
Table 5.
Performance comparison of the proposed WSO-IC with different MPPT algorithms
| MPPT algorithm | Efficiency (%) | Tracking time (s) |
|---|---|---|
| P&O (Khatib and Muhsen, 2020) | 96.08 | 0.321 |
| FL (Khatib and Muhsen, 2020) | 96.94 | 0.35 |
| PSO (Khatib and Muhsen, 2020) | 99.62 | 0.50 |
| GWO (Berttahar et al., 2024) | 97.08 | 0.78 |
| HOA (Berttahar et al., 2024) | 99.76 | 0.33 |
| WSO-IC | 99.96 | 0.398 |