
Fig. 1:
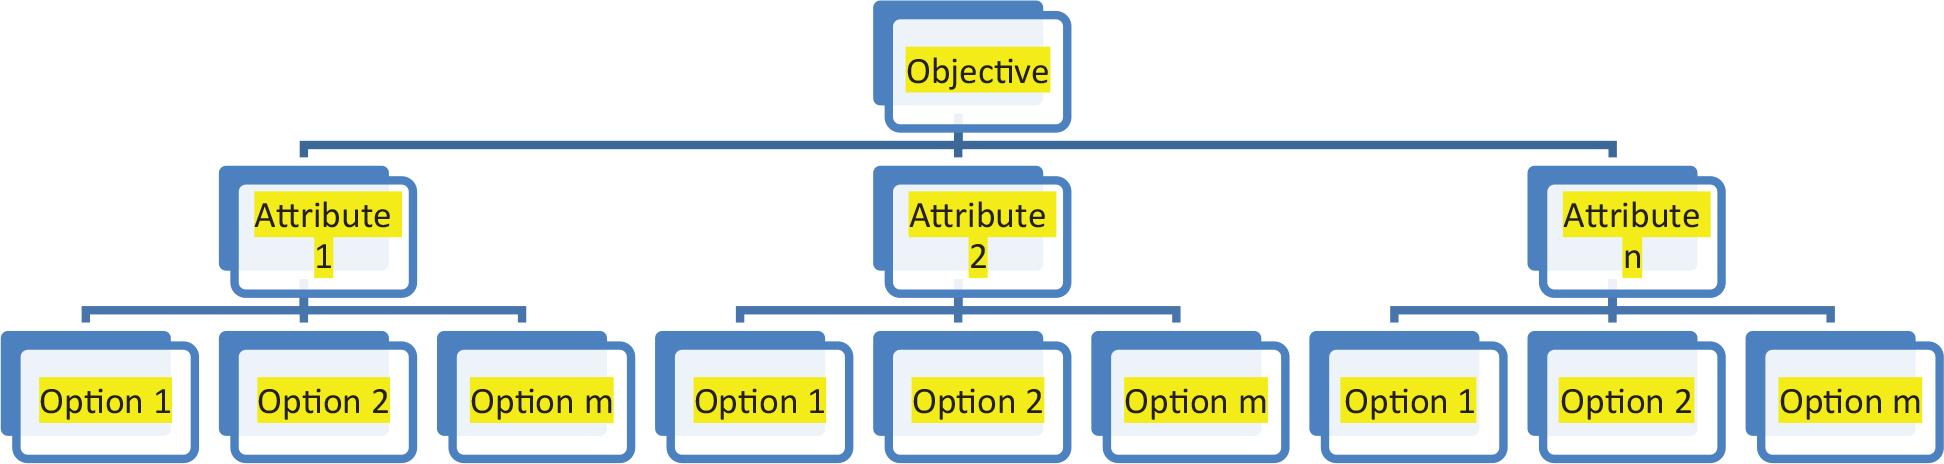
Fig. 2:

Fig. 3:

AHP attribute pairwise comparison normalised data with SPM setup_
| Attributes | A | B | C | D | E |
|---|---|---|---|---|---|
| A | 0.543 | 0.543 | 0.543 | 0.543 | 0.543 |
| B | 0.078 | 0.078 | 0.078 | 0.078 | 0.078 |
| C | 0.090 | 0.090 | 0.090 | 0.090 | 0.090 |
| D | 0.109 | 0.109 | 0.109 | 0.109 | 0.109 |
| E | 0.181 | 0.181 | 0.181 | 0.181 | 0.181 |
Contractors K and J payoff data_
| J | ||||
|---|---|---|---|---|
| K | Alpha values | Project 1 | Project 2 | Project 3 |
| Project 1 | 0.349/0.411 | 0.349/0.340 | 0.349/0.249 | |
| Project 2 | 0.440/0.411 | 0.440/0.340 | 0.440/0.249 | |
| Project 3 | 0.211/0.411 | 0.211/0.340 | 0.211/0.249 | |
Contractor B’s valuation of projects_
| Project J | Alpha |
|---|---|
| Project 1 | 0.37 |
| Project 2 | 0.52 |
| Project 3 | 0.11 |
j_otmcj-2025-0006_tab_016
| wA | = 0.543 |
| wB | = 0.078 |
| wC | = 0.090 |
| wD | = 0.109 |
| wE | = 0.181 |
AHP attribute pairwise comparison table also presented as a matrix M for calculations_
| Attributes | A | B | C | D | E |
|---|---|---|---|---|---|
| A | 1.00 | 7.00 | 6.00 | 5.00 | 3.00 |
| B | 3.00 | 1.00 | 5.00 | 7.00 | 4.00 |
| C | 2.00 | 0.20 | 1.00 | 3.00 | 1.00 |
| D | 0.20 | 1.00 | 0.30 | 1.00 | 0.30 |
| E | 0.20 | 0.20 | 1.00 | 4.00 | 1.00 |
AHP attribute pairwise comparison with SPM setup_
| Attributes | A | B | C | D | E |
|---|---|---|---|---|---|
| A | 1.00 | 7.00 | 6.00 | 5.00 | 3.00 |
| B | 0.10 | 1.00 | 0.90 | 0.70 | 0.40 |
| C | 0.20 | 1.20 | 1.00 | 0.80 | 0.50 |
| D | 0.20 | 1.40 | 1.20 | 1.00 | 0.60 |
| E | 0.30 | 2.30 | 2.00 | 1.70 | 1.00 |
Pairwise project-to-project comparison per attribute A_
| Projects | 1 | 2 | 3 |
|---|---|---|---|
| 1 | 1.00 | 0.33 | 1.00 |
| 2 | 0.10 | 1.00 | 2.00 |
| 3 | 1.00 | 0.50 | 1.00 |
Contractor C’s valuation of projects_
| Project J | Alpha |
|---|---|
| Project 1 | 0.18 |
| Project 2 | 0.41 |
| Project 3 | 0.41 |
Contractors A, B, and C (third number under each project) payoff data per project_
| B | |||
|---|---|---|---|
| A | Alpha values | Project 1 | Project 2 |
| Project 1 | 0.45/0.37/0.18 | 0.45/0.52/0.41 | |
| Project 2 | 0.27/0.37/0.18 | 0.27/0.52/0.41 | |
Final output from SPM_
| Weights i/project J | 0.543 | 0.078 | 0.090 | 0.109 | 0.181 | Alpha |
|---|---|---|---|---|---|---|
| Project 1 | 0.210 | 0.120 | 0.500 | 0.630 | 0.620 | 0.349 |
| Project 2 | 0.550 | 0.550 | 0.250 | 0.300 | 0.240 | 0.440 |
| Project 3 | 0.240 | 0.330 | 0.250 | 0.070 | 0.140 | 0.211 |
Contractor J’s valuation of projects_
| Project j | Alpha |
|---|---|
| Project 1 | 0.411 |
| Project 2 | 0.340 |
| Project 3 | 0.249 |
Contractors K and J reduced payoff data_
| J | |||
|---|---|---|---|
| K | Alpha values | Project 1 | Project 2 |
| Project 1 | 0.349/0.411 | 0.349/0.340 | |
| Project 2 | 0.440/0.411 | 0.440/0.340 | |
a, m, and b values to estimate comparison values for attribute A to B, C, and D_
| a | m | B | Attributes ratio | Pairwise comparison value |
|---|---|---|---|---|
| 5.00 | 7.00 | 9.00 | A/B | 7.00 |
| 5.00 | 6.00 | 7.00 | A/C | 6.00 |
| 4.00 | 5.00 | 6.00 | A/D | 5.00 |
| 1.00 | 3.00 | 5.00 | A/E | 3.00 |
Contractor A’s valuation of projects_
| Project J | Alpha |
|---|---|
| Project 1 | 0.45 |
| Project 2 | 0.27 |
| Project 3 | 0.28 |
Normalised pairwise project-to-project comparison per attribute A_
| Projects | 1 | 2 | 3 |
|---|---|---|---|
| 1 | 0.20 | 0.180 | 0.250 |
| 2 | 0.60 | 0.550 | 0.500 |
| 3 | 0.20 | 0.270 | 0.250 |