
Fig. 1:
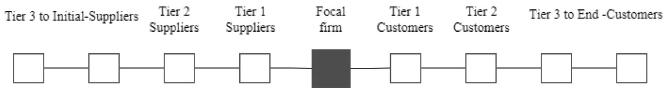
Fig. 2:
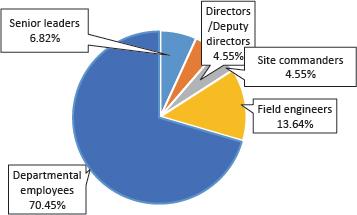
Fig. 3:
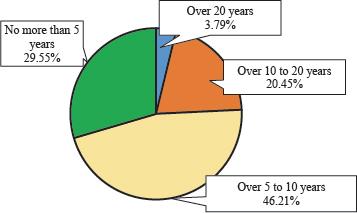
Fig. 4:
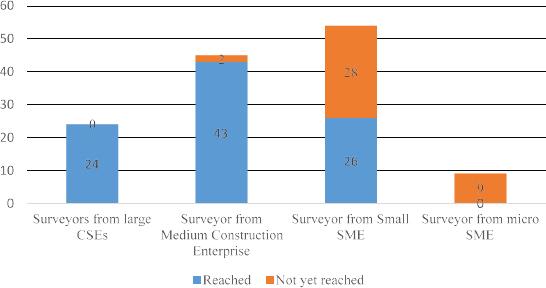
Fig. 5:
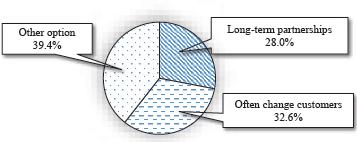
Fig. 6:
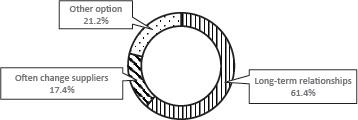
Fig. 7:
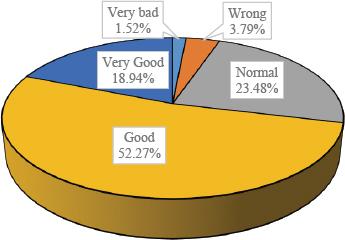
Fig. 8:
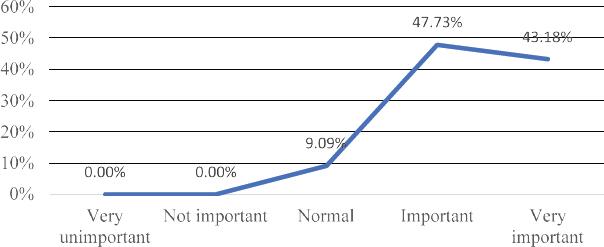
Fig. 9:
The surveyor evaluated the relationship of the construction enterprise with partners_
| Very bad | Wrong | Normal | Good | Very good | Sum | |
|---|---|---|---|---|---|---|
| Number of votes | 2 | 5 | 31 | 69 | 25 | 132 |
| Percentage (%) | 1.52 | 3.79 | 23.48 | 52.27 | 18.94 | 100 |
Summarisation of the number of satisfactory surveys_
| Method | Meet in person | Make a call | Via the form Google forms | Sum | |
|---|---|---|---|---|---|
| Ticket | Rate (%) | ||||
| Valid votes | 25 | 20 | 87 | 132 | 88 |
| Number of votes submitted | 25 | 20 | 105 | 150 | 100 |
Number of survey participants corresponding to enterprise size_
| Enterprise size | Number of employees | Number of respondents | Percentage (%) |
|---|---|---|---|
| Large | Over 200 employees | 24 | 18.18 |
| Medium | From 101 to 200 workers | 45 | 34.09 |
| Small | From 11 to 100 employees | 54 | 40.91 |
| Micro | No more than 10 employees | 9 | 6.82 |
| Sum | 132 | 100 |
Survey results of construction enterprises having approached supply chain management_
| Surveyors from large construction enterprises | Surveyor from medium construction enterprise | Surveyor from small construction enterprise | Surveyor from micro construction enterprise | Sum | ||
|---|---|---|---|---|---|---|
| Person | % | |||||
| Reached | 24 | 43 | 26 | 0 | 93 | 70.45 |
| Not yet reached | 0 | 2 | 28 | 9 | 39 | 29.55 |
| Sum | 24 | 45 | 54 | 9 | 132 | 100 |
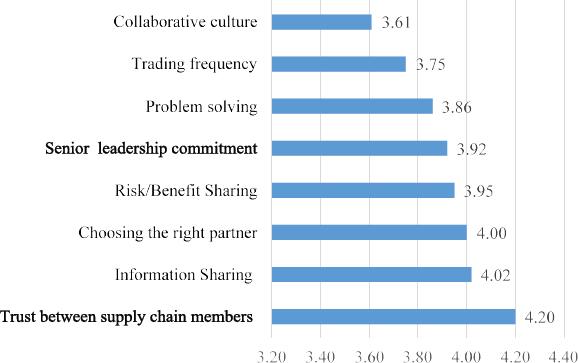
Assessment of the impact of factors on the overall relationship of supply chain members_
| No. | Element group | 1 | 2 | 3 | 4 | 5 | RII |
|---|---|---|---|---|---|---|---|
| Number of votes (%) | Number of votes (%) | Number of votes (%) | Number of votes (%) | Number of votes (%) | |||
| 1 | Trust between supply chain members | 0 0.00% | 0 0.00% | 27 20.45% | 52 39.39% | 53 40.15% | 4.20 |
| 2 | Information sharing | 3 2.27% | 3 2.27% | 18 13.64% | 72 54.55% | 36 27.27% | 4.02 |
| 3 | Choosing the right partner | 3 2.27% | 3 2.27% | 27 20.45% | 57 43.18% | 42 31.82% | 4.00 |
| 4 | Risk/benefit sharing | 0 0.00% | 0 0.00% | 36 27.27% | 66 50.00% | 30 22.73% | 3.95 |
| 5 | Senior leadership commitment | 5 3.79% | 3 2.27% | 24 18.18% | 66 50.00% | 34 25.76% | 3.92 |
| 6 | Problem solving | 0 0.00% | 3 2.27% | 30 22.73% | 81 61.36% | 18 13.64% | 3.86 |
| 7 | Trading frequency | 0 0.00% | 6 4.55% | 42 31.82% | 63 47.73% | 21 15.91% | 3.75 |
| 8 | Collaborative culture | 9 6.82% | 9 6.82% | 30 22.73% | 60 45.45% | 24 18.18% | 3.61 |