
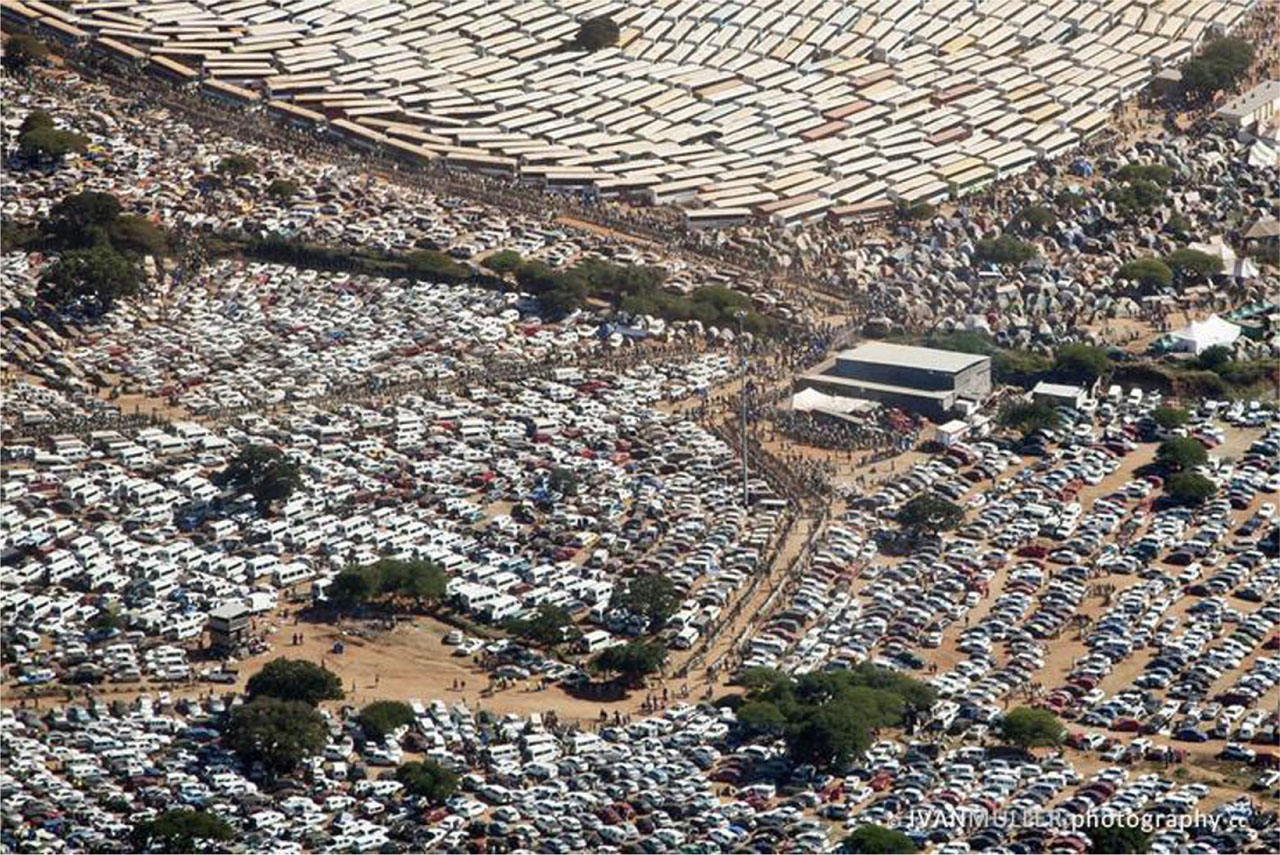
Fig. 1
Aerial photo of Moria (photo courtesy of Ivan Muller).
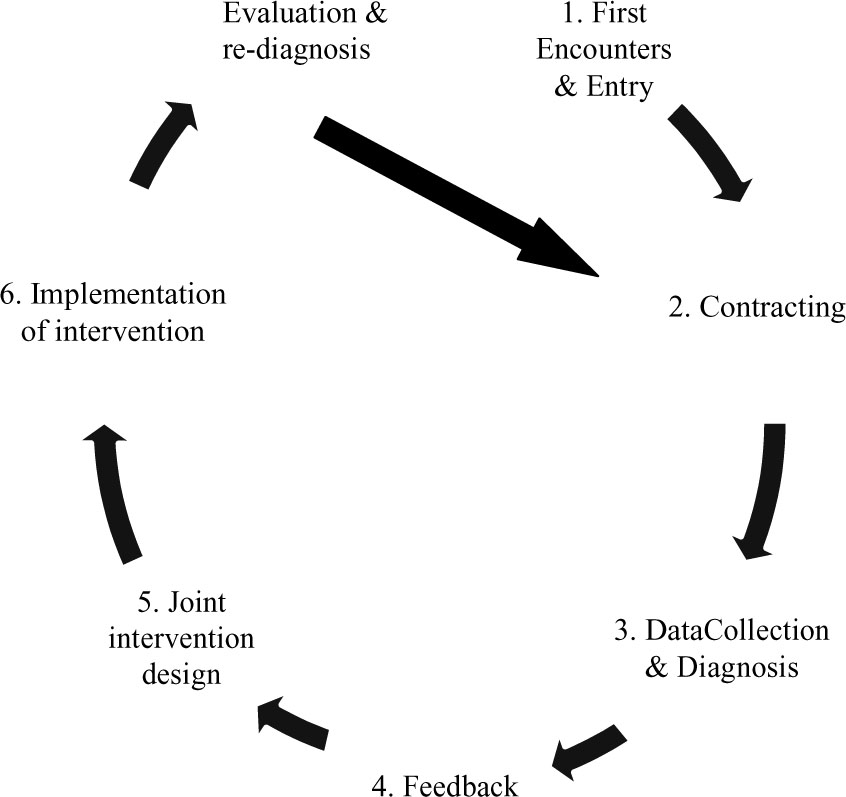
Fig. 2
The seven-step action research model (Van Tonder and Dietrichsen 2008).
Tab. 1
Demographic profile of respondents
| Gender of respondents | Frequency | Percentage |
| Male | 20 | 67.7 |
| Female | 10 | 33.3 |
| Total | 30 | 100.0 |
| Age of the respondents | Frequency | Percentage |
| 20–30 | 9 | 30.0 |
| 31–41 | 10 | 33.3 |
| 42–52 | 8 | 26.7 |
| 53–63 | 3 | 10.0 |
| Total | 30 | 100.0 |
| Educational level of respondents | Frequency | Percentage |
| Secondary school | 15 | 50.0 |
| First degree | 13 | 43.3 |
| Postgraduate degree | 2 | 6.7 |
| Total | 30 | 100.0 |
| Sector where respondents work | Frequency | Percentage |
| Traffic management | 8 | 26.7 |
| Transport planning | 6 | 20.0 |
| Environmental health | 4 | 13.3 |
| Disaster management | 6 | 20.0 |
| Public health | 4 | 13.3 |
| Health and safety | 2 | 6.7 |
| Total | 30 | 100.0 |
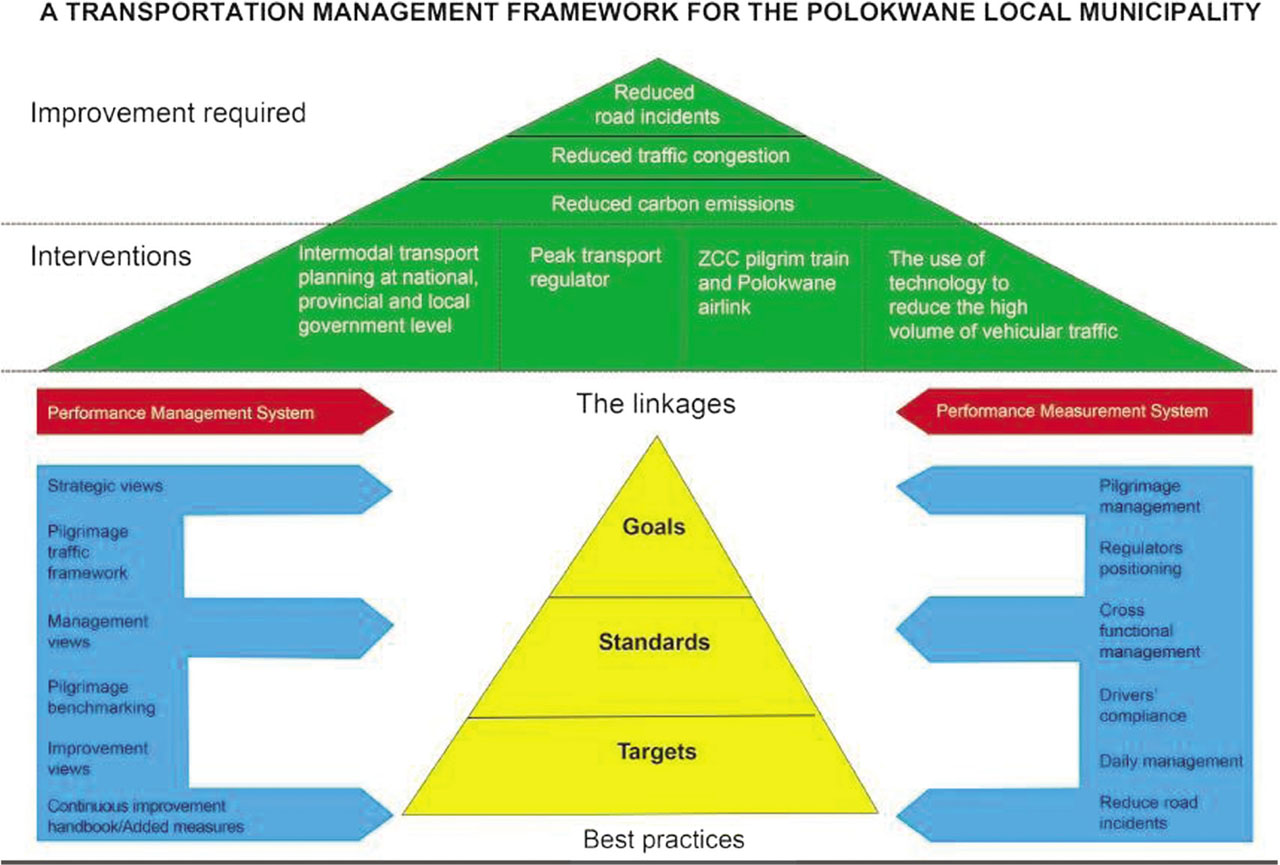
Fig. 3
A transportation management framework for the Polokwane Local Municipality.