
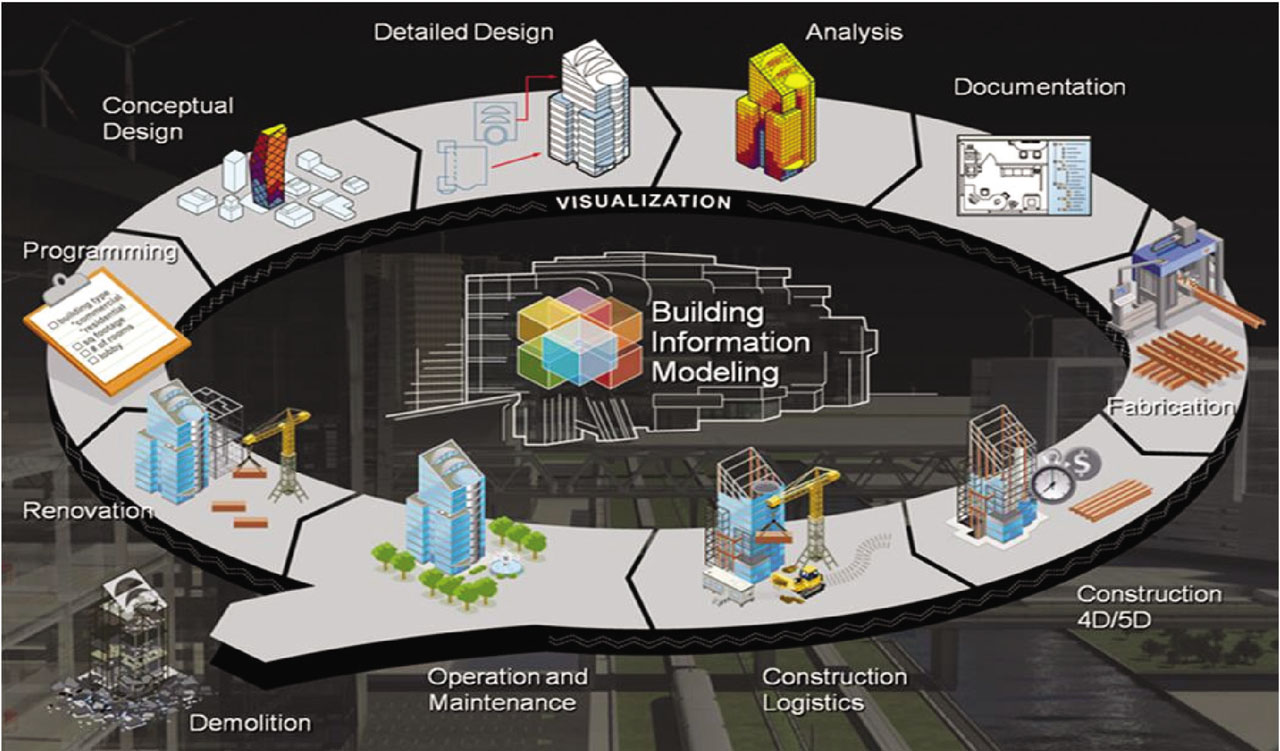
Fig. 1
Schematic representation of BIM interaction. Source: Hamma-Adama and Kouider (2018). BIM, building information modeling.
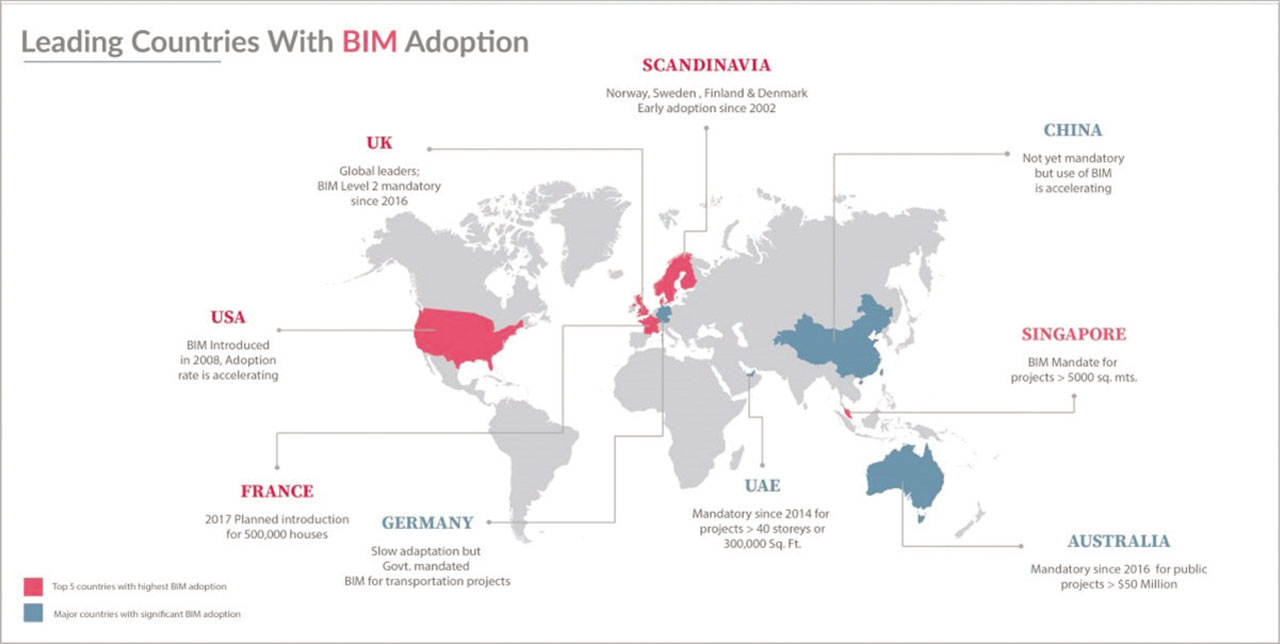
Fig. 2
Leading countries with BIM adoption. Source: United-BIM.com (2020). BIM, building information modeling.
Tab. 1
Capability improvement measures of the public sector.
[i] BIM, building information modeling; ICT, information and communication technology.
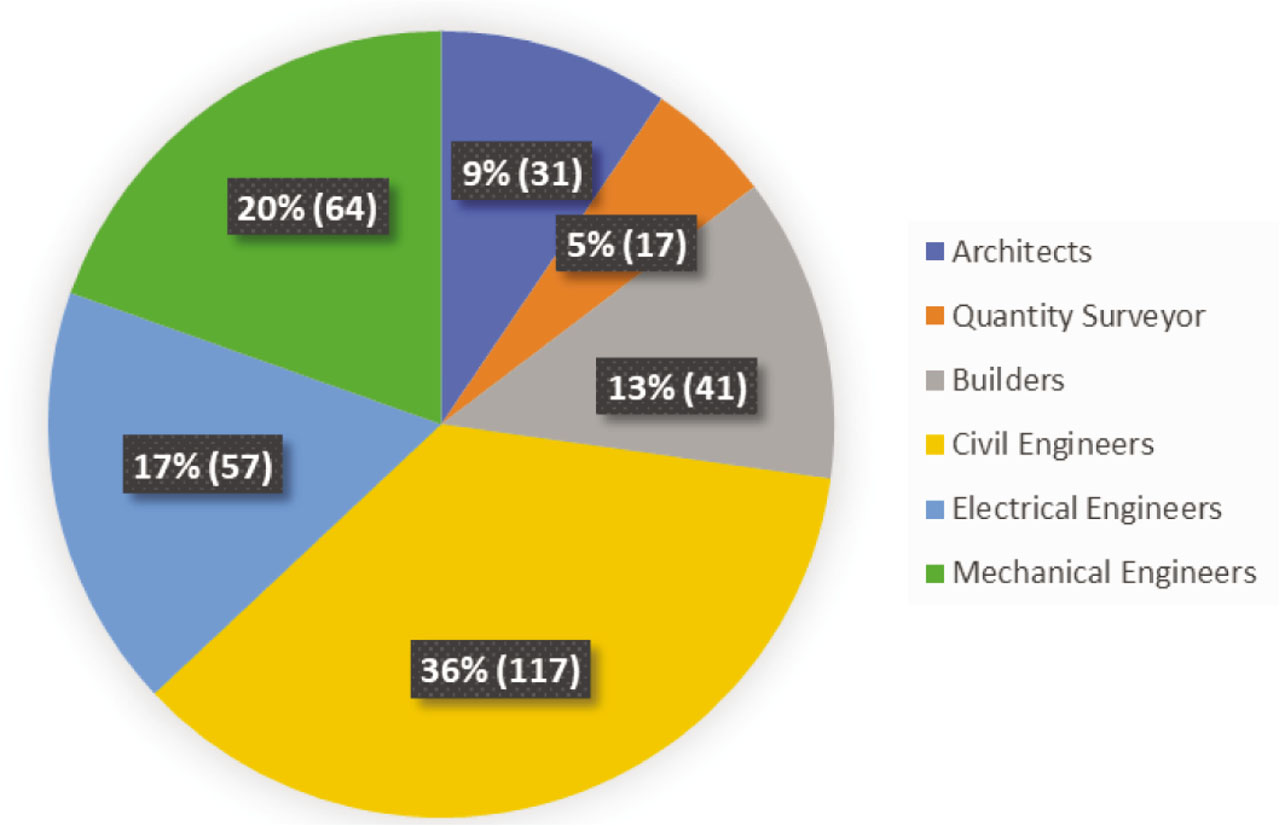
Fig. 3
Sample size for the study.
Tab. 2
Background information of the respondents.
| Profile of respondents | Frequency | (%) |
|---|---|---|
| Organization of respondents | ||
| Ministry of Education | 16 | 8.1 |
| Ministry of Housing | 45 | 22.7 |
| Ministry of Environmental and Physical Planning | 27 | 13.6 |
| Ministry of Transportation | 32 | 16.2 |
| Ministry of Waterfront Infrastructure | 25 | 12.6 |
| Ministry of Works and Infrastructure | 53 | 26.8 |
| Total | 198 | 100 |
| Profession of respondents | ||
| Quantity surveyor | 17 | 8.6 |
| Builder | 32 | 16.2 |
| Electrical engineer | 30 | 15.2 |
| Architect | 23 | 11.6 |
| Mechanical engineer | 19 | 9.6 |
| Civil engineer | 77 | 38.9 |
| Total | 198 | 100 |
| Respondent's highest academic qualification | ||
| HND | 50 | 25.3 |
| PGD | 19 | 9.6 |
| B.Sc./B.Tech. | 65 | 32.8 |
| M.Sc. | 64 | 32.3 |
| Total | 198 | 100 |
| Professional qualification of respondents | ||
| NIQS | 17 | 8.6 |
| NIOB | 32 | 16.2 |
| NIA | 24 | 12.1 |
| NSE | 123 | 62.1 |
| Others | 2 | 1 |
| Total | 198 | 100 |
| Years of experience of respondents | ||
| 1–5 | 18 | 9.1 |
| 6–10 | 53 | 26.8 |
| 11–15 | 57 | 28.8 |
| 16–20 | 42 | 21.2 |
| 21–25 | 17 | 8.6 |
| More than 25 | 11 | 5.6 |
| Total | 198 | 100% |
| Number of projects since employment wherein BIM was used | ||
| 0 | 176 | 88.9 |
| 1–5 | 14 | 7.1 |
| 5–10 | 4 | 2 |
| 11–15 | 1 | 0.5 |
| 16–20 | 3 | 1.5 |
| Total | 198 | 100 |
| Number of projects involved in generally since employment | ||
| 1–5 | 16 | 8.1 |
| 6–10 | 26 | 13.1 |
| 11–15 | 45 | 22.7 |
| 16–20 | 40 | 20.2 |
| More than 20 | 71 | 35.9 |
| Total | 198 | 100 |
[i] BIM, building information modeling; B.Sc./B.Tech., Bachelor of Science/Technology; HND, Higher National Diploma; NIA, Nigerian Institute of Architects; NIOB, Nigerian Institute of Builders; NSE, Nigerian Society of Engineers; NIQS, Nigerian Institute of Quantity Surveyors; PGD, postgraduate diploma.
Tab. 3
Frequency of usage of capability improvement measures of the public sector for BIM implementation in building projects
| Capability improvement measures | Overall | QS | BLDR | EEG | ARC | MEG | CEG | K–W Sig. | ||||||||
|---|---|---|---|---|---|---|---|---|---|---|---|---|---|---|---|---|
| MS | SD | R | MS | R | MS | R | MS | R | MS | R | MS | R | MS | R | ||
| Adequate number of staff | 3.66 | 0.958 | 1 | 3.65 | 6 | 4.00 | 1 | 3.67 | 12 | 3.52 | 10 | 3.84 | 4 | 3.51 | 8 | 0.247 |
| Team-based structure | 3.66 | 0.968 | 2 | 3.59 | 10 | 3.63 | 13 | 3.83 | 3 | 3.57 | 9 | 3.74 | 5 | 3.62 | 1 | 0.866 |
| Government support and involvement | 3.64 | 0.911 | 3 | 3.47 | 20 | 3.59 | 14 | 3.47 | 23 | 3.48 | 12 | 3.63 | 10 | 3.47 | 12 | 0.982 |
| Government policies | 3.60 | 1.012 | 4 | 3.53 | 15 | 3.69 | 8 | 3.73 | 6 | 3.65 | 4 | 3.63 | 10 | 3.49 | 10 | 0.927 |
| Adoption of process open to innovation | 3.60 | 1.089 | 5 | 3.35 | 25 | 3.59 | 14 | 3.70 | 7 | 3.74 | 1 | 4.05 | 2 | 3.47 | 12 | 0.295 |
| Investment in equipment and technology | 3.60 | 1.094 | 6 | 3.65 | 6 | 3.72 | 4 | 3.70 | 7 | 3.65 | 4 | 3.89 | 3 | 3.4 | 21 | 0.585 |
| ICT literacy of staff | 3.58 | 0.930 | 7 | 3.53 | 15 | 3.69 | 8 | 3.53 | 19 | 3.48 | 12 | 4.11 | 1 | 3.47 | 12 | 0.182 |
| Information sharing/management | 3.58 | 1.062 | 8 | 3.71 | 5 | 3.81 | 2 | 3.47 | 23 | 3.74 | 1 | 3.58 | 14 | 3.45 | 17 | 0.548 |
| Simplified organizational structure | 3.58 | 1.081 | 9 | 3.53 | 15 | 3.66 | 11 | 3.83 | 3 | 3.17 | 37 | 3.68 | 6 | 3.55 | 4 | 0.313 |
| Clear job description | 3.56 | 0.968 | 10 | 3.53 | 15 | 3.59 | 14 | 3.67 | 12 | 3.61 | 8 | 3.47 | 20 | 3.52 | 6 | 0.991 |
| Education and training of staff | 3.55 | 0.882 | 11 | 3.53 | 15 | 3.50 | 22 | 3.53 | 19 | 3.48 | 12 | 3.68 | 6 | 3.56 | 2 | 0.955 |
| Structured reporting system | 3.55 | 1.035 | 12 | 3.88 | 2 | 3.78 | 3 | 3.47 | 23 | 3.65 | 4 | 3.21 | 35 | 3.47 | 16 | 0.370 |
| Set standard for good performance | 3.54 | 0.975 | 13 | 3.65 | 6 | 3.50 | 22 | 3.60 | 15 | 3.52 | 10 | 3.53 | 16 | 3.51 | 8 | 0.994 |
| Presence of skilled and strong leaders | 3.53 | 1.069 | 14 | 3.59 | 10 | 3.72 | 4 | 3.47 | 23 | 3.48 | 12 | 3.37 | 24 | 3.52 | 6 | 0.769 |
| Performance-related pay | 3.53 | 1.111 | 15 | 3.47 | 20 | 3.56 | 17 | 3.87 | 1 | 3.39 | 20 | 3.63 | 10 | 3.42 | 20 | 0.599 |
| Recruitment of highly skilled workers | 3.52 | 0.853 | 16 | 3.47 | 20 | 3.72 | 4 | 3.53 | 19 | 3.65 | 4 | 3.32 | 28 | 3.45 | 17 | 0.664 |
| Commitment to BIM training | 3.51 | 1.084 | 17 | 3.59 | 10 | 3.69 | 8 | 3.87 | 1 | 3.26 | 32 | 3.47 | 20 | 3.35 | 29 | 0.325 |
| High degree of status for government employees | 3.49 | 1.031 | 18 | 3.82 | 3 | 3.56 | 17 | 3.53 | 19 | 3.43 | 16 | 2.95 | 40 | 3.53 | 5 | 0.233 |
| Provision of physical infrastructure | 3.47 | 1.006 | 19 | 3.59 | 10 | 3.53 | 19 | 3.63 | 14 | 3.35 | 24 | 3.58 | 14 | 3.38 | 23 | 0.785 |
| Reward system for performance | 3.47 | 1.016 | 20 | 3.35 | 25 | 3.50 | 22 | 3.57 | 16 | 3.39 | 20 | 3.42 | 23 | 3.49 | 10 | 0.956 |
| Skills-based and interpersonal networks | 3.45 | 1.064 | 21 | 3.65 | 6 | 3.50 | 22 | 3.70 | 7 | 3.35 | 24 | 3.53 | 16 | 3.31 | 32 | 0.761 |
| Research and development | 3.45 | 1.069 | 22 | 3.94 | 1 | 3.38 | 31 | 3.47 | 23 | 3.43 | 16 | 3.47 | 22 | 3.38 | 23 | 0.544 |
| Selective hiring | 3.42 | 1.048 | 23 | 3.41 | 24 | 3.53 | 19 | 3.40 | 29 | 3.35 | 24 | 3.53 | 16 | 3.38 | 23 | 0.987 |
| Attractive salaries/pay scale | 3.39 | 1.050 | 24 | 3.35 | 25 | 3.34 | 33 | 3.47 | 23 | 3.17 | 37 | 3.68 | 6 | 3.39 | 22 | 0.701 |
| Knowledge management practice | 3.36 | 0.901 | 25 | 3.35 | 25 | 3.41 | 29 | 3.57 | 16 | 3.22 | 36 | 3.32 | 28 | 3.32 | 31 | 0.660 |
| Management support for change | 3.32 | 0.996 | 26 | 3.59 | 10 | 3.50 | 22 | 3.13 | 39 | 3.26 | 32 | 3.37 | 24 | 3.27 | 35 | 0.684 |
| Provision of incentives | 3.30 | 1.051 | 27 | 3.76 | 4 | 3.31 | 34 | 3.27 | 34 | 3.26 | 32 | 3.32 | 28 | 3.21 | 38 | 0.607 |
| Commitment of staff to change | 3.30 | 1.056 | 28 | 3.47 | 20 | 3.16 | 40 | 3.30 | 32 | 3.35 | 24 | 3.32 | 28 | 3.31 | 32 | 0.884 |
| Implementation of educational actions | 3.29 | 0.943 | 29 | 3.31 | 34 | 3.70 | 7 | 3.35 | 24 | 3.26 | 32 | 3.36 | 27 | 3.39 | 28 | 0.370 |
| Acquisition of software | 3.24 | 0.972 | 30 | 3.47 | 27 | 3.57 | 16 | 3.39 | 20 | 3.63 | 10 | 3.34 | 30 | 3.42 | 26 | 0.721 |
| Acceleration of project implementation | 3.24 | 0.978 | 31 | 3.47 | 27 | 3.30 | 32 | 3.39 | 20 | 3.53 | 16 | 3.36 | 27 | 3.38 | 29 | 0.954 |
| Time and resources for learning | 3.24 | 0.991 | 32 | 3.41 | 29 | 3.37 | 30 | 3.43 | 16 | 2.89 | 41 | 3.45 | 17 | 3.36 | 32 | 0.232 |
| Commitment to learning | 3.24 | 0.994 | 33 | 3.53 | 19 | 3.20 | 37 | 3.30 | 31 | 3.26 | 32 | 3.47 | 12 | 3.38 | 39 | 0.581 |
| Elimination of internal conflicts | 3.18 | 0.926 | 34 | 3.28 | 39 | 3.17 | 38 | 3.26 | 32 | 3.26 | 32 | 3.18 | 39 | 3.21 | 39 | 0.989 |
| Performance evaluation | 3.18 | 1.046 | 35 | 3.72 | 4 | 3.70 | 7 | 3.70 | 3 | 3.37 | 24 | 3.38 | 23 | 3.50 | 19 | 0.232 |
| Opportunities for multiskilling | 3.12 | 0.944 | 36 | 3.31 | 34 | 3.03 | 40 | 3.43 | 16 | 3.16 | 37 | 3.22 | 36 | 3.22 | 38 | 0.606 |
| Effective strategic management practices | 3.12 | 1.006 | 37 | 3.31 | 34 | 3.27 | 34 | 3.17 | 37 | 3.16 | 38 | 3.30 | 34 | 3.25 | 36 | 0.929 |
| Improvement of financial results | 3.12 | 1.010 | 38 | 3.31 | 34 | 3.27 | 34 | 3.35 | 24 | 3.21 | 35 | 3.22 | 36 | 3.25 | 37 | 0.927 |
| Valuing employee/encouraging self-esteem | 3.00 | 1.012 | 39 | 3.38 | 31 | 3.37 | 30 | 3.35 | 24 | 3.00 | 39 | 3.12 | 40 | 3.20 | 40 | 0.476 |
| Retention of workers/personnel stability | 2.88 | 0.908 | 40 | 3.66 | 11 | 3.77 | 5 | 3.65 | 4 | 3.68 | 6 | 3.56 | 2 | 3.57 | 10 | 0.053 |
| Greater autonomy to hire and fire | 2.47 | 1.065 | 41 | 3.09 | 41 | 3.03 | 40 | 3.17 | 37 | 3.37 | 24 | 3.05 | 41 | 3.05 | 41 | 0.128 |
[i] ARC, architect; BIM, building information modeling; BLDR, builder; CEG, civil engineer; EEG, electrical engineer; ICT, information and communication technology; K–W, Kruskal–Wallis; MEG, mechanical engineer; MS, mean score; QS, quantity surveyor; R, rank; SD, standard deviation; Sig., significant factors with p-value ≤0.05.
Tab 4
Level of Impact of Capability Improvement Measures of the Public Sector for BIM Implementation in Building projects
| Capability improvement measures | OVERALL | QS | BLDR | EEG | ARC | MEG | CEG | K-W Sig. | ||||||||
|---|---|---|---|---|---|---|---|---|---|---|---|---|---|---|---|---|
| MS | SD | R | MS | R | MS | R | MS | R | MS | R | MS | R | MS | R | ||
| Reward system for performance | 3.81 | 0.951 | 1 | 3.71 | 3 | 3.75 | 12 | 3.87 | 11 | 3.70 | 2 | 4.26 | 1 | 3.77 | 1 | 0.351 |
| Government policies | 3.74 | 1.012 | 2 | 3.59 | 7 | 3.69 | 20 | 3.87 | 11 | 3.52 | 16 | 3.95 | 9 | 3.77 | 1 | 0.595 |
| Education and training of staff | 3.74 | 0.902 | 3 | 3.47 | 13 | 3.91 | 2 | 3.93 | 5 | 3.65 | 8 | 4.00 | 4 | 3.61 | 9 | 0.261 |
| Government support and involvement | 3.73 | 0.901 | 4 | 3.59 | 7 | 3.81 | 8 | 3.90 | 7 | 3.52 | 16 | 3.89 | 10 | 3.60 | 11 | 0.361 |
| Clear job description | 3.71 | 0.886 | 5 | 3.71 | 3 | 3.66 | 21 | 3.90 | 7 | 3.48 | 23 | 3.79 | 14 | 3.71 | 4 | 0.658 |
| Provision of physical infrastructure | 3.69 | 0.978 | 6 | 3.59 | 7 | 3.88 | 3 | 3.83 | 15 | 3.43 | 25 | 3.79 | 14 | 3.62 | 8 | 0.554 |
| Adoption of process open to innovation | 3.68 | 1.040 | 7 | 3.12 | 30 | 3.84 | 5 | 3.83 | 15 | 3.70 | 2 | 4.05 | 2 | 3.58 | 13 | 0.082 |
| Structured reporting system | 3.68 | 0.937 | 8 | 3.82 | 2 | 3.75 | 12 | 3.90 | 7 | 3.70 | 2 | 3.63 | 22 | 3.55 | 18 | 0.787 |
| Investment in equipment and technology | 3.68 | 1.041 | 9 | 3.18 | 27 | 3.84 | 5 | 3.80 | 20 | 3.65 | 8 | 4.00 | 4 | 3.60 | 11 | 0.253 |
| Set standard for good performance | 3.66 | 0.909 | 10 | 3.59 | 7 | 3.56 | 27 | 3.73 | 24 | 3.57 | 13 | 3.53 | 29 | 3.74 | 3 | 0.541 |
| Presence of skilled and strong leaders | 3.66 | 0.968 | 11 | 3.35 | 18 | 3.84 | 5 | 3.97 | 3 | 3.70 | 2 | 3.68 | 19 | 3.51 | 21 | 0.193 |
| Commitment to BIM training | 3.66 | 1.024 | 12 | 3.65 | 5 | 3.72 | 16 | 3.97 | 3 | 3.74 | 1 | 3.74 | 16 | 3.47 | 25 | 0.547 |
| Team-based structure | 3.65 | 1.000 | 13 | 3.47 | 13 | 3.59 | 24 | 3.93 | 5 | 3.48 | 23 | 4.00 | 4 | 3.57 | 15 | 0.234 |
| ICT literacy of staff | 3.65 | 1.036 | 14 | 3.41 | 15 | 3.81 | 8 | 3.70 | 27 | 3.30 | 36 | 3.89 | 10 | 3.65 | 6 | 0.225 |
| Recruitment of highly skilled workers | 3.64 | 0.900 | 15 | 3.41 | 15 | 3.44 | 37 | 3.83 | 15 | 3.61 | 11 | 3.63 | 22 | 3.71 | 4 | 0.291 |
| High degree of status for government employees | 3.63 | 0.973 | 16 | 3.59 | 7 | 3.75 | 12 | 4.00 | 1 | 3.43 | 25 | 3.37 | 32 | 3.56 | 17 | 0.201 |
| Information sharing/management | 3.63 | 1.053 | 17 | 3.06 | 34 | 3.66 | 21 | 3.83 | 15 | 3.43 | 25 | 3.89 | 10 | 3.65 | 6 | 0.117 |
| Attractive salaries/pay scale | 3.62 | 1.029 | 18 | 3.12 | 30 | 3.88 | 3 | 3.73 | 24 | 3.65 | 8 | 3.63 | 22 | 3.57 | 15 | 0.232 |
| Adequate number of staff | 3.60 | 0.996 | 19 | 2.82 | 39 | 3.81 | 8 | 4.00 | 1 | 3.35 | 32 | 4.00 | 4 | 3.51 | 21 | 0.000* |
| Performance evaluation | 3.60 | 1.075 | 20 | 3.12 | 30 | 3.53 | 29 | 3.80 | 20 | 3.52 | 16 | 3.84 | 13 | 3.61 | 9 | 0.298 |
| Performance-related pay | 3.60 | 1.116 | 21 | 3.24 | 23 | 3.53 | 29 | 3.87 | 11 | 3.70 | 2 | 4.00 | 4 | 3.48 | 23 | 0.271 |
| Simplified organizational structure | 3.59 | 1.037 | 22 | 3.53 | 12 | 3.78 | 11 | 3.90 | 7 | 3.57 | 13 | 3.68 | 19 | 3.39 | 33 | 0.429 |
| Research and development | 3.57 | 1.043 | 23 | 3.88 | 1 | 3.75 | 12 | 3.80 | 20 | 3.43 | 25 | 3.74 | 16 | 3.34 | 39 | 0.252 |
| Implementation of educational actions | 3.55 | 1.030 | 24 | 3.18 | 27 | 3.53 | 29 | 3.83 | 15 | 3.52 | 16 | 3.32 | 33 | 3.58 | 13 | 0.262 |
| Acquisition of software | 3.53 | 1.041 | 25 | 3.24 | 23 | 4.06 | 1 | 3.67 | 28 | 3.52 | 16 | 3.63 | 22 | 3.29 | 40 | 0.017* |
| Management support for change | 3.51 | 0.928 | 26 | 3.65 | 5 | 3.59 | 24 | 3.57 | 30 | 3.26 | 37 | 3.63 | 22 | 3.45 | 26 | 0.747 |
| Selective hiring | 3.51 | 1.152 | 27 | 2.88 | 36 | 3.56 | 27 | 3.87 | 11 | 3.35 | 32 | 4.05 | 2 | 3.40 | 31 | 0.034* |
| Commitment of staff to change | 3.49 | 0.986 | 28 | 3.06 | 34 | 3.53 | 29 | 3.57 | 30 | 3.61 | 11 | 3.58 | 28 | 3.48 | 23 | 0.471 |
| Provision of incentives | 3.49 | 1.079 | 29 | 3.41 | 15 | 3.66 | 21 | 3.67 | 28 | 3.35 | 32 | 3.63 | 22 | 3.39 | 33 | 0.822 |
| Acceleration of project implementation | 3.48 | 1.065 | 30 | 3.35 | 18 | 3.53 | 29 | 3.47 | 34 | 3.52 | 16 | 3.26 | 34 | 3.55 | 18 | 0.845 |
| Skills-based and interpersonal networks | 3.48 | 1.098 | 31 | 3.35 | 18 | 3.59 | 24 | 3.77 | 23 | 3.26 | 37 | 3.68 | 19 | 3.38 | 35 | 0.527 |
| Retention of workers/personnel stability | 3.48 | 0.954 | 32 | 2.71 | 41 | 3.72 | 16 | 3.73 | 24 | 3.26 | 37 | 3.42 | 30 | 3.55 | 18 | 0.016* |
| Effective strategic management practices | 3.44 | 1.010 | 33 | 3.29 | 22 | 3.53 | 29 | 3.50 | 32 | 3.52 | 16 | 3.21 | 37 | 3.45 | 26 | 0.712 |
| Commitment to learning | 3.42 | 0.967 | 34 | 3.35 | 18 | 3.50 | 35 | 3.43 | 35 | 3.39 | 30 | 3.42 | 30 | 3.42 | 30 | 0.988 |
| Valuing employee/encouraging self-esteem | 3.41 | 0.998 | 35 | 2.88 | 36 | 3.72 | 16 | 3.50 | 32 | 3.70 | 2 | 3.11 | 41 | 3.36 | 36 | 0.032* |
| Knowledge management practice | 3.36 | 0.939 | 36 | 3.12 | 30 | 3.38 | 40 | 3.33 | 36 | 3.43 | 25 | 3.21 | 37 | 3.44 | 28 | 0.613 |
| Improvement of inancial results | 3.36 | 1.022 | 37 | 3.24 | 23 | 3.44 | 37 | 3.33 | 36 | 3.57 | 13 | 3.21 | 37 | 3.35 | 37 | 0.882 |
| Time and resources for learning | 3.34 | 1.018 | 38 | 3.18 | 27 | 3.31 | 41 | 3.27 | 40 | 3.39 | 30 | 3.21 | 37 | 3.43 | 29 | 0.767 |
| Greater autonomy to hire and fire | 3.31 | 1.122 | 39 | 2.82 | 39 | 3.41 | 39 | 3.23 | 41 | 2.96 | 41 | 3.74 | 16 | 3.40 | 31 | 0.042* |
| Opportunities for multiskilling | 3.30 | 0.960 | 40 | 3.24 | 23 | 3.31 | 41 | 3.30 | 39 | 3.22 | 40 | 3.26 | 34 | 3.34 | 38 | 0.969 |
| Elimination of internal conflicts | 3.24 | 0.929 | 41 | 2.88 | 36 | 3.50 | 35 | 3.33 | 36 | 3.35 | 32 | 3.26 | 34 | 3.13 | 41 | 0.227 |
[i] ARC, architect; BIM, building information modeling; BLDR, builder; CEG, civil engineer; EEG, electrical engineer; ICT, information and communication technology; K–W, Kruskal–Wallis; MEG, mechanical engineer; MS, mean score; QS, quantity surveyor; R, rank; SD, standard deviation; Sig., significant factors with p-value ≤0.05.