
Fig. 1
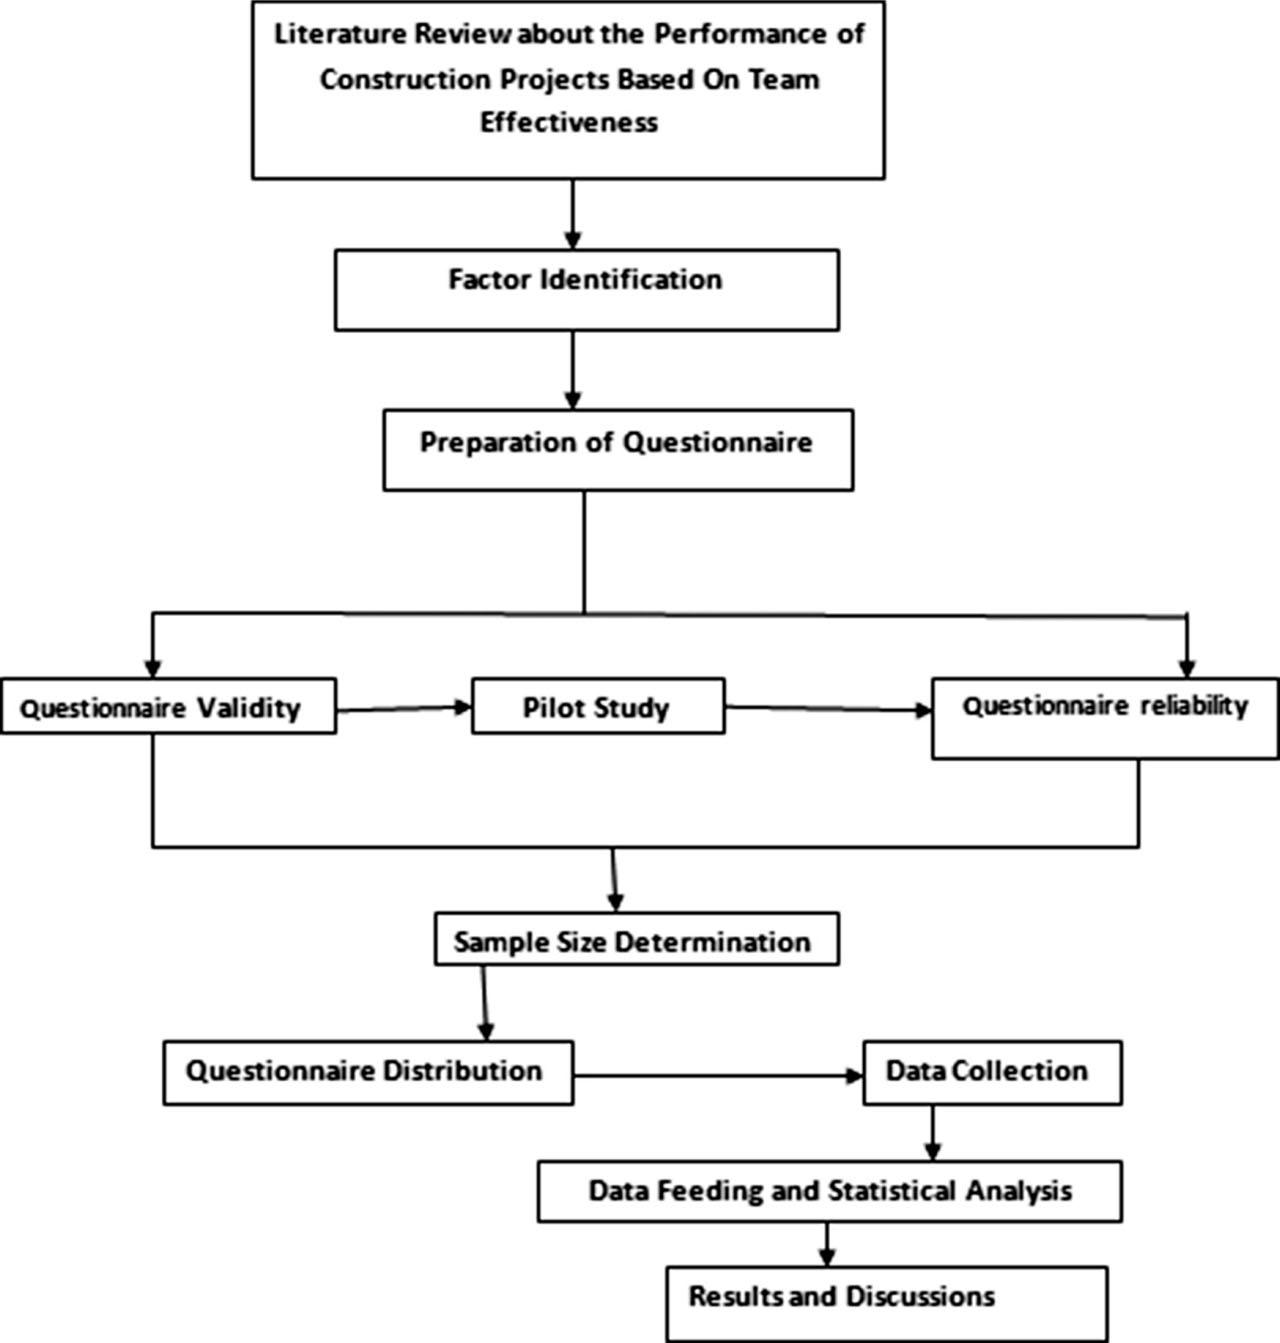
Fig. 2
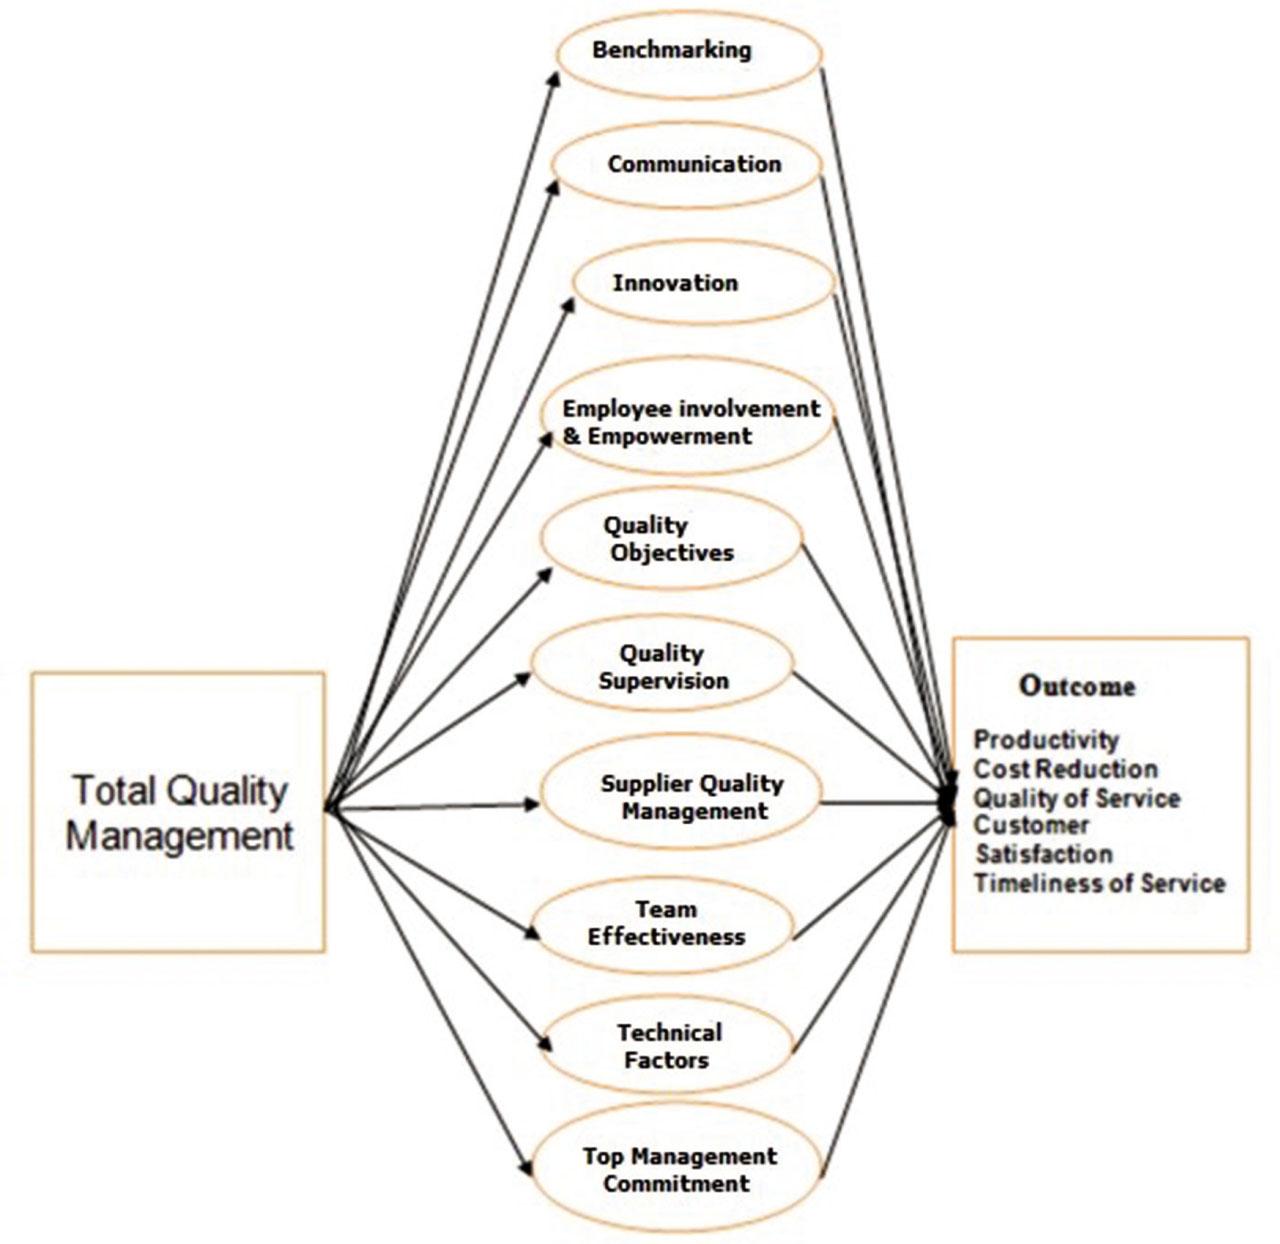
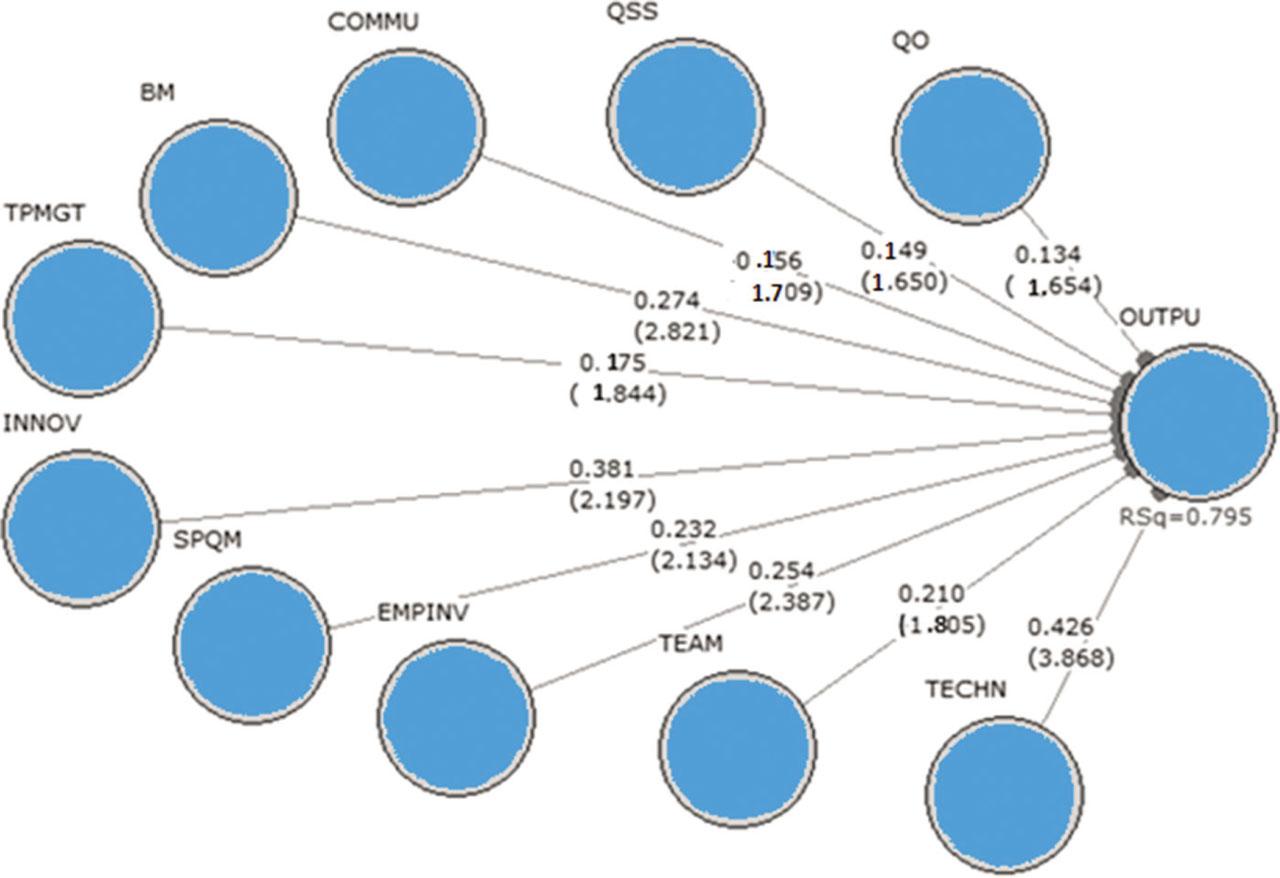
Fig. 3
Accuracy analysis statistics for factors determining the total quality of construction projects_
| Factors | Items | Factor loadings | CR | AVE | Cronbach's α |
|---|---|---|---|---|---|
| QSS | The supervisor gives credit to people when they do a good job. | 0.78 | 0.79 | 0.51 | 0.68 |
| The supervisor gives feedback on the work I have done. | 0.50 | ||||
| Quality improvement is their responsibility. | 0.73 | ||||
| My supervisor rewards being cooperative and a good team player. | 0.85 | ||||
| COMMU | Top Management information and interaction | 0.85 | 0.86 | 0.67 | 0.74 |
| Middle management support | 0.90 | ||||
| Periodic Feedback | 0.69 | ||||
| BM | Best practices | 0.81 | 0.86 | 0.60 | 0.78 |
| Material comparison | 0.79 | ||||
| Cost Comparison | 0.69 | ||||
| Quality of the supplies | 0.80 | ||||
| QO | Statutory provisions | 0.53 | 0.77 | 0.47 | 0.64 |
| Proper prior testing with sample materials | 0.72 | ||||
| Workmanship quality | 0.87 | ||||
| Quality of the supplies | 0.57 | ||||
| TPMGT | Quality as primary objective | 0.90 | 0.94 | 0.74 | 0.93 |
| Quality as being more important than deadlines | 0.91 | ||||
| Frequent performance evaluation | 0.89 | ||||
| Timely allocation of resources | 0.84 | ||||
| Clear quality goals objectives | 0.85 | ||||
| Quality is the primary agenda in all the company meetings. | 0.76 | ||||
| INNOV | Creative and innovative suggestions for work improvements | 0.77 | 0.87 | 0.69 | 0.77 |
| Autonomy to use new methods | 0.90 | ||||
| Contemporary methods are encouraged | 0.81 | ||||
| SPQM | Quality is a more important criterion than the price in selecting suppliers | 0.76 | 0.87 | 0.57 | 0.80 |
| The supplier's delivery performance is considered before ordering | 0.86 | ||||
| The supplier's market stability is considered | 0.77 | ||||
| Maintenance of long-term supplier relationship management | 0.81 | ||||
| Supplier audit and evaluation | 0.54 | ||||
| EMPINV | Participative work culture | 0.85 | 0.86 | 0.56 | 0.79 |
| Employee suggestion schemes | 0.73 | ||||
| Employees are encouraged to give more suggestions. | 0.86 | ||||
| Awards (financially or otherwise) are provided to individuals for their excellent suggestions. | 0.79 | ||||
| Employee participation in quality audit | 0.50 | ||||
| TEAM | Team work | 0.73 | 0.91 | 0.68 | 0.87 |
| Team Problem solving | 0.85 | ||||
| Team skills and knowledge | 0.92 | ||||
| Synergy and team effectiveness | 0.85 | ||||
| Cohesive team | 0.76 | ||||
| TECHN | Initial cracks’ visibility | 0.51 | 0.77 | 0.47 | 0.67 |
| Plumb checking is always done before and after concreting | 0.85 | ||||
| Honeycomb structures’ visibility | 0.51 | ||||
| Platform vibrator is used during the compaction of roof slab | 0.64 | ||||
| Cutting of rebars is done using machinery | 0.68 | ||||
| OUTPU | Productivity | 0.81 | 0.82 | 0.50 | 0.73 |
| Cost Reduction | 0.51 | ||||
| Quality of Service | 0.73 | ||||
| Timeliness of Service | 0.61 | ||||
| Customer Satisfaction | 0.83 |
Results of SEM analysis using bootstrap_
| Entire sample estimate | T-Statistic | Result | |
|---|---|---|---|
| QO ⇒ OUTPU | 0.13 | 1.65 | Supported by 10% |
| TPMGT ⇒ OUTPU | 0.17 | 1.84 | Supported by 10% |
| INNOV ⇒ OUTPU | 0.38 | 2.20 | Supported by 5% |
| QSS ⇒ OUTPU | 0.15 | 1.65 | Supported by 10% |
| COMMU ⇒ OUTPU | 0.16 | 1.71 | Supported by 10% |
| BM ⇒ OUTPU | 0.27 | 2.82 | Supported by 1% |
| TECHN ⇒ OUTPU | 0.43 | 3.87 | Supported by 1% |
| TEAM ⇒ OUTPU | 0.21 | 1.8 | Supported by 10% |
| SPQM ⇒ OUTPU | 0.23 | 2.13 | Supported by 5% |
| EMPINV ⇒ OUTPU | 0.25 | 2.39 | Supported by 5% |
Apparent elements included in the study and its reliability statistics_
| S No. | Factors | Author | Cronbach's α |
|---|---|---|---|
| 1 | BM | Saraph et al. (1989) and Nwabueze (2001) | 0.939 |
| 2 | COMMU | Delgado et al. (2005) | 0.939 |
| 3 | INNOV | Juran (1974) and Nwabueze (2001) | 0.938 |
| 4 | EMPINV | Oakland (1993) and Zhang (2000) | 0.940 |
| 5 | QO | Saraph et al. (1989) | 0.940 |
| 6 | QSS | Saraph et al. (1989) | 0.940 |
| 7 | SPQM | Delgado et al. (2005) | 0.938 |
| 8 | TEAM | Delgado et al. (2005) | 0.939 |
| 9 | TECHN factors | Delgado et al. (2005) | 0.937 |
| 10 | TPMGT | Juran (1974) and Motwani (2001) | 0.939 |
| 11 | Project Outcome (Productivity, Cost Reduction, Quality of Service, Customer Satisfaction, Timeliness) | Delgado et al. (2005) | 0.940 |
Latent variable correlations for factors determining the total quality of construction projects_
| Factors | QSS | COMMU | BM | QO | TPMGT | INNOV | SPQM | EMPINV | TEAM | TECHN |
|---|---|---|---|---|---|---|---|---|---|---|
| QSS | 0.75* | |||||||||
| COMMU | 0.7 | 0.82* | ||||||||
| BM | 0.2 | 0.3 | 0.77* | |||||||
| QO | 0.4 | 0.2 | 0.4 | 0.69* | ||||||
| TPMGT | 0.6 | 0.8 | 0.3 | 0.1 | 0.86* | |||||
| INNOV | 0.3 | 0.5 | 0.6 | 0.3 | 0.3 | 0.83* | ||||
| SPQM | 0.4 | 0.6 | 0.6 | 0.2 | 0.6 | 0.4 | 0.76* | |||
| EMPINV | 0.2 | 0.3 | 0.6 | 0.4 | 0.4 | 0.6 | 0.5 | 0.75* | ||
| TEAM | 0.2 | 0.3 | 0.7 | 0.3 | 0.3 | 0.8 | 0.6 | 0.6 | 0.82* | |
| TECHN | 0.7 | 0.6 | 0.3 | 0.3 | 0.4 | 0.2 | 0.5 | 0.2 | 0.3 | 0.68* |
| OUTPU | 0.5 | 0.6 | 0.7 | 0.3 | 0.5 | 0.6 | 0.7 | 0.6 | 0.6 | 0.6 |