
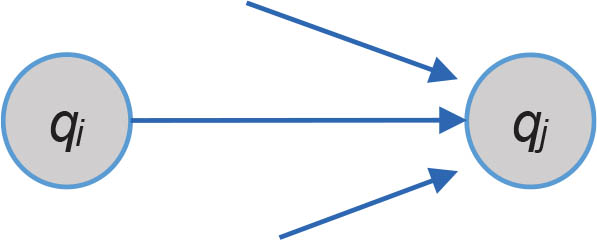
Fig. 1
Modelling the effect of nodes I on a node j.
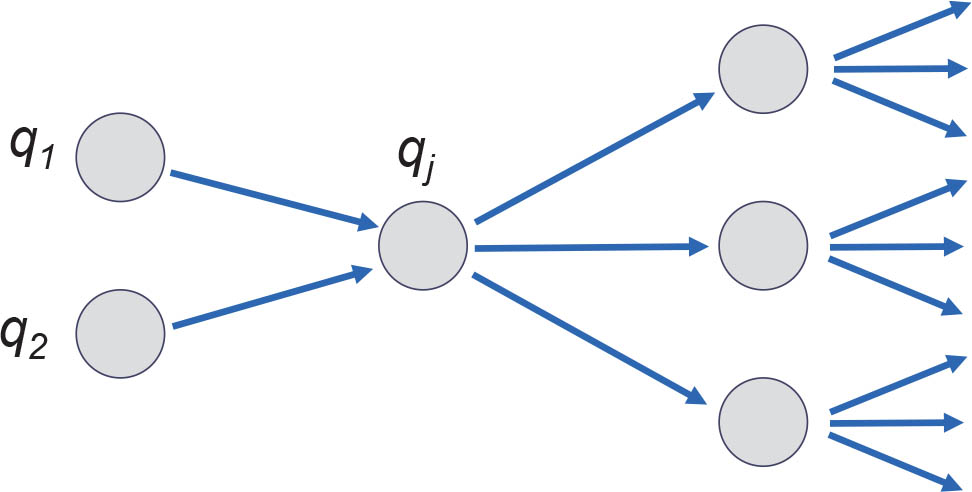
Fig. 2
Multiple nodes driving qj towards inconsistent values.
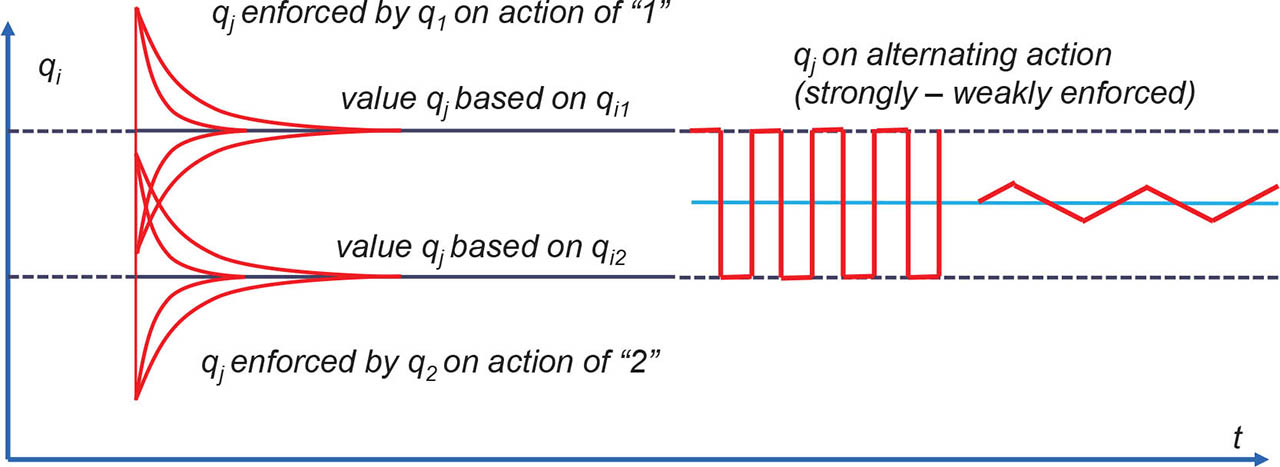
Fig. 3
Inconsistent state of equilibrium depending on the point of time when the one or other impacting node takes priority.
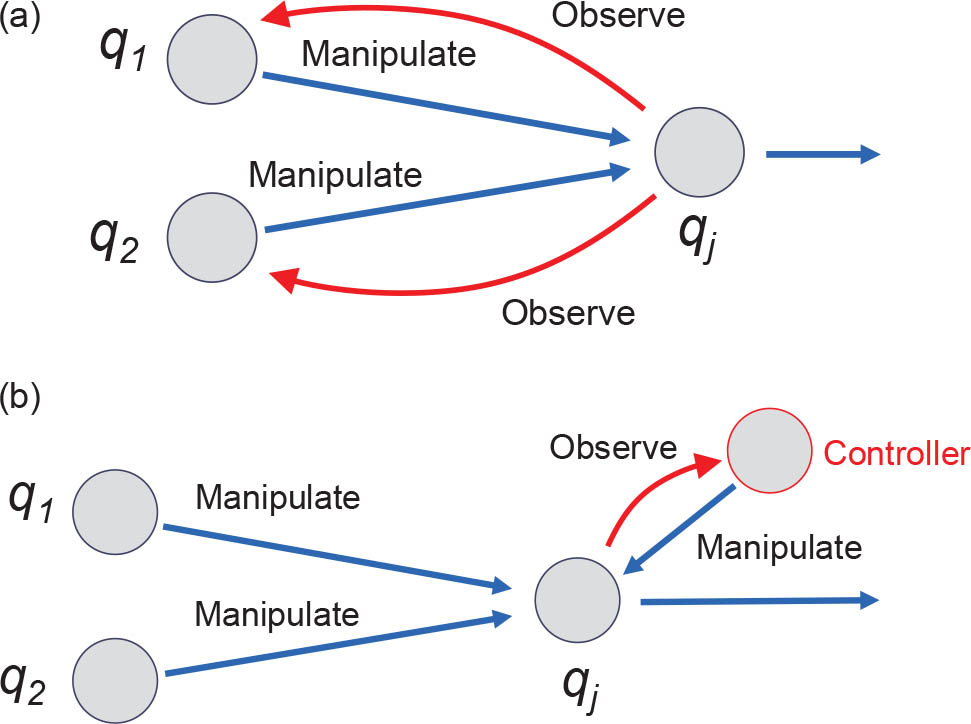
Fig. 4
(a) Observing loop at both impactors. (b) Attached controlling element.
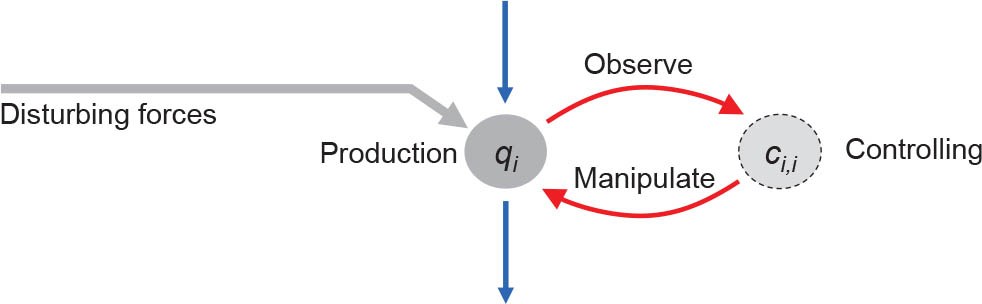
Fig. 5
Basic system of the theoretical controlling structure.
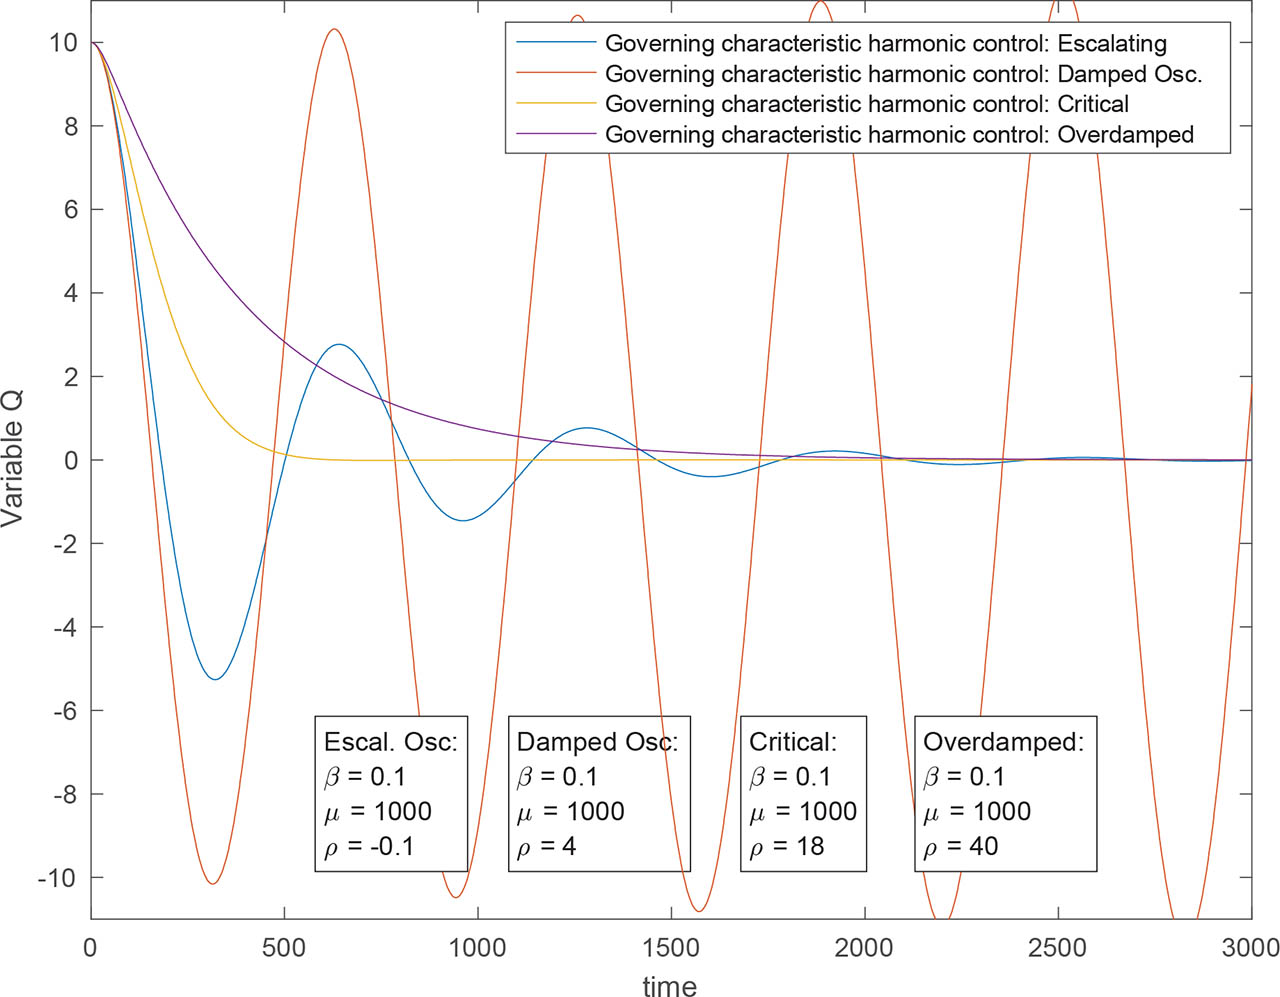
Fig. 6
Solutions of harmonic differential equation.
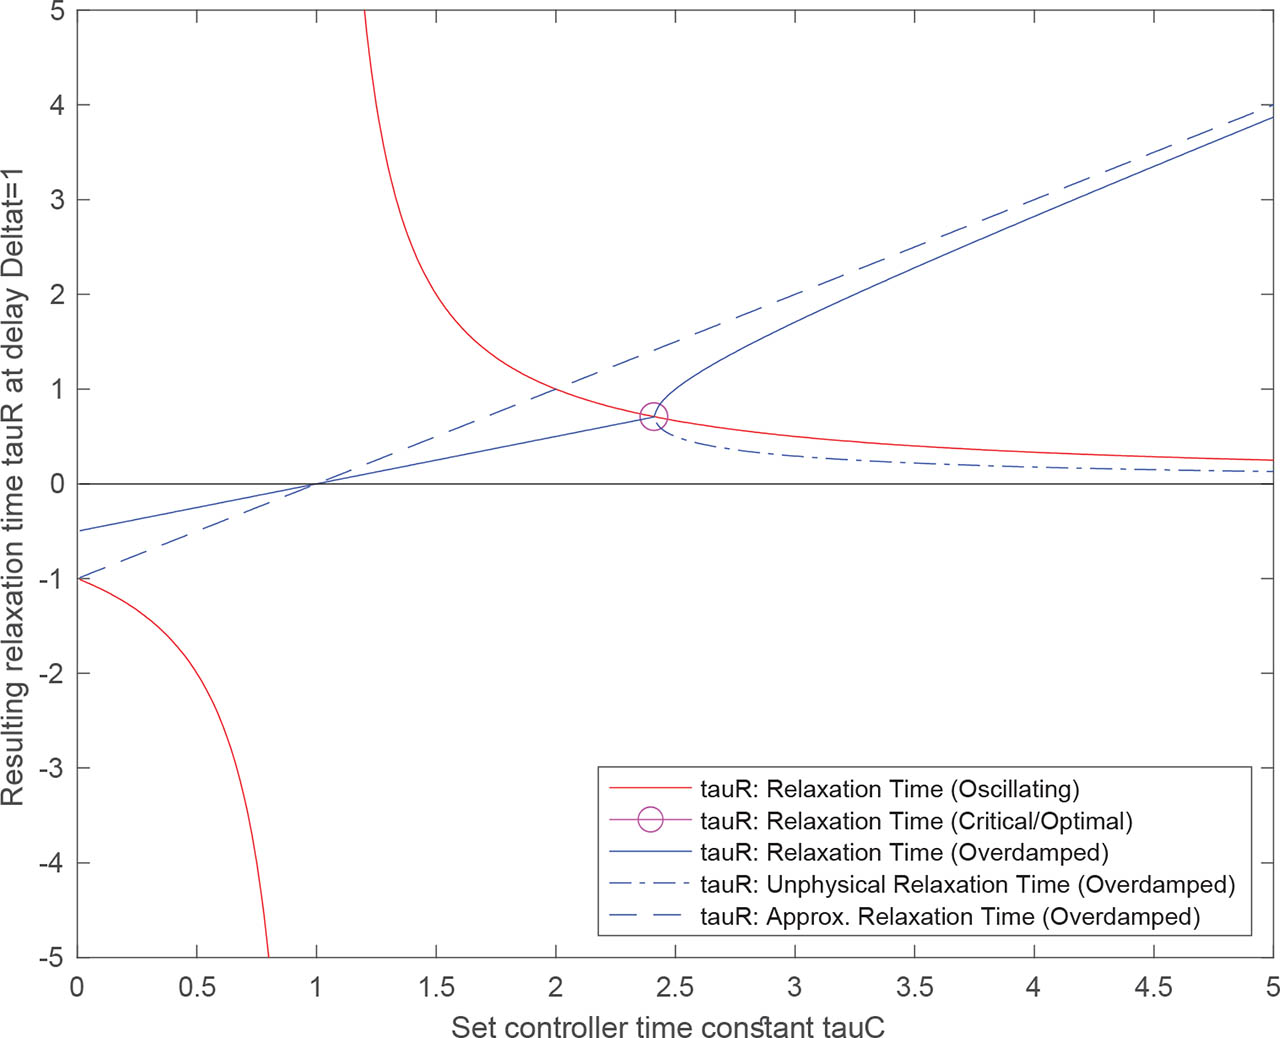
Fig. 7
Theoretical development of relaxation time τR ranging from oscillating over the critical/optimal setting to the overdamped situation.
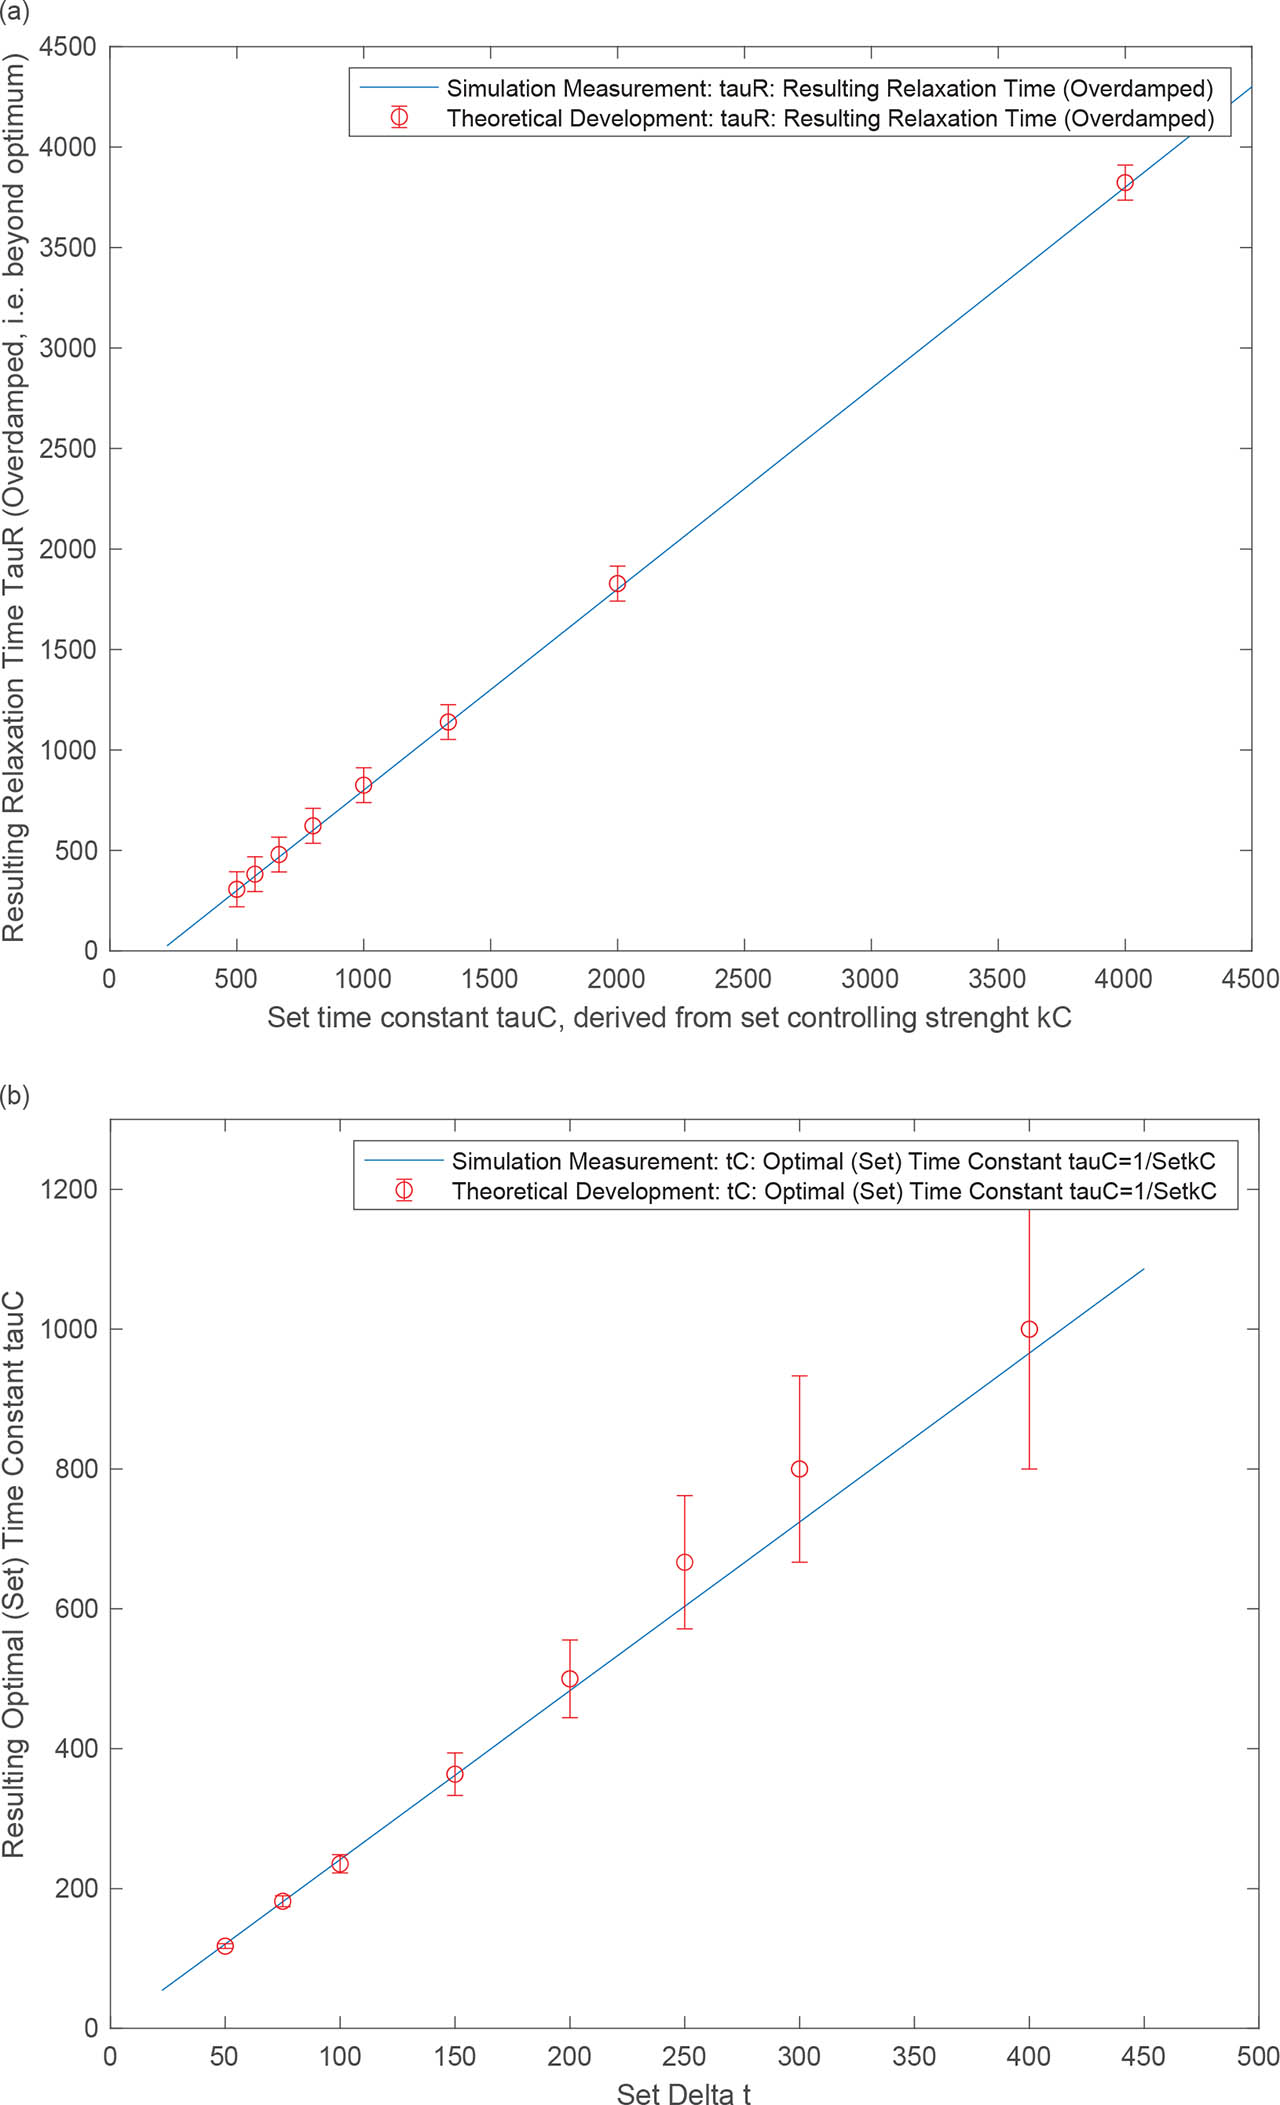
Fig. 8
(a) Relaxation time τR, vs. given kC(=1/τC) with Δτ = 200. (b). Varying optimally set τC vs. a given delay Δω.
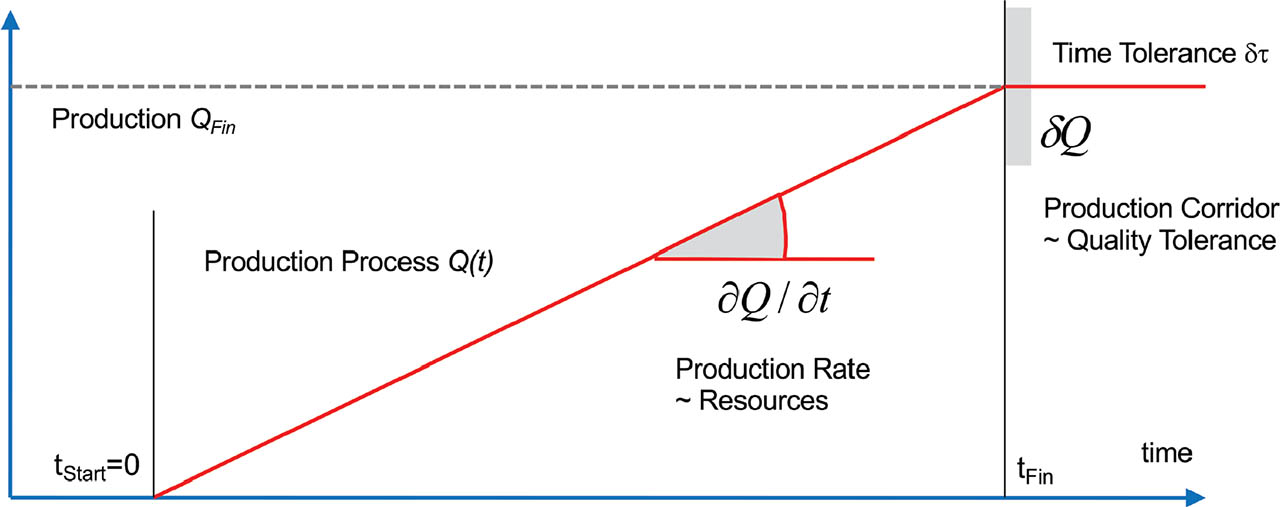
Fig. 9
Linear process subjected to controlling.
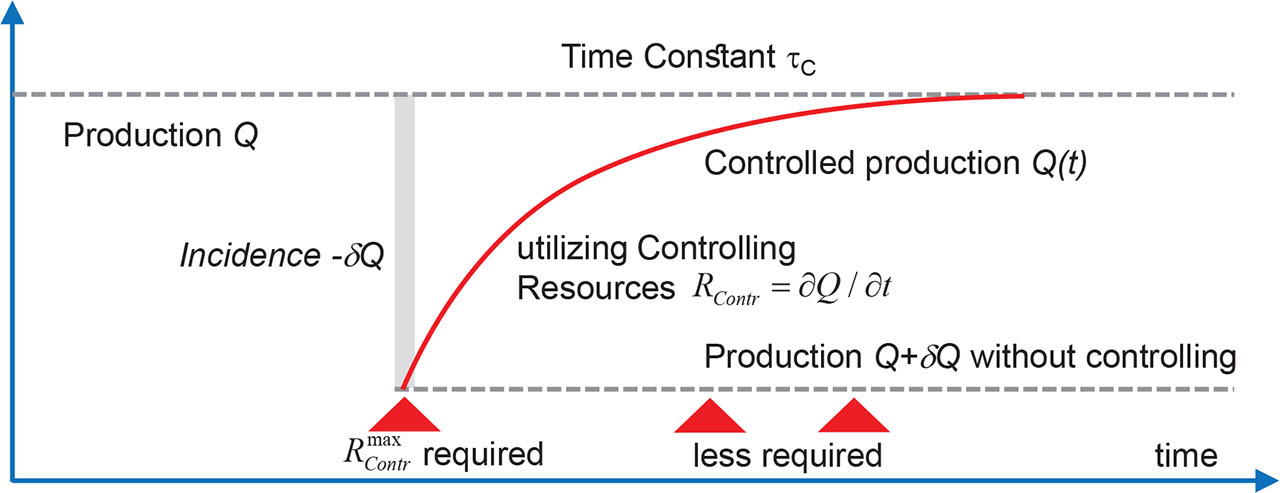
Fig. 10
Randomly occurring incidents need full resources to respond in time.
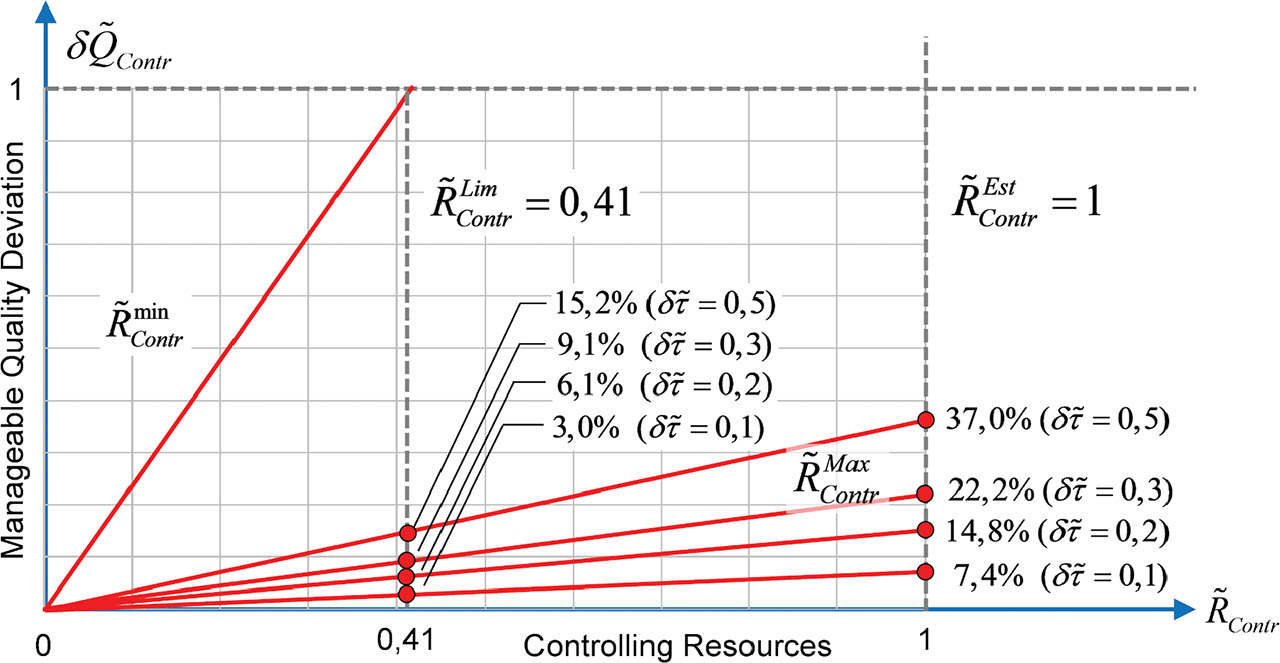
Fig. 11
Limitations of manageable quality deviation for different scenarios. The range below the lines represents the manageable quality deviation.
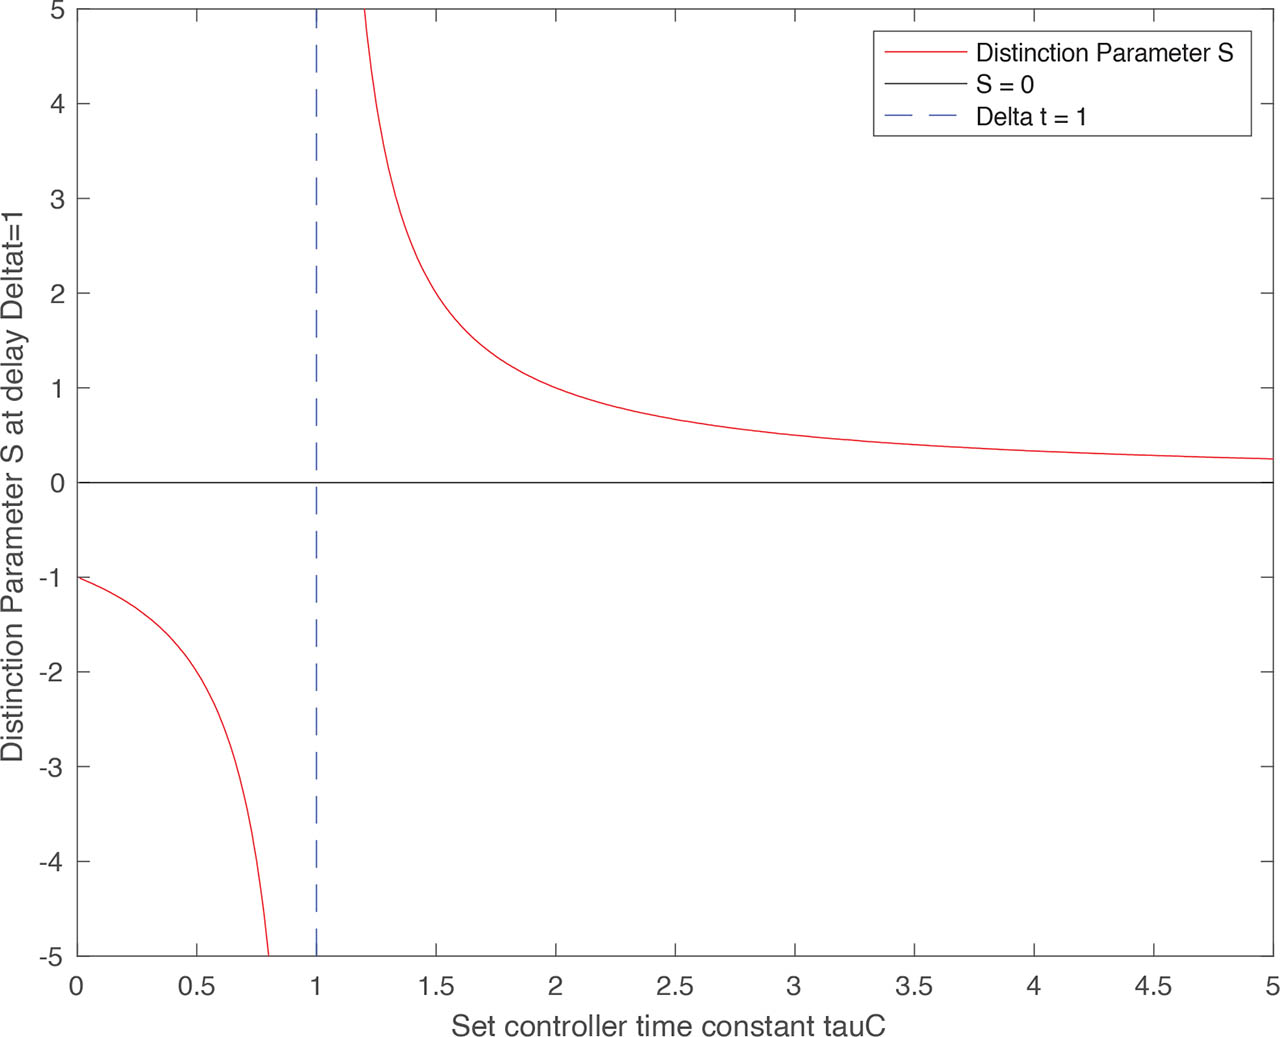
Fig. 12
Development of distinguishing parameter S with τc close to Δt.
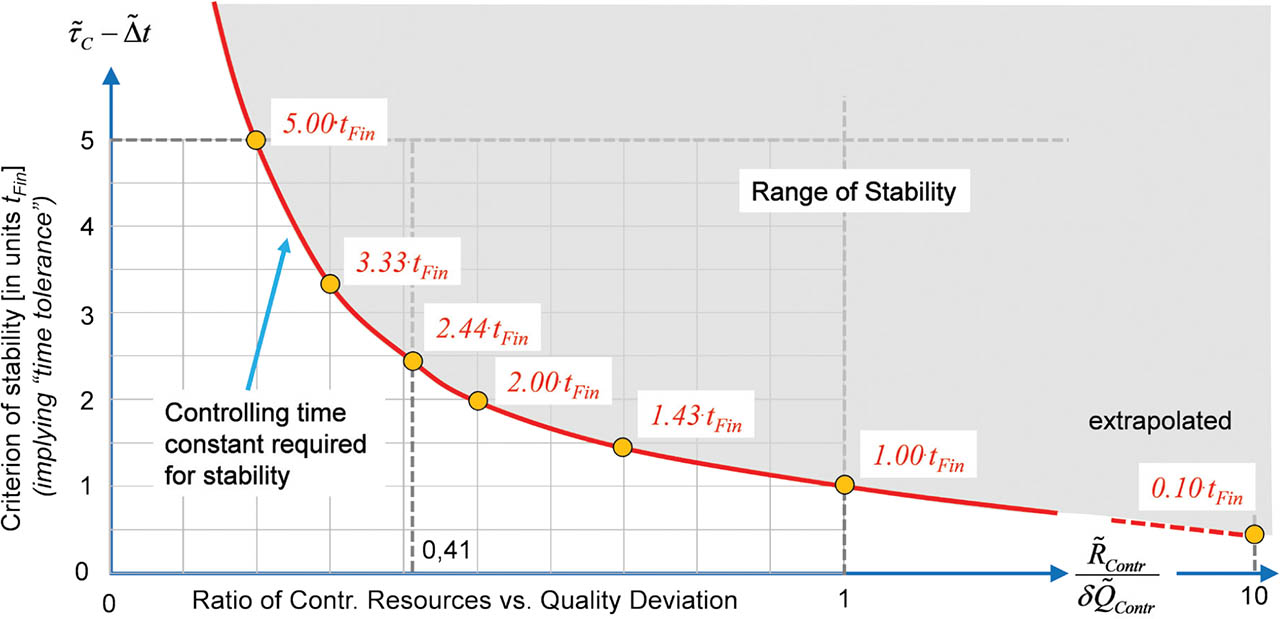
Fig. 13
Fundamental confines to controllability.