
Fig. 1
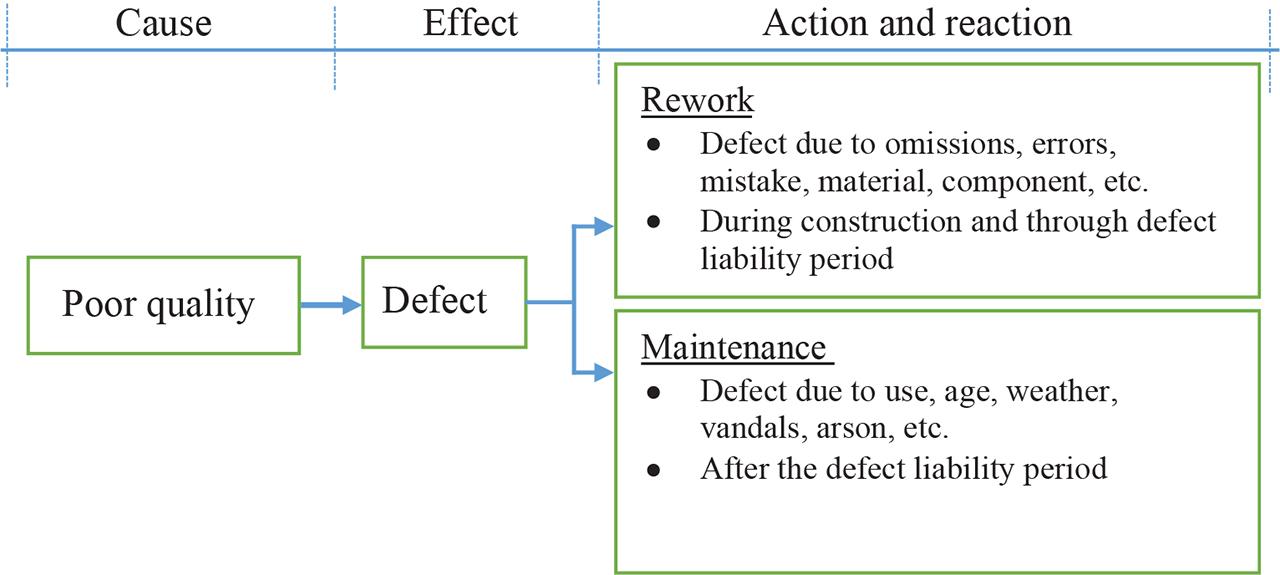
Fig. 2
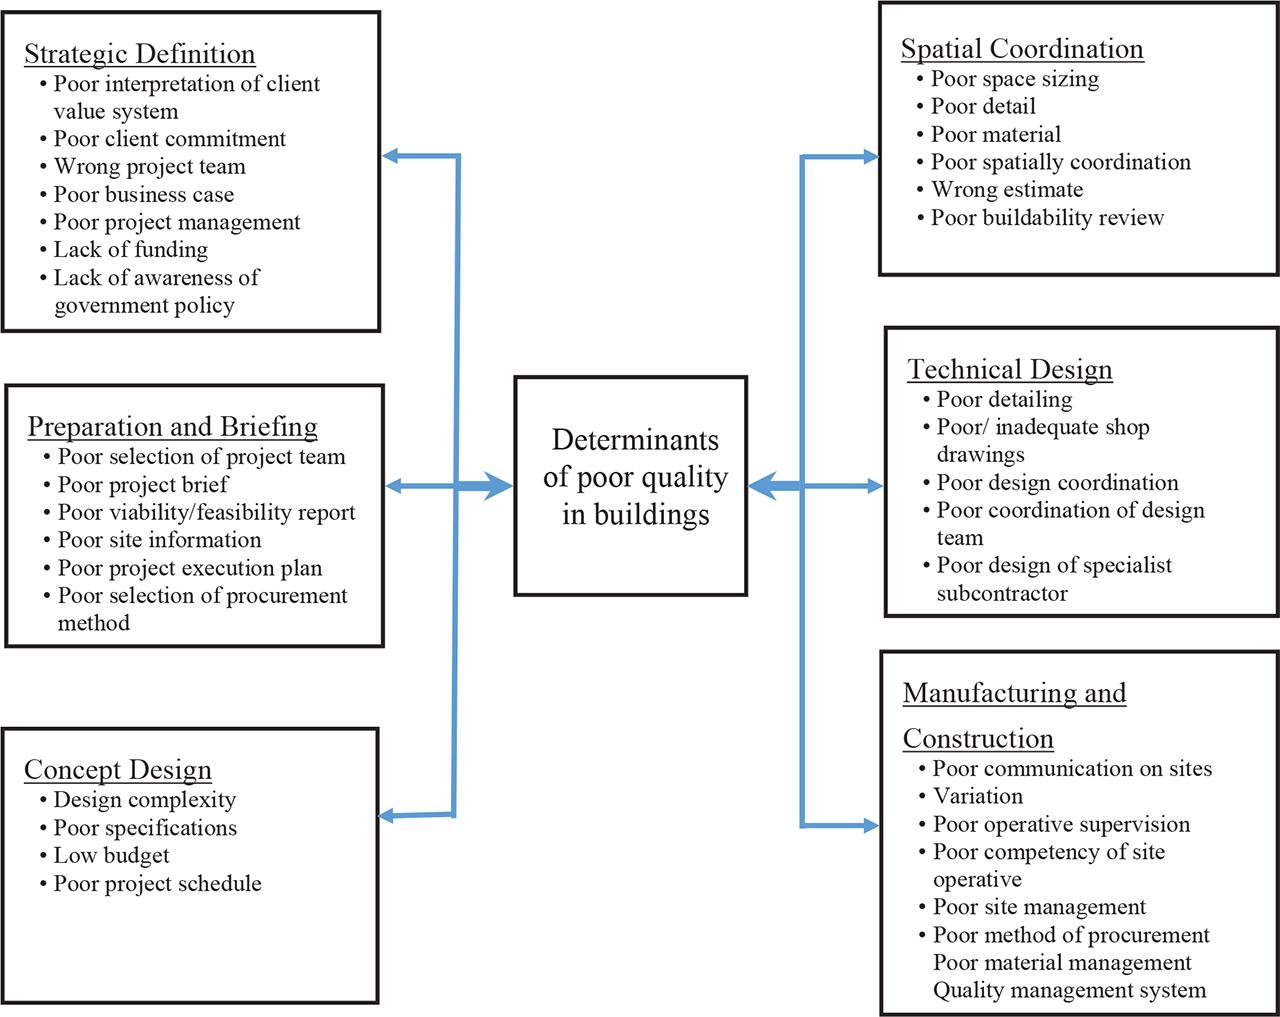
Fig. 3
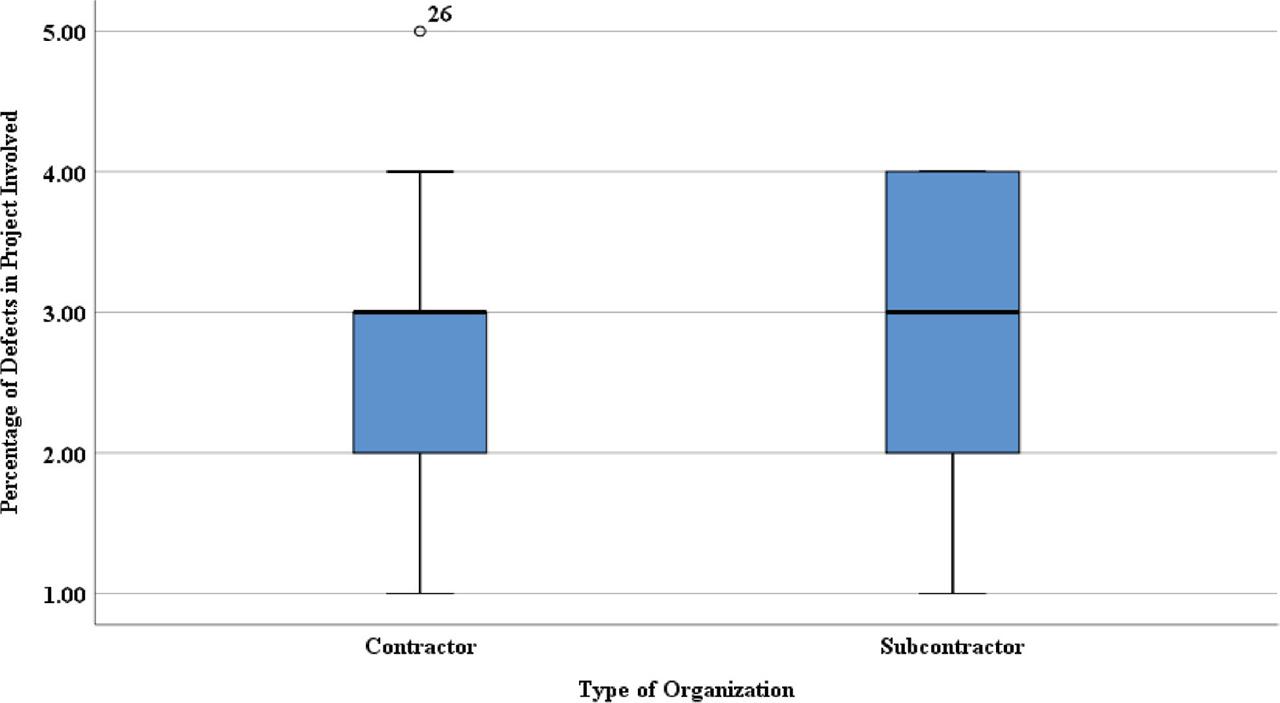
Fig. 4
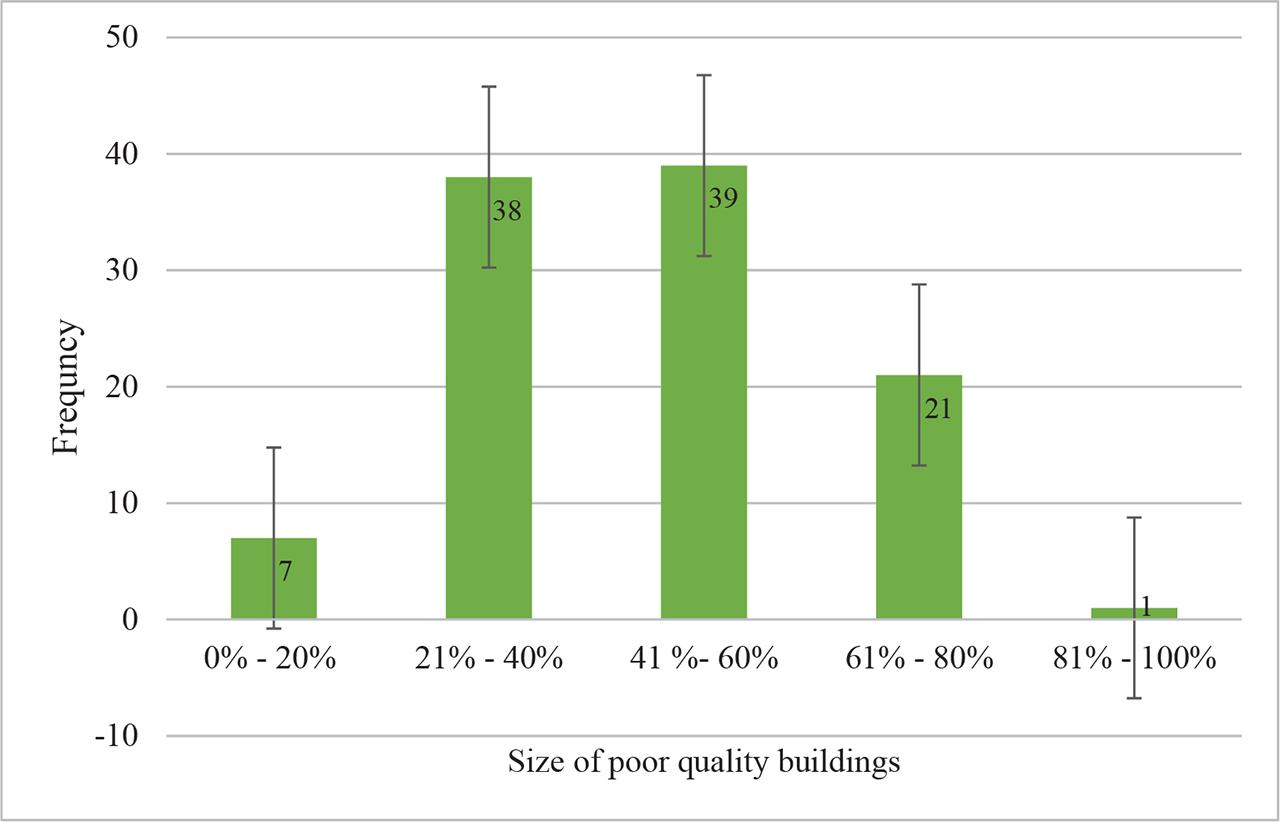
Fig. 5
Results of a sample t-test for the determinants of poor quality
| Determinant | Test value = 3.5 | Std. deviation | Std. error mean | |||||
|---|---|---|---|---|---|---|---|---|
| t | df | Sig. (2-tailed) | Mean difference | 95% Confidence interval of the difference | ||||
| Lower | Upper | |||||||
| Incompetency of labour | 1.085 | 105 | 0.281 | 0.075 | −0.063 | 0.214 | 14.329 | 1.392 |
| Operative high workload | 0.530 | 105 | 0.597 | 0.038 | −0.103 | 0.179 | 14.651 | 1.423 |
| Low welfare for workers | −0.845 | 105 | 0.400 | −0.066 | −0.221 | 0.089 | 16.099 | 1.564 |
| Poor site supervision | 5.789 | 105 | 0.000 | 0.434 | 0.285 | 0.583 | 15.435 | 1.499 |
| Poor competency of site supervisor | −0.448 | 105 | 0.655 | −0.028 | −0.154 | 0.097 | 13.008 | 1.263 |
| Poor coordination of subcontractors’ works | −0.621 | 105 | 0.536 | −0.047 | −0.198 | 0.104 | 15.647 | 1.520 |
| Construction method | 2.215 | 105 | 0.029 | 0.170 | 0.018 | 0.322 | 15.789 | 1.534 |
| Poor quality procedure | 4.301 | 105 | 0.000 | 0.302 | 0.163 | 0.441 | 14.454 | 1.404 |
| Design complexity | 3.305 | 105 | 0.001 | 0.264 | 0.106 | 0.423 | 16.458 | 1.599 |
| Incomplete drawings and specifications | −1.944 | 105 | 0.055 | −0.160 | −0.324 | 0.003 | 16.990 | 1.650 |
| Low quality of materials | 9.488 | 105 | 0.000 | 0.642 | 0.508 | 0.776 | 13.922 | 1.352 |
| Improper material storage | −9.736 | 105 | 0.000 | −0.821 | −0.988 | −0.654 | 17.358 | 1.686 |
| Usage of wrong equipment and plants | −2.324 | 105 | 0.022 | −0.170 | −0.315 | −0.025 | 15.048 | 1.462 |
| Rework/changes | 0.966 | 105 | 0.336 | 0.066 | −0.070 | 0.202 | 14.080 | 1.368 |
| Poor communication on site | −1.944 | 105 | 0.055 | −0.160 | −0.324 | 0.003 | 16.990 | 1.650 |
| Variation | −2.595 | 105 | 0.011 | −0.179 | −0.316 | −0.042 | 14.222 | 1.381 |
| Project duration | −6.627 | 105 | 0.000 | −0.491 | −0.637 | −0.344 | 15.243 | 1.481 |
| Weather condition | 0.000 | 105 | 1.000 | 0.000 | −0.139 | 0.139 | 14.409 | 1.400 |
| Wrong information on nature of sites | −0.361 | 105 | 0.719 | −0.028 | −0.184 | 0.127 | 16.144 | 1.568 |
| Poor information on government policy | −10.269 | 105 | 0.000 | −0.755 | −0.900 | −0.609 | 15.134 | 1.470 |
Reliability statistics
| Cronbach's alpha | Part 1 | Value | 0.686 |
|---|---|---|---|
| Part 2 | Value | 0.706 | |
| Total N of items | 20 | ||
| Correlation between forms | 0.618 | ||
| Spearman-Brown coefficient | Equal length | 0.764 | |
| Unequal length | 0.764 | ||
| Guttman split-half coefficient | 0.764 | ||
Cross-tabulation between current position and academic background
| Current position | Academic background | |||||
|---|---|---|---|---|---|---|
| PMR | SPM/STPM | Diploma | Bachelor degree | Master | Total | |
| Site engineer | 0 | 0 | 2 | 14 | 1 | 17 |
| Site supervisor | 0 | 4 | 12 | 9 | 0 | 25 |
| Safe and health officer | 0 | 0 | 3 | 2 | 0 | 5 |
| Site quantity surveyor | 0 | 0 | 2 | 15 | 0 | 17 |
| Quality officer | 0 | 1 | 1 | 3 | 1 | 6 |
| CM | 0 | 0 | 1 | 2 | 1 | 4 |
| Site worker/labourer | 8 | 21 | 2 | 1 | 0 | 32 |
| Total | 8 | 26 | 23 | 46 | 3 | 106 |
Correlations Spearman's rho
| Percentage of defects in the project | ||
|---|---|---|
| Number of projects completed | Correlation coefficient | 0.329* |
| Sig. (2-tailed) | 0.001 | |
| N | 106 |
Cross-tabulation between the type of organisation and number of projects completed in 5 years
| Type of organisation | Number of project completed | |||
|---|---|---|---|---|
| 0–5 | 6–10 | 11–15 | Total | |
| Main contractor | 49 | 19 | 5 | 73 |
| Subcontractor | 17 | 15 | 1 | 33 |
| Total | 66 | 34 | 6 | 106 |
Summary of previous studies on determinants of poor quality
| Criteria | Main author |
|---|---|
| Lack of skilled labour | Ali and Wen (2011), Hoonakker et al. (2010) and Olanrewaju et al. (2021) |
| Lack of worker empowerment/incentive | Loushine and Hoonakker (2002), Marosszeky et al. (2002), Hiyassat (2000) and Pheng and Wei (1996) |
| Poor interpretations of client/customer expectations | Loushine and Hoonakker (2002) and Olanrewaju et al. (2021) |
| Design complexity | Tang et al. (2004), Chan and Tam (2000), Olanrewaju et al. (2021), Olanrewaju (2021) and Olanrewaju et al. (2011) |
| Inadequate focus on client/customer requirement | Hoonakker (2006) and Olanrewaju et al. (2021) |
| Employee involvement/altitude | Hoonakker (2006) and Olanrewaju et al. (2021) |
| Lack of management commitment | Janipha and Ismail (2013), Ogwueleka (2013), Joaquin et al. (2008), Husin et al. (2008), Hoonakker (2006), Jha and Iyer (2006), Hiyassat (2000) and Arditi and Gunaydin (1998) |
| Poor communication | Mane and Patil (2015), Janipha and Ismail (2013), Ogwueleka (2013), Ali and Wen (2011), Ofori (2006), Hoonakker (2006) and Arditi and Gunaydin (1998) |
| Tight project schedule | Husin et al. (2008) |
| Variations | Ogwueleka (2013), Husin et al. (2008) and Joaquin et al. (2008) |
| Poor coordination between project | Ogwueleka (2013), Tang et al. (2004), Husin et al. (2008), Joaquin et al. (2008), Hoonakker (2006), Jha and Iyer (2006) and Arditi and Gunayalin (1998) |
| Poor planning/scheduling process | Mane and Patil (2015), Ofori (2006) and Chan and Tam (2000) |
| Expertise knowledge or training system | Yung and Yip (2010) and Arditi and Gunayalin (1998) |
| Poor time management | Ali and Wen (2011) and Olanrewaju et al. (2021) |
| Lack of quality assurance/Quality policy | Ali et al. (2010), Ogwueleka (2013), Joaquin et al. (2008) and Arditi and Gunayalin (1998) |
| Lack of project supervision | Janipha and Ismail (2013), Ogwueleka (2013), Husin et al. (2008) and Arditi and Gunayalin (1998) |
| Unavailability of resources | Joaquin et al. (2008), Chan and Tam (2000) and Olanrewaju et al. (2021) |
| Project environment | Ogwueleka (2013) and Joaquin et al. (2008) |
| Uniqueness of the project | Ogwueleka (2013), Joaquin et al. (2008) and Husin et al. (2008) |
| Insufficient project manager | Mane and Patil (2015) and Ofori (2006) |
| Lack of training policy | Mallawaarachchi and Senaratn (2015), Ogwueleka (2013), Said et al. (2009), Joaquin et al. (2008) and Olanrewaju (2012) |
Descriptive statistics of the determinants of poor quality
| Determinant | Least agree | Less agree | Agree | Strongly agree | Extremely agree |
|---|---|---|---|---|---|
| Incompetency of labour | 0 | 6 | 41 | 51 | 8 |
| Operative high workload | 0 | 7 | 43 | 48 | 8 |
| Low welfare for workers | 1 | 9 | 48 | 39 | 9 |
| Poor site supervision | 0 | 2 | 29 | 49 | 26 |
| Poor competency of site supervisor | 0 | 3 | 56 | 41 | 6 |
| Poor coordination of subcontractors’ works | 0 | 9 | 50 | 37 | 10 |
| Construction method | 0 | 7 | 35 | 50 | 14 |
| Poor quality procedure | 0 | 5 | 25 | 62 | 14 |
| Design complexity | 0 | 6 | 33 | 47 | 20 |
| Incomplete drawings and specifications | 0 | 16 | 48 | 32 | 10 |
| Low quality of materials | 0 | 2 | 13 | 59 | 32 |
| Improper material storage | 2 | 52 | 34 | 14 | 4 |
| Usage of wrong equipment and plants | 3 | 39 | 41 | 16 | 7 |
| Rework/changes | 0 | 6 | 41 | 52 | 7 |
| Poor communication on site | 0 | 16 | 48 | 32 | 10 |
| Variation | 0 | 11 | 54 | 37 | 4 |
| Project duration | 1 | 26 | 51 | 27 | 1 |
| Poor weather condition | 0 | 7 | 46 | 46 | 7 |
| Wrong information on nature of sites | 0 | 14 | 35 | 50 | 7 |
| Poor information on government policy | 2 | 40 | 48 | 15 | 1 |