
Fig. 1

Fig. 2
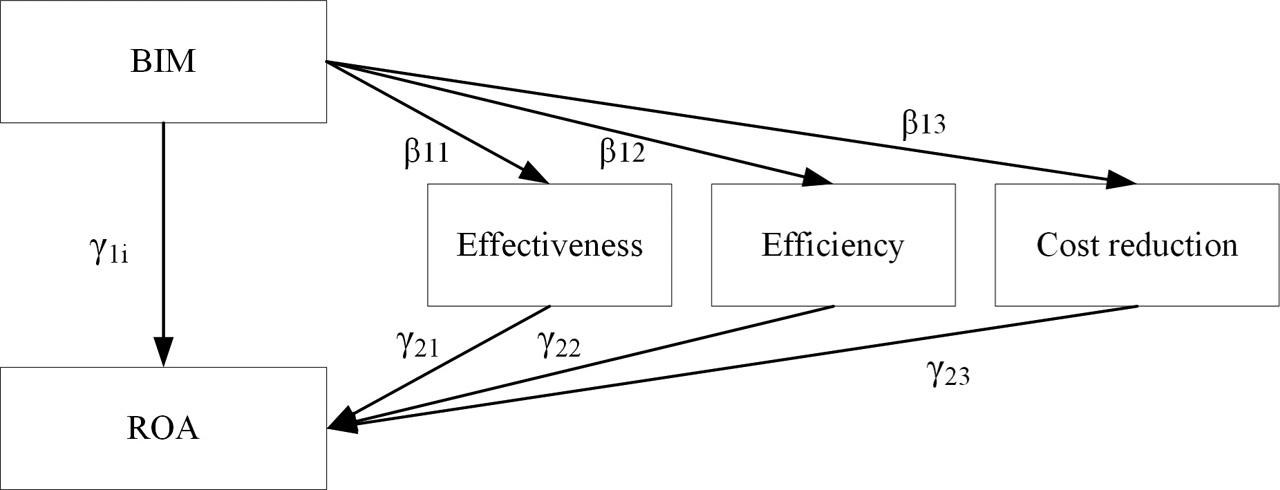
Fig. 3
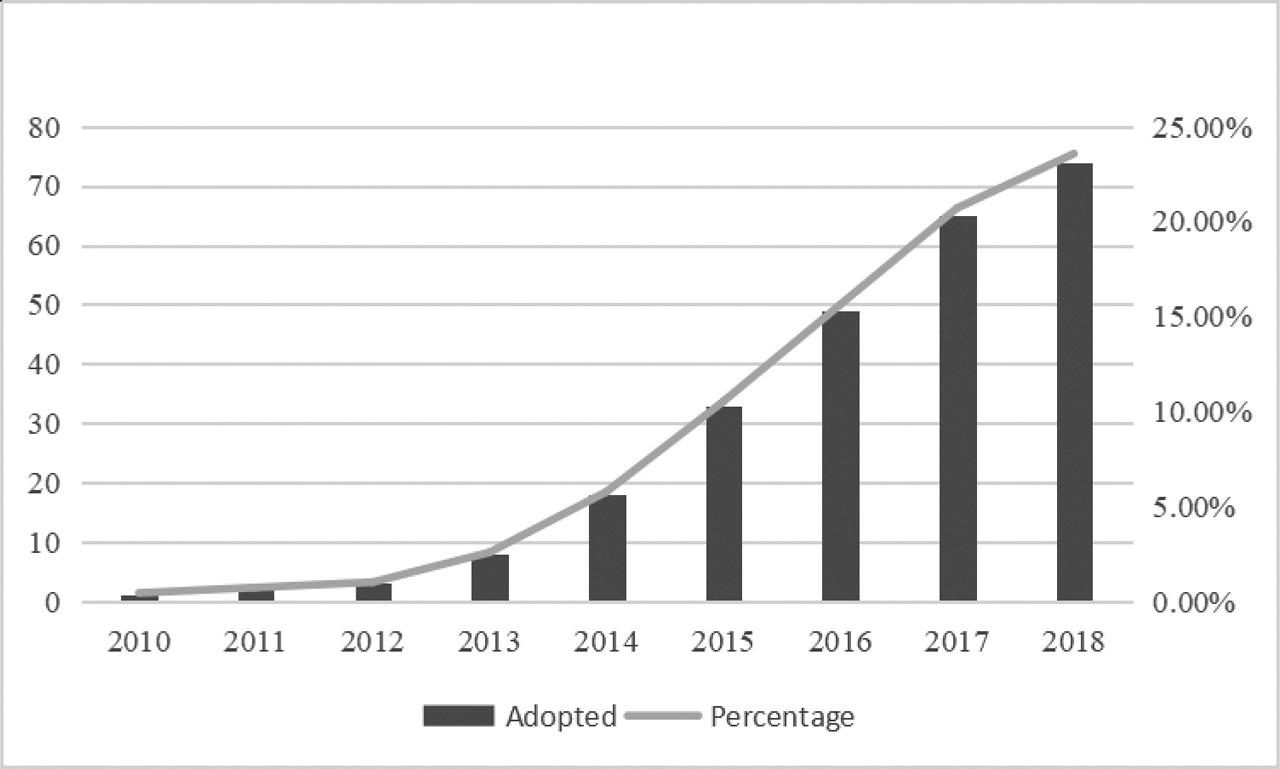
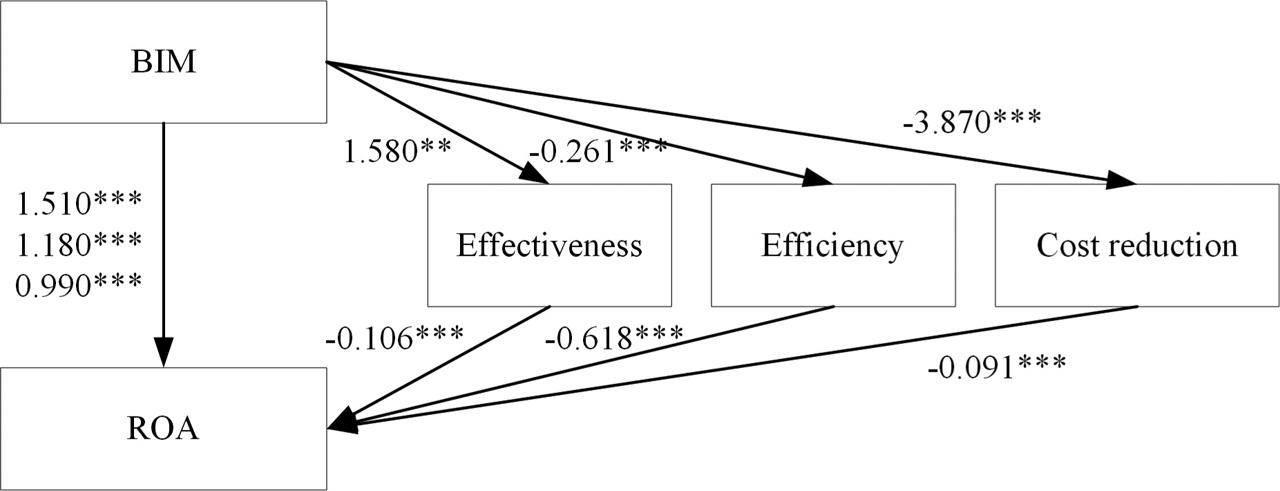
Fig. 4
Impacts of BIM adoption on cost reductions
| Dependent variables | Model (10) All samples | Model (11) SOEs | Model (12) Non-SOEs |
|---|---|---|---|
| BIM | −3.490*** (−3.881) | −2.104 (−1.438) | −3.870*** (−3.444) |
| SOE | 4.272*** (7.286) | ||
| Age | 0.027 (0.466) | 0.174** (2.069) | −0.191** (−2.447) |
| Size | 0.757*** (3.711) | 1.216*** (4.466) | −0.241 (−0.724) |
| Top | −0.074*** (−4.349) | −0.084*** (−3.207) | −0.087*** (−3.887) |
| Lev | 0.234*** (14.548) | 0.165*** (7.020) | 0.293*** (13.057) |
| Growth | 0.008 (1.378) | 0.030*** (3.575) | −0.010 (−1.307) |
| Tangible | 0.077*** (3.552) | 0.070*** (2.748) | 0.053 (1.143) |
| _cons | 43.612*** (20.029) | 45.878*** (14.666) | 53.382*** (16.761) |
| Year | Fixed | Fixed | Fixed |
| Industry | Fixed | Fixed | Fixed |
| N | 2,289 | 1,141 | 1,148 |
| R2 | 0.443 | 0.506 | 0.404 |
| p-value | 0.000 | 0.000 | 0.000 |
Results of descriptive analysis
| Variables | Observation | Mean | Standard Deviation | Minimum | Maximum |
|---|---|---|---|---|---|
| ROA | 2,705 | 6.918 | 15.731 | −5.923 | 28.094 |
| Cost | 2,705 | 69.382 | 15.731 | 25.247 | 95.596 |
| Cycle | 2,705 | 5.867 | 1.337 | 1.053 | 8.715 |
| Admin | 2,705 | 8.770 | 8.273 | 1.188 | 55.353 |
| Age | 2,704 | 17.438 | 5.928 | 0 | 35 |
| Top | 2,289 | 59.270 | 16.246 | 23.38 | 94.66 |
| Lev | 2,705 | 55.579 | 20.677 | 8.596 | 90.803 |
| Growth | 2,635 | 20.262 | 43.112 | −64.930 | 261.231 |
| Tangible | 2,705 | 9.915 | 14.294 | 0.063 | 73.782 |
The influences of BIM adoption and mediators on financial performance
| Dependent variables | Model (13) All samples | Model (14) SOEs | Model (15) Non-SOEs |
|---|---|---|---|
| BIM | 1.510*** (3.995) | 1.180*** (3.063) | 0.990*** (2.643) |
| Admin | −0.106*** (−7.456) | ||
| Cycle | −0.618*** (−4.242) | ||
| Cost | −0.091*** (−9.187) | ||
| Age | 0.023 (0.883) | 0.000 (0.014) | −0.009 (−0.366) |
| Size | 0.475*** (4.196) | 0.546*** (4.757) | 0.592*** (5.358) |
| Top | 0.067*** (8.774) | 0.071*** (9.306) | 0.067*** (8.982) |
| Lev | −0.083*** (−10.414) | −0.055*** (−6.890) | −0.037*** (−4.663) |
| Growth | 0.019*** (7.409) | 0.021*** (7.845) | 0.022*** (8.397) |
| Tangible | −0.048*** (−3.064) | −0.077*** (−4.615) | −0.051*** (−3.311) |
| _cons | 4.298*** (3.735) | 5.675*** (3.716) | 5.973*** (5.058) |
| Year | Fixed | Fixed | Fixed |
| Industry | Fixed | Fixed | Fixed |
| N | 1,148 | 1,148 | 1,148 |
| R2 | 0.295 | 0.272 | 0.312 |
| p-value | 0.000 | 0.000 | 0.000 |
Impacts of BIM adoption on effectiveness
| Independent variables | Model (4) All samples | Model (5) SOEs | Model (6) Non-SOEs |
|---|---|---|---|
| BIM | 1.128** (2.077) | 0.705 (0.974) | 1.580** (2.007) |
| SOE | −1.462*** (−4.127) | ||
| Age | −0.015 (−0.435) | −0.147*** (−3.525) | 0.144*** (2.638) |
| Size | −0.533*** (−4.322) | −0.428*** (−3.181) | −1.299*** (−5.570) |
| Top | −0.068*** (−6.592) | −0.061*** (−4.677) | −0.078*** (−5.011) |
| Lev | −0.152*** (−15.659) | −0.125*** (−10.723) | −0.178*** (−11.315) |
| Growth | −0.027*** (−7.701) | −0.024*** (−5.611) | −0.028*** (−5.212) |
| Tangible | 0.015 (1.146) | −0.024* (−1.914) | 0.075** (2.304) |
| _cons | 26.310*** (20.005) | 24.715*** (15.987) | 29.799*** (13.356) |
| Year | Fixed | Fixed | Fixed |
| Industry | Fixed | Fixed | Fixed |
| N | 2,289 | 1,141 | 1,148 |
| R2 | 0.289 | 0.241 | 0.324 |
| p-value | 0.000 | 0.000 | 0.000 |
Variables list
| Variables | Name | Code | Calculations |
|---|---|---|---|
| Dependent variable | Profitability | ROA | Net income/Total assets |
| Independent variable | BIM adoption | BIM | 1 = adopted BIM |
| Mediation variables | Effectiveness | Admin | Administration expense/Revenue |
| Efficiency | Cycle | Ln (business cycle) | |
| Cost reduction | Cost | Cost of revenue/Revenue | |
| Control variables | Nature of the enterprise | SOE | 1 = SOEs |
| Size | Size | Ln (number of staff) | |
| Age | Age | Year–Foundation year | |
| Ownership concentration | Top | The shares ratio of top 10 shareholders | |
| Leverage | Lev | Assets-liability ratio | |
| Growth of sales | Growth | Revenuet/Revenuet−1 | |
| Tangible ratio | Tangible | Fixed assets/total assets | |
| Year | Year | Dummy variable of year | |
| Industry | Industry | Dummy variable of industry | |
Impacts of BIM adoption on financial performance
| Independent variables | Model (1) All samples | Model (2) SOEs | Model (3) Non-SOEs |
|---|---|---|---|
| BIM | 0.916*** (3.334) | 0.185 (0.475) | 1.342*** (3.473) |
| SOE | −0.653*** (−3.646) | ||
| Age | 0.053*** (3.057) | 0.083*** (3.721) | 0.008 (0.292) |
| Size | 0.270*** (4.327) | 0.262*** (3.616) | 0.614*** (5.362) |
| Top | 0.058*** (11.083) | 0.038*** (5.428) | 0.075*** (9.752) |
| Lev | −0.061*** (−12.502) | −0.064*** (−10.206) | −0.064*** (−8.277) |
| Growth | 0.016*** (9.321) | 0.009*** (3.954) | 0.022*** (8.453) |
| Tangible | −0.024*** (−3.671) | −0.008 (−1.221) | −0.056*** (−3.499) |
| _cons | 3.696*** (5.554) | 4.162*** (5.005) | 1.125 (1.027) |
| Year | Fixed | Fixed | Fixed |
| Industry | Fixed | Fixed | Fixed |
| N | 2,289 | 1,141 | 1,148 |
| R2 | 0.246 | 0.282 | 0.260 |
| p-value | 0.000 | 0.000 | 0.000 |
Impacts of BIM adoption on efficiency
| Dependent variables | Model (7) All samples | Model (8) SOEs | Model (9) Non-SOEs |
|---|---|---|---|
| BIM | −0.133* (−1.890) | 0.072 (0.596) | −0.261*** (−3.330) |
| SOE | −0.092** (−1.999) | ||
| Age | −0.020*** (−4.534) | −0.024*** (−3.429) | −0.012** (−2.219) |
| Size | −0.100*** (−6.267) | −0.035 (−1.560) | −0.110*** (−4.735) |
| Top | −0.009*** (−6.898) | −0.011*** (−5.006) | −0.006*** (−3.666) |
| Lev | 0.009*** (6.970) | 0.005** (2.387) | 0.015*** (9.374) |
| Growth | −0.002*** (−5.090) | −0.002*** (−2.809) | −0.003*** (−4.704) |
| Tangible | −0.025*** (−14.720) | −0.019*** (−8.934) | −0.034*** (−10.304) |
| _cons | 8.089*** (47.438) | 8.081*** (31.340) | 7.366*** (33.119) |
| Year | Fixed | Fixed | Fixed |
| Industry | Fixed | Fixed | Fixed |
| N | 2,289 | 1,141 | 1,148 |
| R2 | 0.539 | 0.624 | 0.466 |
| p-value | 0.000 | 0.000 | 0.000 |