
Fig. 1
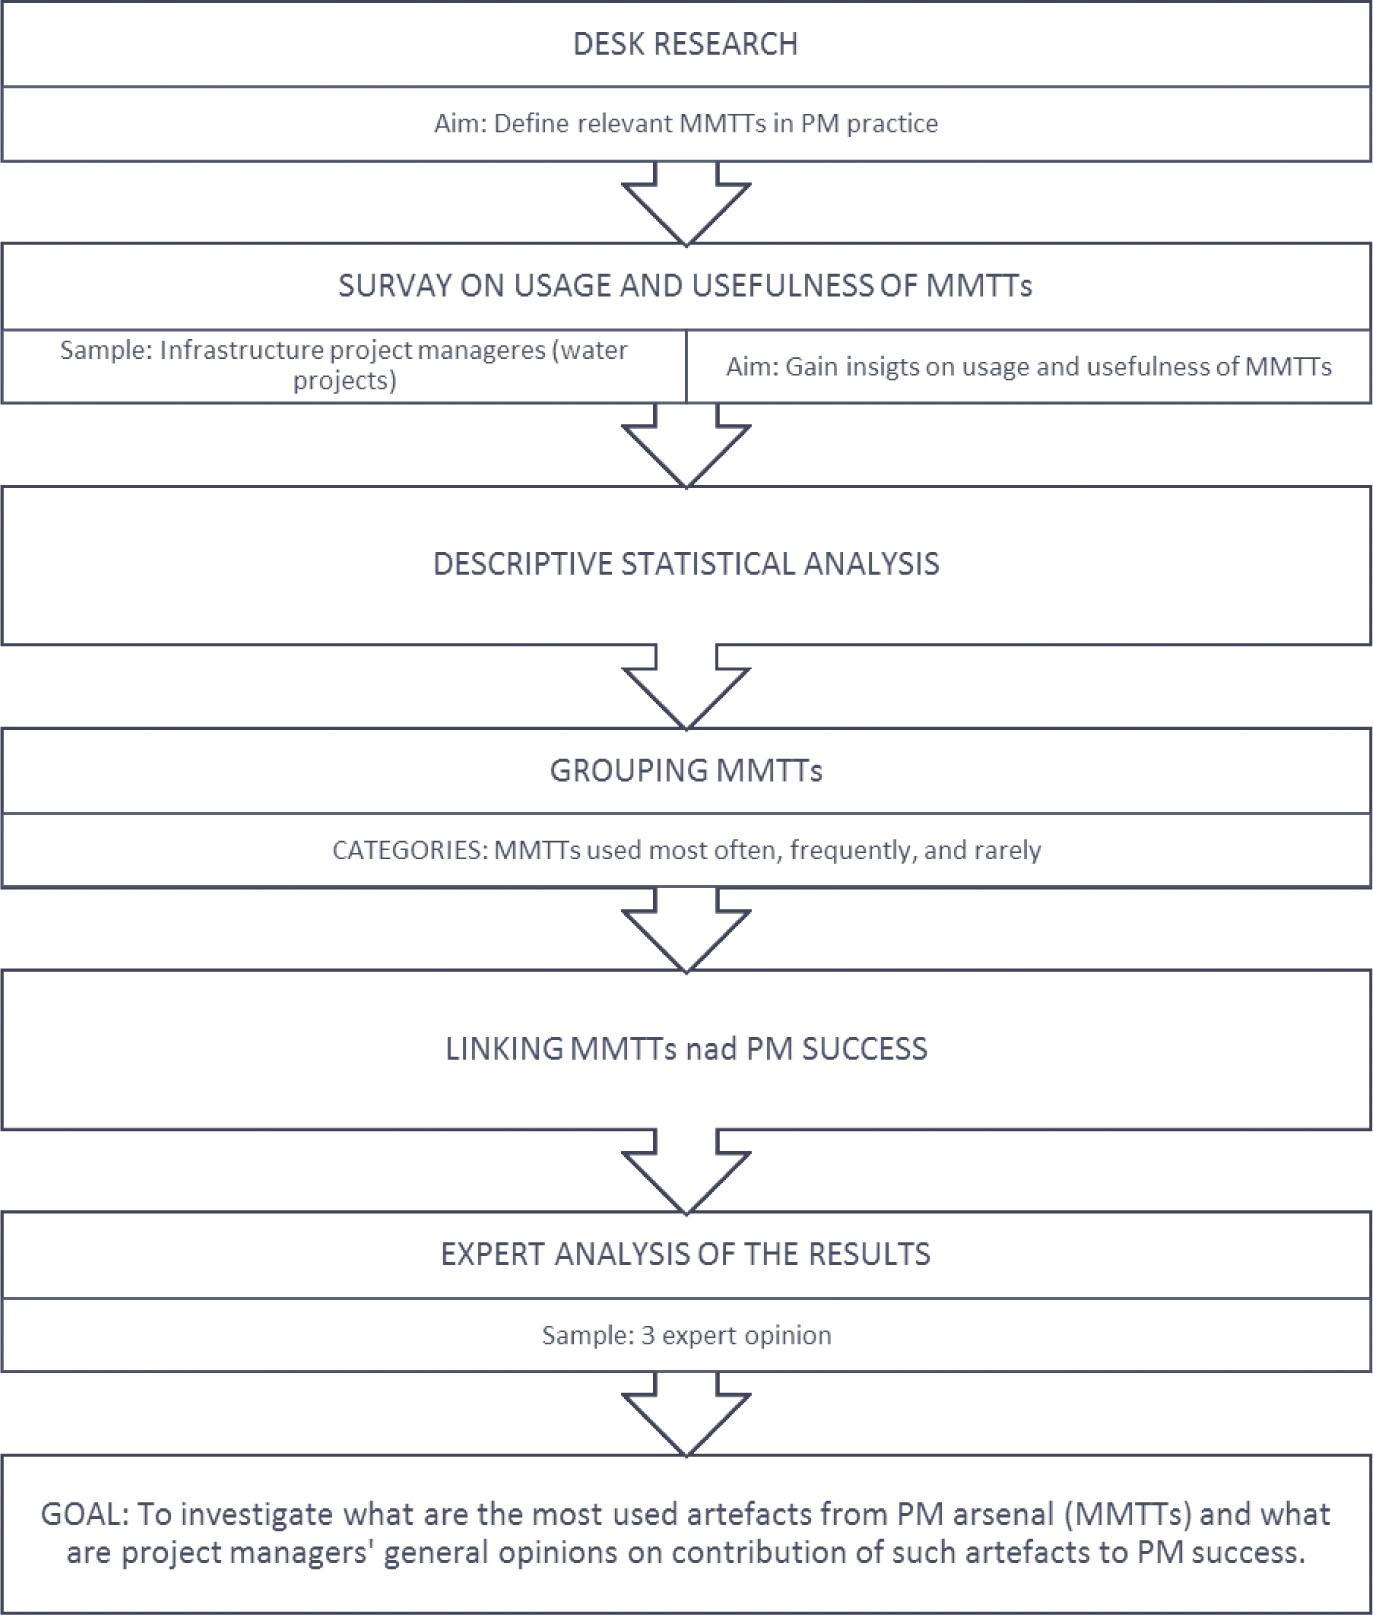
Fig. 2
Fig. 3
Fig. 4
Correlation of data on the evaluation of PM success and usage of MMTTs
| MMTT that project managers use | Correlation r | Usage level declared by project managers |
|---|---|---|
| International Competence Baseline | 0.860 | Frequently |
| Critical path method | 0.694 | Frequently |
| Organizational breakdown structure | 0.642 | Frequently |
| Project evaluation and review technique | 0.600 | Frequently |
| Sensitivity analysis | 0.582 | Frequently |
| Risk register | 0.545 | Frequently |
| Life cycle cost | 0.520 | Frequently |
| Precedence diagram method | 0.471 | Frequently |
| “In house” decision-making techniques and tools | 0.462 | Frequently |
| Risk assessment | 0.459 | Most often |
| Groupware (email only) | 0.310 | Most often |
| Cost-benefit analysis | 0.240 | Most often |
| Other information communication technology support tools | 0.207 | Frequently |
| Other risk assessment tools and techniques | 0.184 | Rarely |
| Flow diagrams | 0.173 | Frequently |
| Progress reports | 0.172 | Most often |
| Project goals charter | 0.168 | Most often |
| “In house” project management tools | 0.165 | Frequently |
| Cash flow analysis | 0.164 | Most often |
| Other project management tools | 0.151 | Frequently |
| Team building activities | 0.145 | Frequently |
| PM methodology developed “in house” | 0.114 | Most often |
| Strengths, weaknesses, opportunities and threats analysis | 0.105 | Frequently |
| Work breakdown structure | 0.075 | Frequently |
| Gantt bar charts | 0.062 | Most often |
| Decision analysis | 0.036 | Most often |
| Integrated groupware (email, collaborative tools, shared access to web portals, etc.) | 0.035 | Most often |
| Checklist analysis | 0.023 | Most often |
| “In house” communication and reporting system | 0.021 | Most often |
Perceived usefulness of used MMTTs
| Most often used MMTTs | M | f(n) | Frequently used MMTTs | M | f(n) | Rarely used MMTTs | M | f(n) |
|---|---|---|---|---|---|---|---|---|
| Integrated groupware (email, collaborative tools, shared access to web portals, etc.) | 4.39 | 31 | Other decision-making techniques and tools | 4.14 | 7 | Agile board | 4.50 | 2 |
| Lessons learned | 4.38 | 13 | Team building activities | 4.00 | 10 | Decision trees | 4.50 | 2 |
| MS Excel | 4.29 | 31 | Decision analysis | 4.00 | 6 | “In house” risk assessment tools | 4.00 | 4 |
| Cost-benefit analysis | 4.17 | 18 | Sensitivity analysis | 4.00 | 5 | Trend and variation analysis | 4.00 | 3 |
| Reporting system | 4.05 | 22 | Communication plan | 3.91 | 11 | Earned value management | 4.00 | 2 |
| Oracle Primavera | 4.00 | 16 | “In house” project management tools | 3.91 | 11 | Critical chain method | 4.00 | 1 |
| Groupware (email only) | 3.94 | 18 | Voice over internet protocol (e.g. Skype) | 3.91 | 11 | Delphi method | 4.00 | 1 |
| Gantt bar charts | 3.93 | 27 | Project management software developed “in house” | 3.86 | 7 | Resource levelling | 4.00 | 1 |
| Risk assessment | 3.92 | 13 | Work breakdown structure | 3.86 | 7 | Other risk assessment tools and techniques | 3.75 | 4 |
| Progress meetings | 3.90 | 31 | Other project management tools | 3.83 | 6 | “What–if “scenario analysis – Cause and effect diagrams | 3.67 | 3 |
| Cash flow analysis | 3.90 | 20 | Microsoft Project | 3.75 | 8 | PMBOK® (Project Management Body of Knowledge) | 3.50 | 4 |
| “In house” communication and reporting system | 3.89 | 18 | Critical path method | 3.75 | 8 | SAP | 3.50 | 2 |
| Checklist analysis | 3.87 | 23 | Other information communication technology support tools | 3.73 | 11 | Monte Carlo simulation | 3.50 | 2 |
| Progress reports | 3.86 | 29 | Life cycle cost analysis | 3.71 | 7 | Reliability analysis | 3.50 | 2 |
| PM methodology developed “in house” | 3.74 | 19 | Video conferencing | 3.71 | 7 | Other project management software | 3.33 | 3 |
| Trend diagrams/S curves | 3.71 | 14 | Other project management methodologies | 3.70 | 10 | Probability and effect matrix | 3.33 | 3 |
| Project goals charter | 3.67 | 15 | Strengths, weaknesses, opportunities and threats analysis | 3.60 | 10 | ISO 21500:2012 – Guidance on project management | 3.00 | 3 |
| Project evaluation and review technique | 3.60 | 5 | Stakeholder analysis | 3.00 | 3 | |||
| Flow diagrams | 3.60 | 5 | Fault tree analysis | 3.00 | 2 | |||
| Probability analysis | 3.57 | 7 | Hazard and operability studies | 2.50 | 2 | |||
| “In house” decision-making techniques and tools | 3.56 | 9 | Hazard analysis | 2.50 | 2 | |||
| International Competence Baseline | 3.50 | 6 | Agile project management methodologies | 1.00 | 1 | |||
| Communities of practice enabling tools (professional forums, etc.) | 3.45 | 11 | ||||||
| Organizational break-down structure | 3.40 | 5 | ||||||
| Precedence diagram method | 3.33 | 9 | ||||||
| Risk register | 2.83 | 6 | ||||||