
Fig. 1
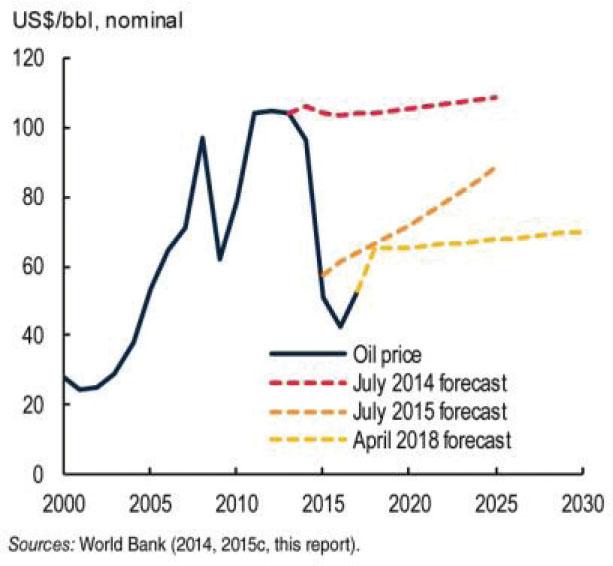
Fig. 2
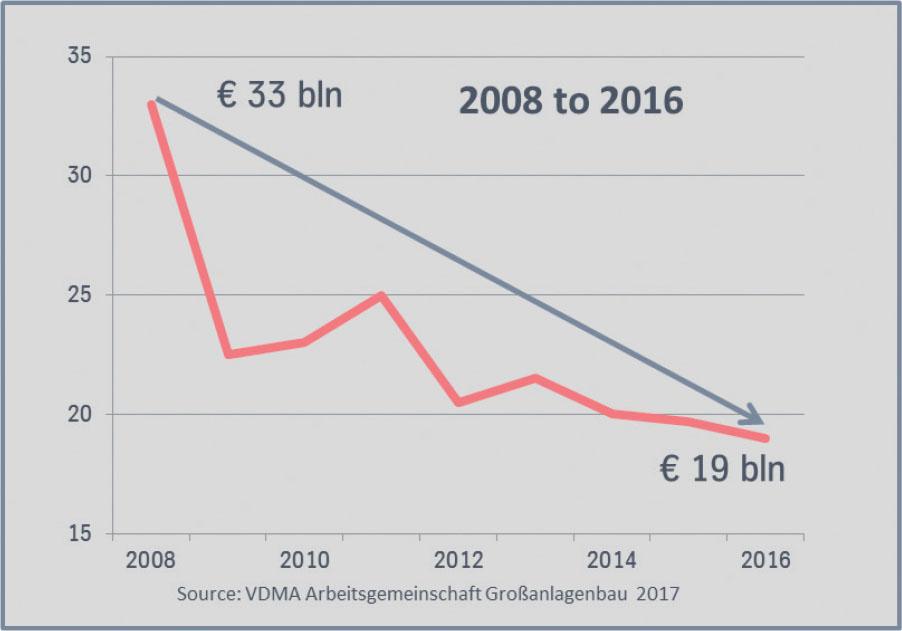
Fig. 3
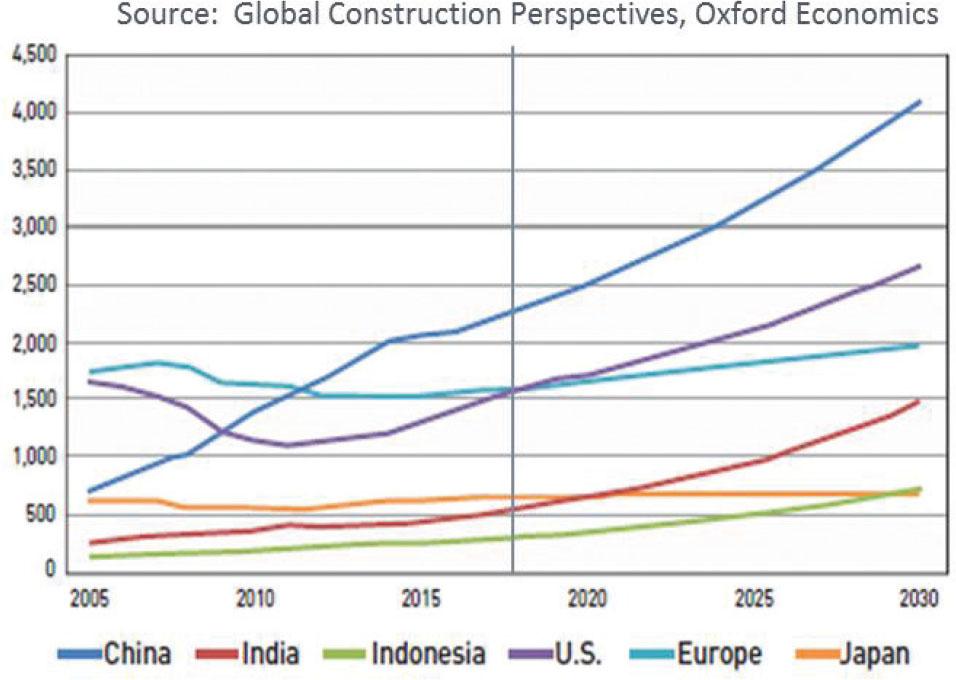
Fig. 4
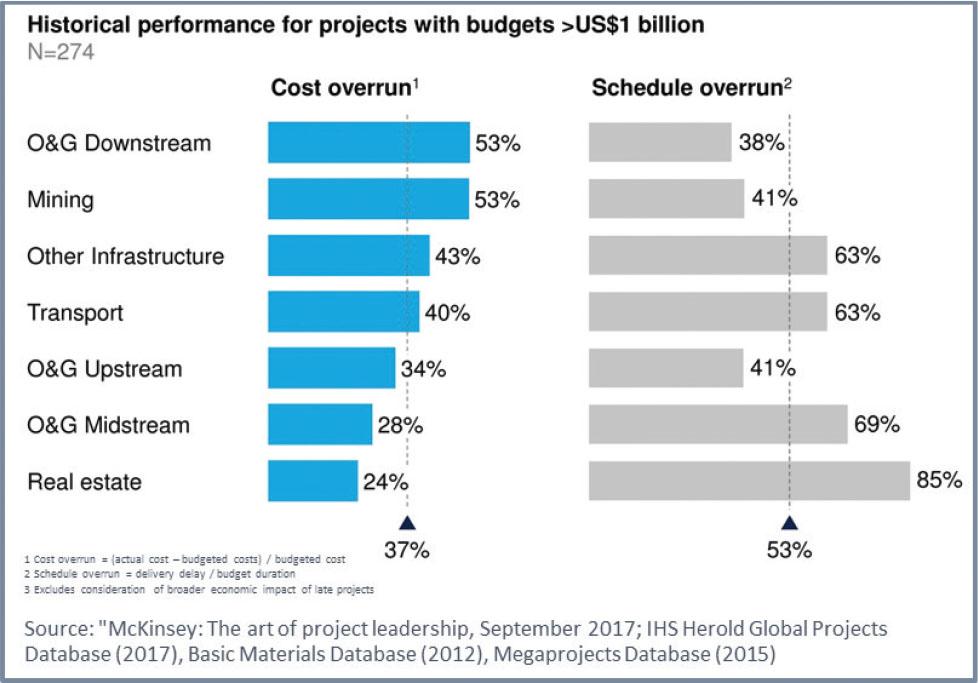
Fig. 5
Fig. 6
Example of the cost breakdown for an EPC project with potential savings
| Cost Element | Cost Breakdown before savings | Team integration | Productivity | Transaction costs | Schedule accel. | Total Savings | Cost Breakdown after savings |
|---|---|---|---|---|---|---|---|
| Owner | 13 | 50% | 30% | 20% | 72% | 4 | |
| Project Management | 6 | 50% | 30% | 20% | 72% | 2 | |
| Construction & Start-Up Management | 8 | 50% | 30% | 10% | 20% | 73% | 2 |
| Engineering | 14 | 30% | 10% | 20% | 44% | 8 | |
| Equipment | 21 | 30% | 37% | 13 | |||
| Bulk Materials | 11 | 10% | 10% | 10 | |||
| Construction Labor | 12 | 30% | 10% | 20% | 50% | 6 | |
| Other Construction Costs (e.g. site logist.) | 2 | 10% | 20% | 28% | 1 | ||
| Contingency | 6 | 50% | 50% | 3 | |||
| Special Costs (Legal, Travel etc) | 7 | 80% | 80% | 1 | |||
| 100 | 50 |