
Fig. 1
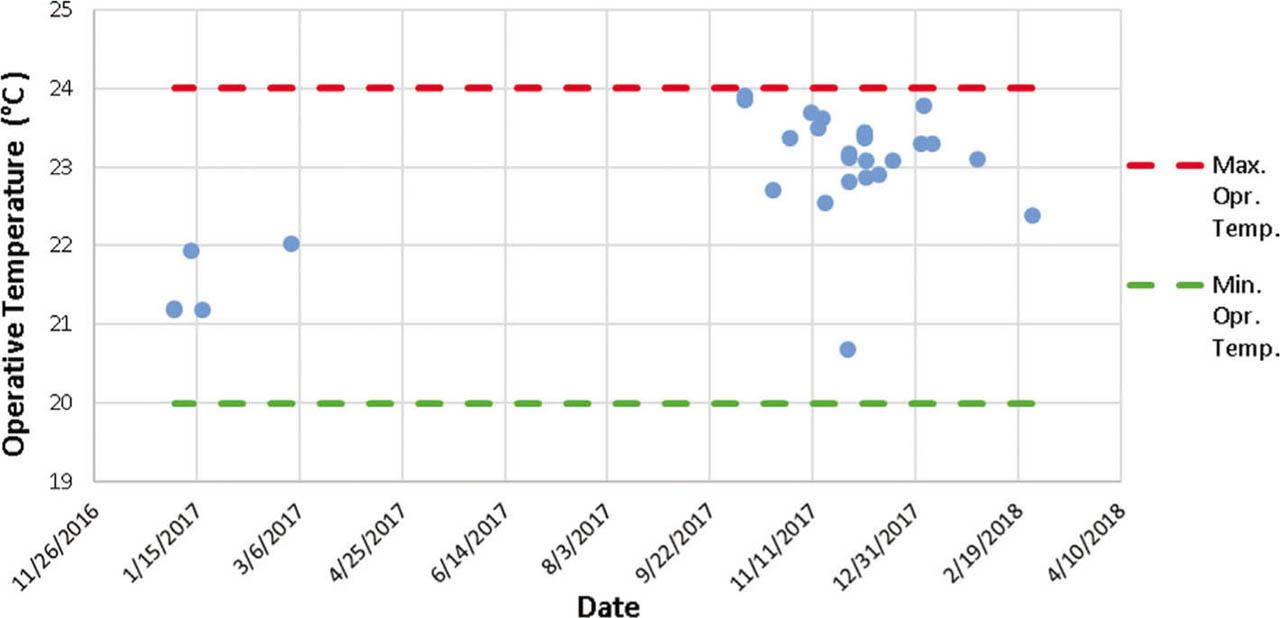
Fig. 2
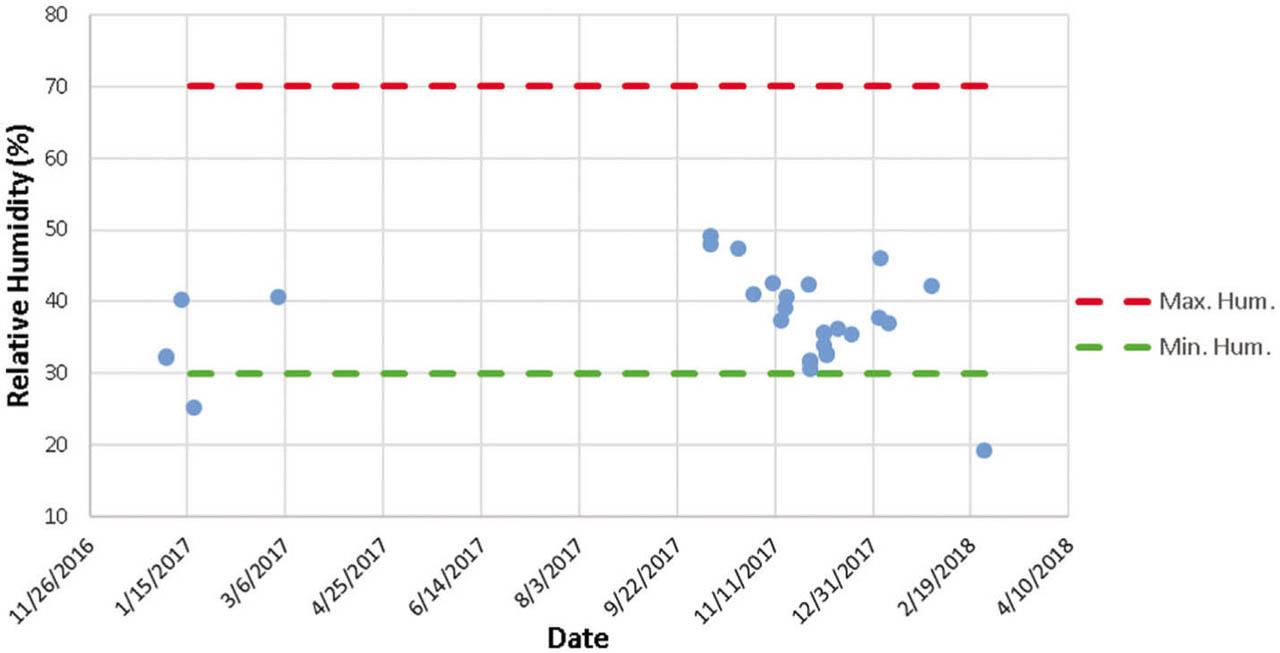
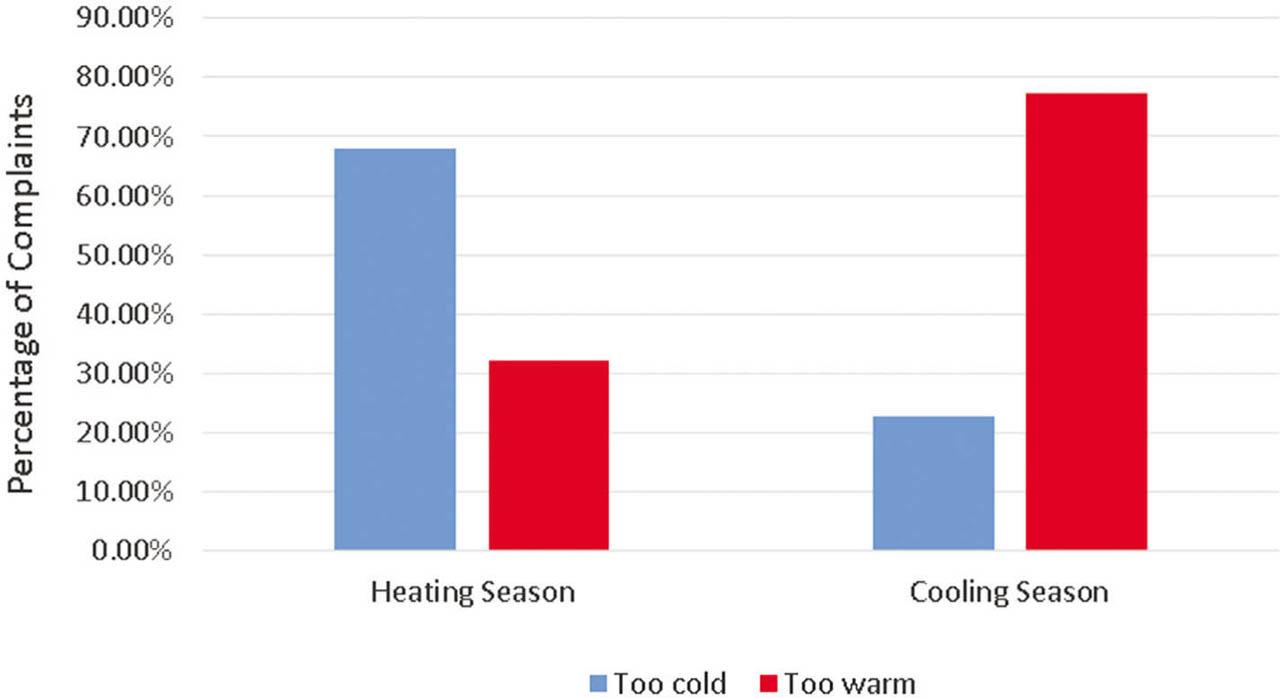
Fig. 3
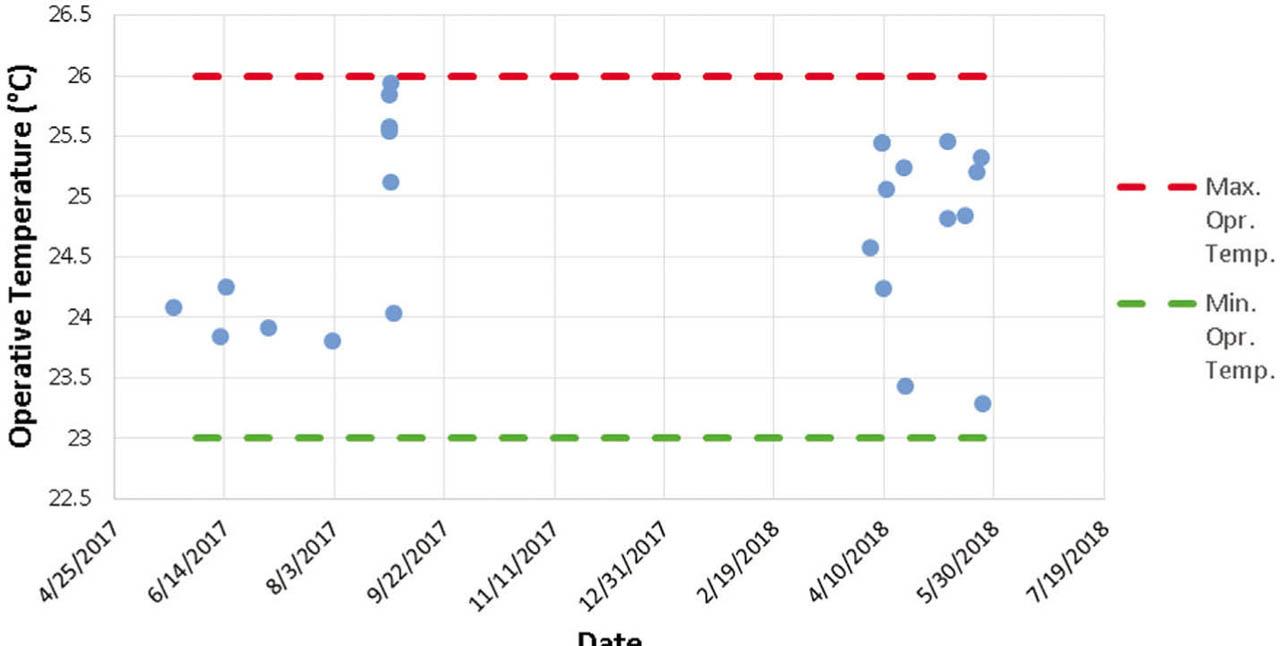
Fig. 4
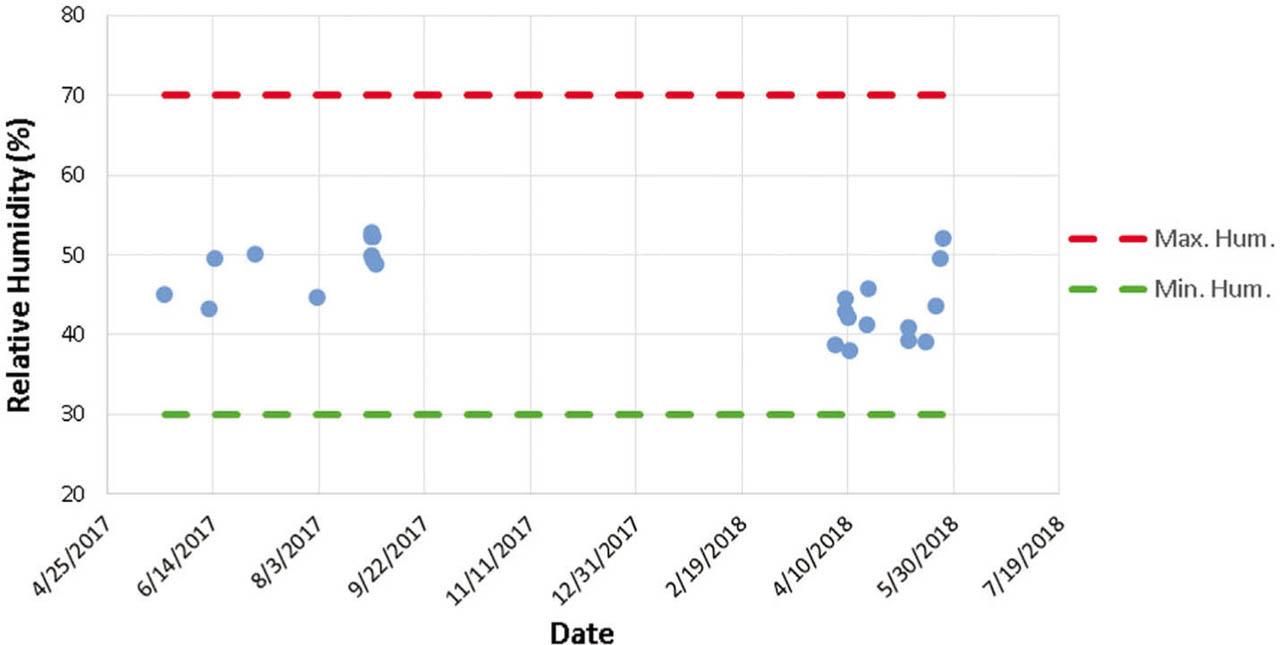
Fig. 5
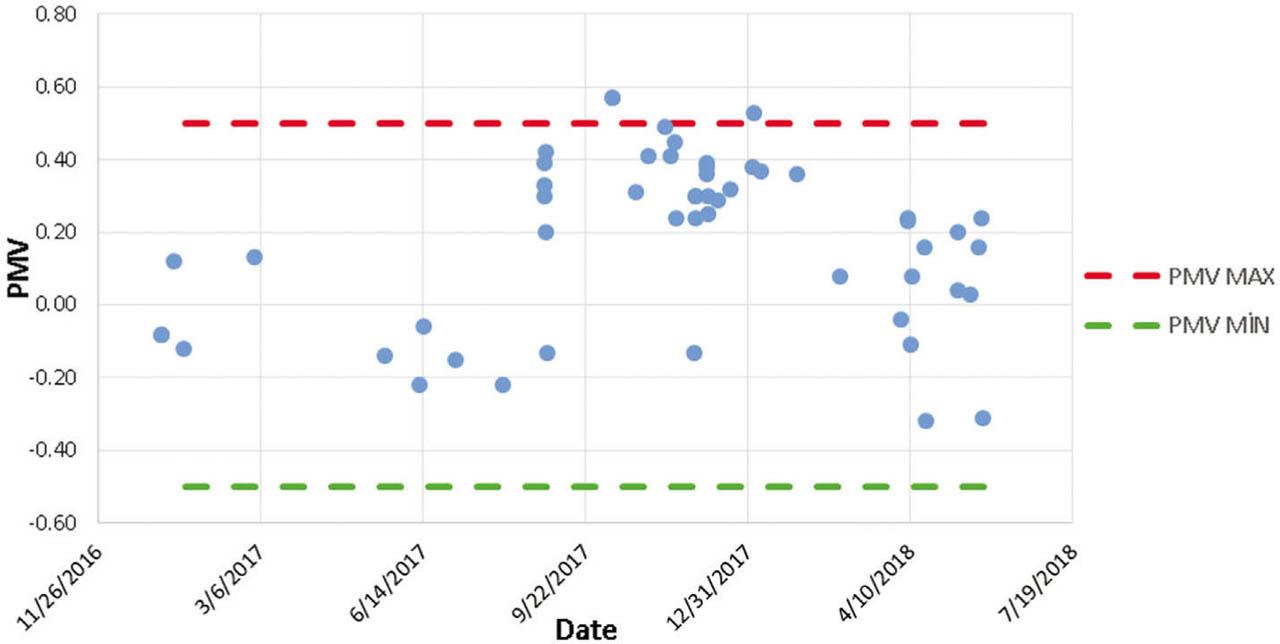
Fig. 6
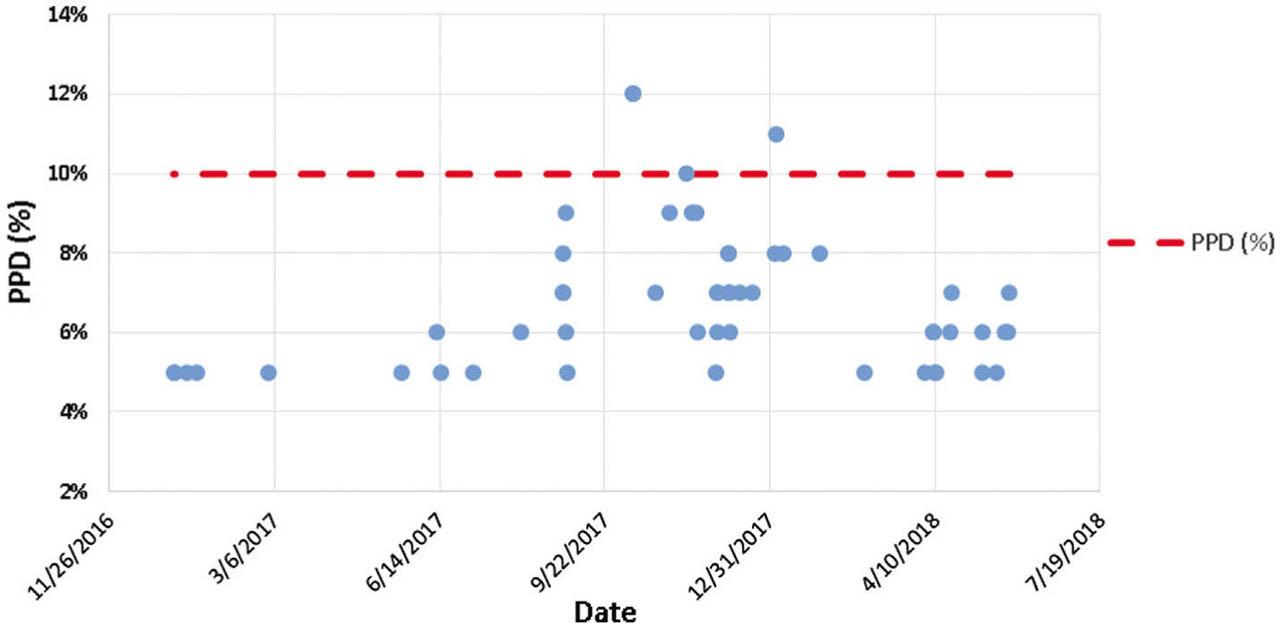
Fig. 7
Results of the first model
| Observed | Predicted | ||||
|---|---|---|---|---|---|
| Thermal complaint | Percentage corrected | ||||
| Too warm | Too cold | ||||
| Step 0 | Thermal complaint | Too warm | 28 | 0 | 100.0 |
| Too cold | 25 | 0 | 0.0 | ||
| Overall percentage | 52.8 | ||||
Omnibus tests of model coefficients
| Chi-squared test | df | p value | ||
|---|---|---|---|---|
| Step 1 | Step | 54.108 | 3 | 0.000 |
| Block | 54.108 | 3 | 0.000 | |
| Model | 54.108 | 3 | 0.000 | |
Statistics for numerical independent variable
| Operative temperature | Relative humidity | |
|---|---|---|
| N | 53 | 53 |
| Mean | 23.8383 | 41.0077 |
| Median | 23.7400 | 41.1000 |
| Mode | 23.20 | 19.32 |
| Standard Deviation | 1.27730 | 7.25820 |
Variables in the equation
| B | S.E. | Wald | df | p value | Exp (B) | 95% CI for Exp (B) | B | ||
|---|---|---|---|---|---|---|---|---|---|
| Lower | Upper | ||||||||
| Step 1 | Relative humidity | −0.299 | 0.190 | 2.469 | 1 | 0.116 | 0.741 | 0.511 | 1.077 |
| Operative temperature | −9.545 | 3.550 | 7.228 | 1 | 0.007 | 0.000 | 0.000 | 0.075 | |
| Season | −11.429 | 4.515 | 6.407 | 1 | 0.011 | 0.000 | 0.000 | 0.076 | |
| Constant | 245.670 | 91.760 | 7.168 | 1 | 0.007 | 4.933E + 106 | |||
Model summary
| Step | −2 Log likelihood | Cox & Snell R2 | Nagelkerke R2 |
|---|---|---|---|
| 1 | 19.196 | 0.640 | 0.854 |
Dependent variable encoding
| Original value | Internal value |
|---|---|
| Too warm | 0 |
| Too cold | 1 |
Categorical variables codings
| Frequency | Parameter coding | ||
|---|---|---|---|
| –1 | |||
| Season | Heating | 29 | 1.000 |
| Cooling | 24 | 0.000 |
Operating principles of DRV
| Ambient T (°C) | Start-up (a.m.)—programmable | |
|---|---|---|
| Heating mode | <16 | 05:00 |
| 16–18 | 06:00 | |
| 18–20 | 07:00 | |
| ≥20 | 08:00 | |
| Cooling mode | ≤26 | 08:00 |
| 26–27 | 07:00 | |
| 27–28 | 06:00 | |
| >28 | 05:00 | |
Results of the second model
| Predicted complaint | Percentage corrected | ||||
|---|---|---|---|---|---|
| Too warm | Too cold | ||||
| Step 1 | Thermal complaint | Too warm | 26 | 2 | 92.9 |
| Too cold | 3 | 22 | 88.0 | ||
| Overall percentage | 90.6 | ||||