
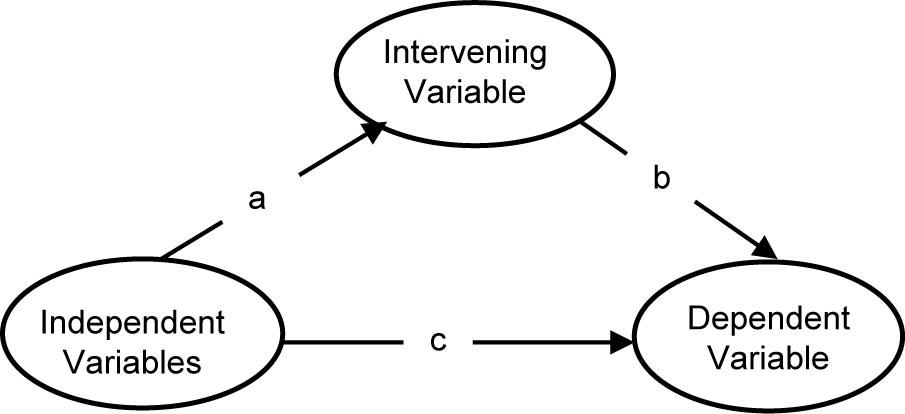
Fig. 1
Extent to which leaderships skills are applied in steering fibre-optic infrastructure
| Score | Frequency | Percentage |
|---|---|---|
| 2.00 | 4 | 2.3 |
| 3.00 | 8 | 4.7 |
| 4.00 | 4 | 2.3 |
| 5.00 | 14 | 8.1 |
| 6.00 | 18 | 10.5 |
| 7.00 | 34 | 19.8 |
| 8.00 | 48 | 27.9 |
| 9.00 | 22 | 12.8 |
| 10.00 | 20 | 11.6 |
| Total | 172 | 100.0 |
Descriptive analysis of government policy from visual analogue scale data
| Score | Frequency | Percentage |
|---|---|---|
| 2.00 | 2 | 1.2 |
| 3.00 | 10 | 5.8 |
| 4.00 | 4 | 2.3 |
| 5.00 | 24 | 14.0 |
| 6.00 | 20 | 11.6 |
| 7.00 | 36 | 20.9 |
| 8.00 | 44 | 25.6 |
| 9.00 | 26 | 15.1 |
| 10.00 | 6 | 3.5 |
| Total | 172 | 100.0 |
Model with dependent variable regressed on independent variables (path c)
| Source | SS | df | MS | Number of observations | 172 |
|---|---|---|---|---|---|
| Model | 273.277533 | 1 | 273.277533 | F(1,170) | 162.6 |
| Residual | 285.722467 | 170 | 1.6807204 | Prob > F | 0.000 |
| Total | 559 | 171 | 3.26900585 | R2 | 0.4889 |
| Adjusted R2 | 0.4859 | ||||
| Root MSE | 1.2964 | ||||
Performance of companies in execution of fibre-optic infrastructure
| Score | Frequency | Percentage |
|---|---|---|
| 2.00 | 2 | 1.2 |
| 3.00 | 4 | 2.3 |
| 4.00 | 6 | 3.5 |
| 5.00 | 10 | 5.8 |
| 6.00 | 24 | 14.0 |
| 7.00 | 30 | 17.4 |
| 8.00 | 38 | 22.1 |
| 9.00 | 38 | 22.1 |
| 10.00 | 20 | 11.6 |
| Total | 172 | 100.0 |
Descriptive analysis of government policy from Likert scale data
| Statements | 1 | 2 | 3 | 4 | 5 | Mean | Standard deviation |
|---|---|---|---|---|---|---|---|
| Government of Kenya has implemented policy on fibre-optic infrastructure | 8.1 | 15.1 | 27.9 | 31.4 | 17.4 | 3.348 | 1.172 |
| The government implements a dig once policy in conjunction with laying new roads and widening some | 16.3 | 19.8 | 30.2 | 27.9 | 5.8 | 2.872 | 1.162 |
| There is a uniform right of way policy for fibre-optic and other infrastructures | 11.6 | 26.7 | 26.7 | 24.4 | 10.5 | 2.953 | 1.183 |
| Significant delays in execution of fibre-optic infrastructure as a result of delays in obtaining permits | 2.3 | 5.8 | 12.8 | 24.4 | 54.7 | 4.232 | 1.033 |
| Lack of coordination among multiple authorities in issuance of permits is a reason for significant delays | 2.3 | 5.8 | 12.8 | 24.4 | 54.7 | 4.232 | 1.033 |
| Introduction of utility corridors will prevent repeated digging which interfere with other underground infrastructure | 2.3 | 1.2 | 7.0 | 30.2 | 59.3 | 4.430 | 0.858 |
| Regulations by the government on fibre-optic infrastructure are not fair and should be revised | 5.8 | 4.7 | 36.0 | 22.1 | 31.4 | 3.686 | 1.136 |
| More regulations should be put in place to check on how fibre-optic infrastructure is implemented | 1.2 | 4.7 | 7.0 | 38.4 | 48.8 | 4.290 | 0.876 |
| Global standards are adopted and customised in implementation of fibre-optic infrastructure | 3.5 | 15.1 | 25.6 | 30.2 | 25.6 | 3.593 | 1.127 |
| Building code should be revised to allow for fibre-optic services in new buildings | 0.0 | 3.5 | 4.7 | 29.1 | 62.8 | 4.511 | 0.745 |
| Average | 3.8147 | 1.0325 |
Performance of companies in stakeholder management
| Score | Frequency | Percentage |
|---|---|---|
| 2.00 | 6 | 3.5 |
| 3.00 | 4 | 2.3 |
| 4.00 | 4 | 2.3 |
| 5.00 | 28 | 16.3 |
| 6.00 | 30 | 17.4 |
| 7.00 | 12 | 7.0 |
| 8.00 | 38 | 22.1 |
| 9.00 | 30 | 17.4 |
| 10.00 | 20 | 11.6 |
| Total | 172 | 100.0 |
Model for the relationship between independent variables and intervening variable
| Source | SS | df | MS | Number of observations | 172 |
|---|---|---|---|---|---|
| Model | 192.889365 | 1 | 192.889365 | F(1,170) | 88.72 |
| Residual | 369.622263 | 170 | 2.17424861 | Prob > F | 0.000 |
| Total | 562.511628 | 171 | 3.28954168 | R2 | 0.3429 |
| Adjusted R2 | 0.3390 | ||||
| Root MSE | 1.4745 | ||||
Model with dependent variable regressed on intervening variable and independent variables – paths b and c
| Source | SS | df | MS | Number of observations | 172 |
|---|---|---|---|---|---|
| Model | 337.78105 | 1 | 168.890525 | F(1,170) | 129.02 |
| Residual | 221.21895 | 170 | 1.30898787 | Prob > F | 0.000 |
| Total | 559 | 171 | 3.26900585 | R2 | 0.6043 |
| Adjusted R2 | 0.5996 | ||||
| Root MSE | 1.1441 | ||||