
1. INTRODUCTION
Wetland ecosystems around the world are dynamic in their physical and chemical conditions, and aquatic invasive species are a global environmental challenge with serious ecological and socioeconomic impacts that affect the service productivity and functionality of the ecosystem [Dersseh et al. 2020; Goshu and Aynalem 2017]. Water hyacinth (Eichhornia crassipes), one of the dangerous invasive aquatic weeds, is native to the Amazon Basin and has spread to more than 80 countries over the past century [Jafari 2010], including African countries like Zimbabwe, South Africa, and Ethiopia [Bhattacharya et al. 2015].
In Ethiopia, water hyacinth was observed and reported for the first time in 1965 in Lake Koka and the Awash River, and from there it started to spread to other nearby water bodies [Dersseh, Kibret et al. 2019]. Due to its massive invasion, water hyacinth has become a socioeconomic and environmental challenge across the world. Fishing and associated businesses are a way of life for many people living around a lake. According to Enyew, about 2,905 people were engaged in commercial fishing in 21 infested kebeles in nearby Lake Tana [Enyew et al. 2020]. But the study indicated that the invasion of lakeshores, river mouths, and wetlands by water hyacinth has aggravated the deterioration of fish populations of Lake Tana, and fish resources of the lake are severely declining. In Ethiopia, fishing is turning into a painful profession due to the weed's severe economic consequences. As stated by Yirefu, in Ethiopia, the economic impact of water hyacinth in the invaded areas was estimated at about USD 100,000 between 2000 and 2013 for controlling and removing the weed [Yirefu et al. 2017].
Although the presence of water hyacinth in the catchment of Lake Abaya was recognized in 1990 [Firehun et al. 2014], no one took steps to investigate the rate of its invasive dynamics and its impact on the livelihoods of local communities. Since it is a recent phenomenon in Ethiopia, there are very few local studies regarding water hyacinth, which makes it difficult to obtain a better understanding of its cause, impact and expansion with the best management practices [Dersseh, Melesse et al. 2019]. To ensure the essential ecological and socioeconomical sustainability of the Lake Abaya catchment, investigating and analysing the invasion dynamic of water hyacinth is a critical step towards proper planning for interventions and controlling mechanisms. Therefore, the spatiotemporal dynamics and associated socioeconomic challenges of water hyacinth is investigated and possible mitigation measures are presented for early stages before the lake and the associated socioeconomic benefits of the lake become endangered.
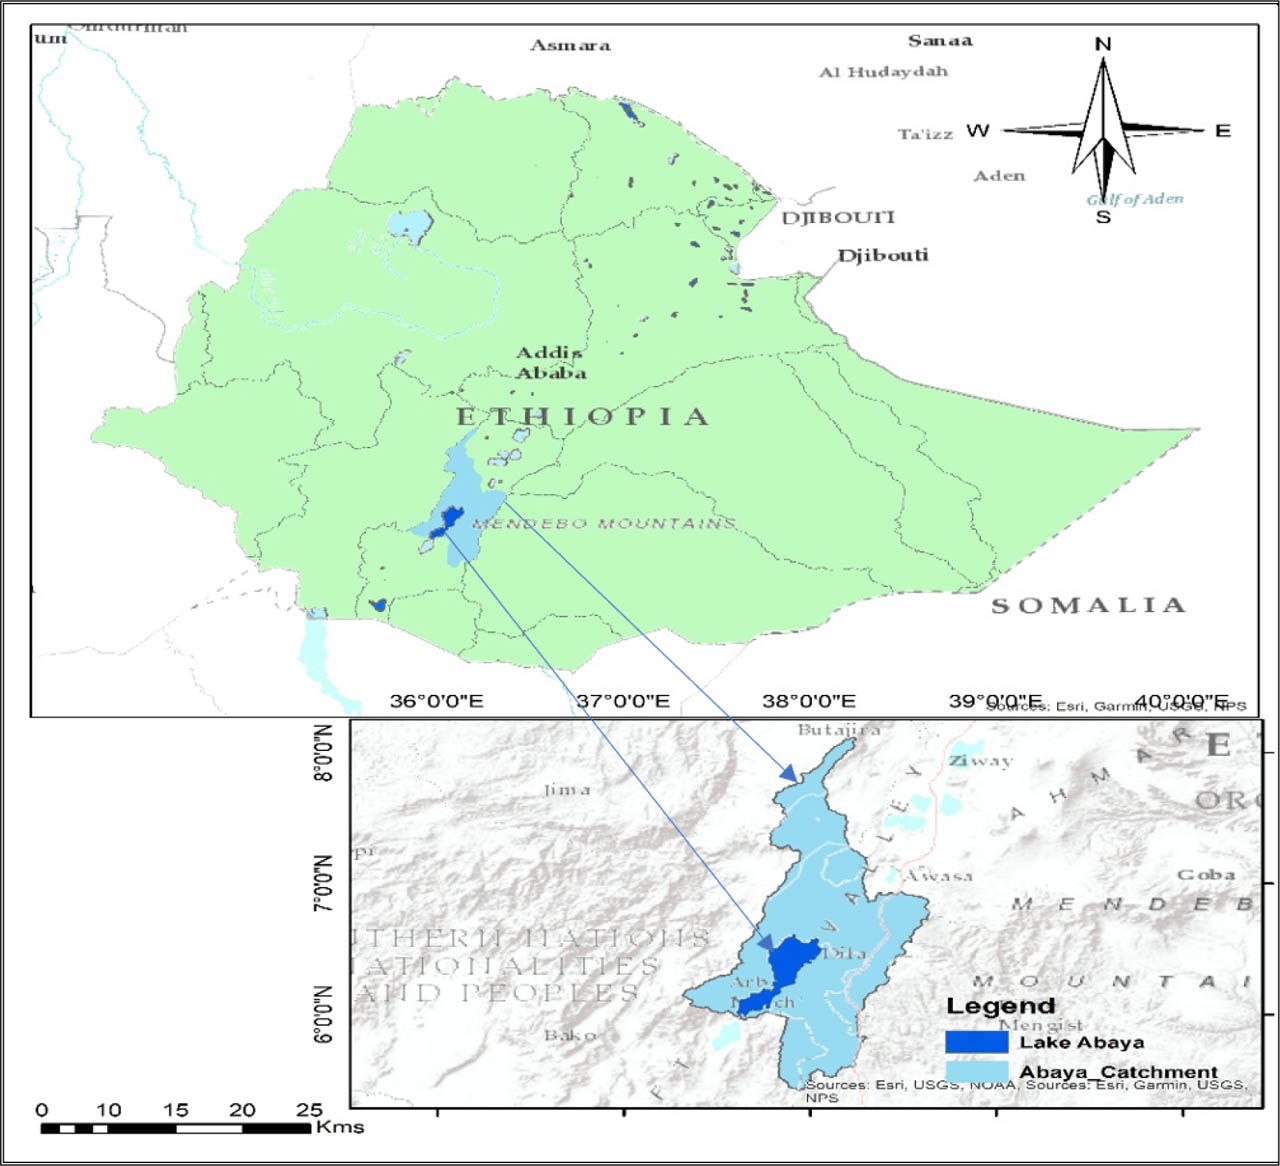
Figure 1.
Location of the study area
2. MATERIALS AND METHODS
2.1. Study area description
The study area, the catchment of Lake Abaya, is one of the lakes in the Ethiopian Rift Valley Basin. After Lake Tana, Lake Abaya is the second largest lake in Ethiopia. Geographically, the lake is located between 5° 55′ 9″ −6° 35 ′30″ N latitude and 37° 36′ 90″ −38° 03 ′ 45″ E longitude. The catchment has a total area of 1,625,691.73 ha [Bekele et al. 2007]. Lake Abaya has a maximum length of 79.2 km and its maximum width is 27.1 km. The mean and the maximum depth of the lake are 8.6 m and 24.5 m respectively. It is located at an average altitude of 1,235 meters above sea level [Bekele et al. 2007]. Based on ten years of climate data (2001–2010), the catchment experiences a bimodal rainfall pattern and has an average annual temperature of 22.9°C with an average rainfall of 768 mm. The rainy season of the study area ranges from March to November with mean minimum monthly rainfall in January and maximum in May. Hot and dry season is prominent from December to February. The mean minimum daily temperature of the coldest month and the mean maximum temperature of the warmest months are 15.0°C and 32°C, respectively [Mengistu et al. 2017].
2.2. Data types and sources
Effective water hyacinth management requires mapping and close monitoring of its spatiotemporal dynamics using both spatial and non-spatial data [Jawed et al. 2021]. For a large lake, the traditional method of tracking water hyacinth invasion dynamics using a Global Positioning System (GPS) device requires ongoing funding, infrastructure, and field operations, making it logistically and financially costly [Dersseh, Ateka et al. 2019]. Satellite imagery offers an excellent alternative for monitoring, modelling, and analysing these changes. This is particularly true in developing nations, where remote sensing compensates for the scarcity of up-to-date geographic data [Burke et al. 2021]. Consequently, utilizing high-spatial-resolution satellite data together with QGIS tools has become a highly practical and economically feasible approach for monitoring invasion dynamics and mapping the geographic distribution of water hyacinth within the lake catchment. In this regard, because of its ability to provide reliable information, 10-meter spatial resolution Sentinel-2A satellite imagery was used to monitor the spatiotemporal dynamics of invasive water hyacinth in the study area. Based on local environmental conditions, imagery from the post-rainy season (November–December) was preferred. Collecting data during these months yields cloud-free satellite images and minimizes seasonal variation effects on land use/land cover (LULC) classification. Furthermore, this specific season corresponds with the peak growth and maximum areal coverage of the water hyacinth.
Following the acquisition of satellite imagery, image preprocessing and post-processing were conducted using QGIS 3.16. Post-classification analysis was then performed to quantify the dynamic spread of the invasive water hyacinth. Prior to classification, the land use (LU) classes of the study area were identified and defined to streamline the classification process. The land use/land cover (LULC) classes applied in this study were adapted from the classification scheme of the African LULC Database for Sustainable Development, which is widely utilized across East African countries [Charvát et al. 2022]. To align with the specific environmental diversity of the study area, the descriptions of these classes were slightly modified. Consequently, six major LU classes were identified and defined: water body, water hyacinth, settlement, farmland, vegetation, and shrubland (Table 2).
Table 1.
Source of Sentinel 2A satellite image used for the study
| S/No | SensorTypes | Pass/row | Resolution | Date of Acquisition | Sources |
|---|---|---|---|---|---|
| 1 | Sentinel 2A | 169/56, 169/55 | 10m | November 16/2017 | https://earthexplorer.usgs.gov |
| 2 | Sentinel 2A | 169/56, 169/55 | 10m | November 10/2018 | |
| 3 | Sentinel 2A | 169/56, 169/55 | 10m | December 20/2019 | |
| 4 | Sentinel 2A | 169/56, 169/55 | 10m | November 25/2020 | |
| 5 | Sentinel 2A | 169/56, 169/55 | 10m | December 15/2021 | |
| 6 | Sentinel 2A | 169/56, 169/55 | 10m | December 24/2022 | |
| 7 | Sentinel 2A | 169/56, 169/55 | 10m | November 24/2023 |
Table 2.
Contextual description of the LULC classes of the Abaya Lake wetland
| No | LULC types | Description |
|---|---|---|
| 1 | Water hyacinth | All floating vegetation appears denser green than the other vegetation land covers in and near the lake shoreline. |
| 2 | Water body | Consists of both turbid and clear water of the lake and other water bodies in and nearby the lake. |
| 3 | Settlement | Consists of homesteads of rural villages and buildings of urban areas (with commercial land residential purposes), camps, warehouses, roads and other infrastructures. |
| 4 | Farmland | Farmland used for growing cereals, tuber and root crops, agro-forestry practice and horticulture including currently uncultivated (arable) land and fallowed plots. |
| 5 | Vegetation | Areas of dense, tall trees with interlocked canopies, including woodland and riverine forests. |
| 6 | Shrubland | Area covered by sparse vegetation, short, hard woody stem trees (bushes), limited herbaceous plants (shrubs) and isolated trees, which often are mixed with an undergrowth of grasses. |
[i] Sources: Charvát et al. 2022; Zekarias et al. 2021, with some modification by the researchers
2.3. Image pre-processing and classification
Image classification is an art of assigning pixels within an image to distinct land cover classes [Zerrouki and Bouchaffra 2014]. In this study, a supervised image classification algorithm was used to cluster pixels in the dataset into user-defined training classes. This classification approach requires selecting representative training areas to serve as the basis for classification, using the Maximum Likelihood Classifier (MLC).
2.3.1. Accuracy assessment
Accuracy assessment is a process of validating the classified images by comparing a thematic map against reference data, which typically expresses the degree of “correctness” of remote sensing classification approaches [Chughtai et al. 2021]. A derived thematic map may be considered accurate if it provides a balanced and truthful representation of the study area's land cover. Hence, an accuracy assessment evaluates the degree to which a derived classification map aligns with ground reality. Before using derived land use/land cover (LULC) maps for subsequent analysis, errors must be quantified and evaluated against an established accuracy threshold using reference data [Stehman and Foody 2019].
The reference data used for accuracy assessment are usually obtained from aerial photographs, high spatial resolution satellite images, and Google Earth [Islami et al. 2022; Rwanga and Ndambuki 2017]. Leveraging prior knowledge of the study area, this study used Google Earth and ground control points (GCPs) collected via a Garmin GPS 72 as reference data sources. To determine the threshold value yielding the highest classification accuracy, various standard threshold levels were applied to both the lower and higher tails of each distribution.
Empirical studies, such as Anderson [1976], suggest that a minimum accuracy value of 85% is required for effective and consistent land cover change investigation and modelling. However, other authors [Bedru 2006; Zewdie and Kindu 2011] argue that the expected accuracy threshold is ultimately determined by the end-users, depending on the map product's intended use. This indicates that accuracy thresholds vary based on the map's objective. Based upon the purpose of the derived map for their use, different people may use different accuracy thresholds. Consequently, the accuracy of the classified images in this study was evaluated using standard metrics: overall accuracy, producer's accuracy, user's accuracy, and the kappa coefficient [Lu and Weng 2007].
a). Overall accuracy
Overall accuracy is computed by dividing the total correct number of pixels (i.e., summation of the diagonal) to the total number of pixels in the matrix (grand total). Mathematically, it can be expressed by Xii and N as:
Where Xii = number of correctly classified pixels, or the diagonal value and
N = entire number of pixels in the matrix.
b). Producer's accuracy
Producer's accuracy, which solely provides the percentage of correctly categorized pixels, is the likelihood that a reference pixel would be correctly identified.
Producer's accuracy is sometimes referred to as omission error. It is calculated by dividing the total number of pixels in the category in the reference data by the number of correctly categorized pixels in the category.
c). User's accuracy
As stated by Congalton [1991], user's accuracy indicates the probability that the pixels in the classified map or image represent the class on the ground. It is found by dividing the total number of correctly classified pixels in the category by the total number of pixels in the classified data.
d). Kappa coefficient
The classification precision may also be quantified using the kappa coefficient, a measure of agreement. In comparison to the error of a purely random classification, it expresses the proportionate decrease in error brought about by a classification technique.
The agreement that remains after subtracting the percentage of agreement that could be predicted to happen by chance is represented by the kappa statistic, which also takes into account the off-diagonal components of the error matrices, or classification errors. The kappa coefficient (K) is calculated using the information in the Table 2 and the following formula given by Congalton [1991].
Where TS = total sample or total number of reference pixels and TCS = total corrected sample or total number of correctly classified pixels.
2.4. Detecting the historical land use/land cover change of the study (change detection)
Change detection refers to the process of documenting the physical changes that have occurred over a period of time by comparing two or more data sets of remotely sensed satellite images [Ghaderpour and Vujadinovic 2020].
In this research work, change detection was calculated to determine how water hyacinth invasion has blowout in the Lake Abaya catchment over a certain period (2017–2023).
To analyse the patterns of water hyacinth invasion, a post-classification comparison approach was undertaken that provides the detailed both change, no change as well as ‘from-to’ information [Lu et al. 2004].
The result of change detection may be positive or negative, where positive values suggest an increasing trend and negative values imply a decreasing trend in a given land use type.
Therefore, data of Sentinel satellite images for seven consecutive years (2017–2023) were first independently classified. Then changes in the LULC, magnitude of change, annual rate of change, and a change matrix were produced by comparing the independently categorized images. This analysis not only explores changes that occurred in the study area but also identifies their nature and determines their spatial extent and pattern. The magnitude of change and annual rate of change for each LULC class during the period were computed based on the following equation:
Where M is magnitude of area changed of LULC class in period, A1 is area (ha) of LULC in the initial or earlier year, and A2 is area (ha) of the same LULC class in the recent year.
We have also calculated the rate of change of LULC changes between years to estimate the spatial changes in land uses with the following equation:
Where R is annual rate of area change (in ha and %), A1 is area (ha) of a LULC class in the initial year, A2 is area (ha) of the LULC class in the recent year, and t is the time interval between the initial and recent years.
3. RESULTS AND DISCUSSION
3.1. Quantifying water hyacinth spatiotemporal invasion dynamics
To quantify the invasive dynamics of water hyacinth in the study area, we utilized Sentinel-2A satellite imagery with a 10 m spatial resolution across seven consecutive years (2017–2023). Sentinel-2A satellite imagery is from a pair of multispectral satellites launched by the European Space Agency in June 2015 with a five-day revisit time and a 290 km swath width, providing a robust time series of data. These images are open-access and freely available online [Singh et al. 2020; Zeng et al. 2017].
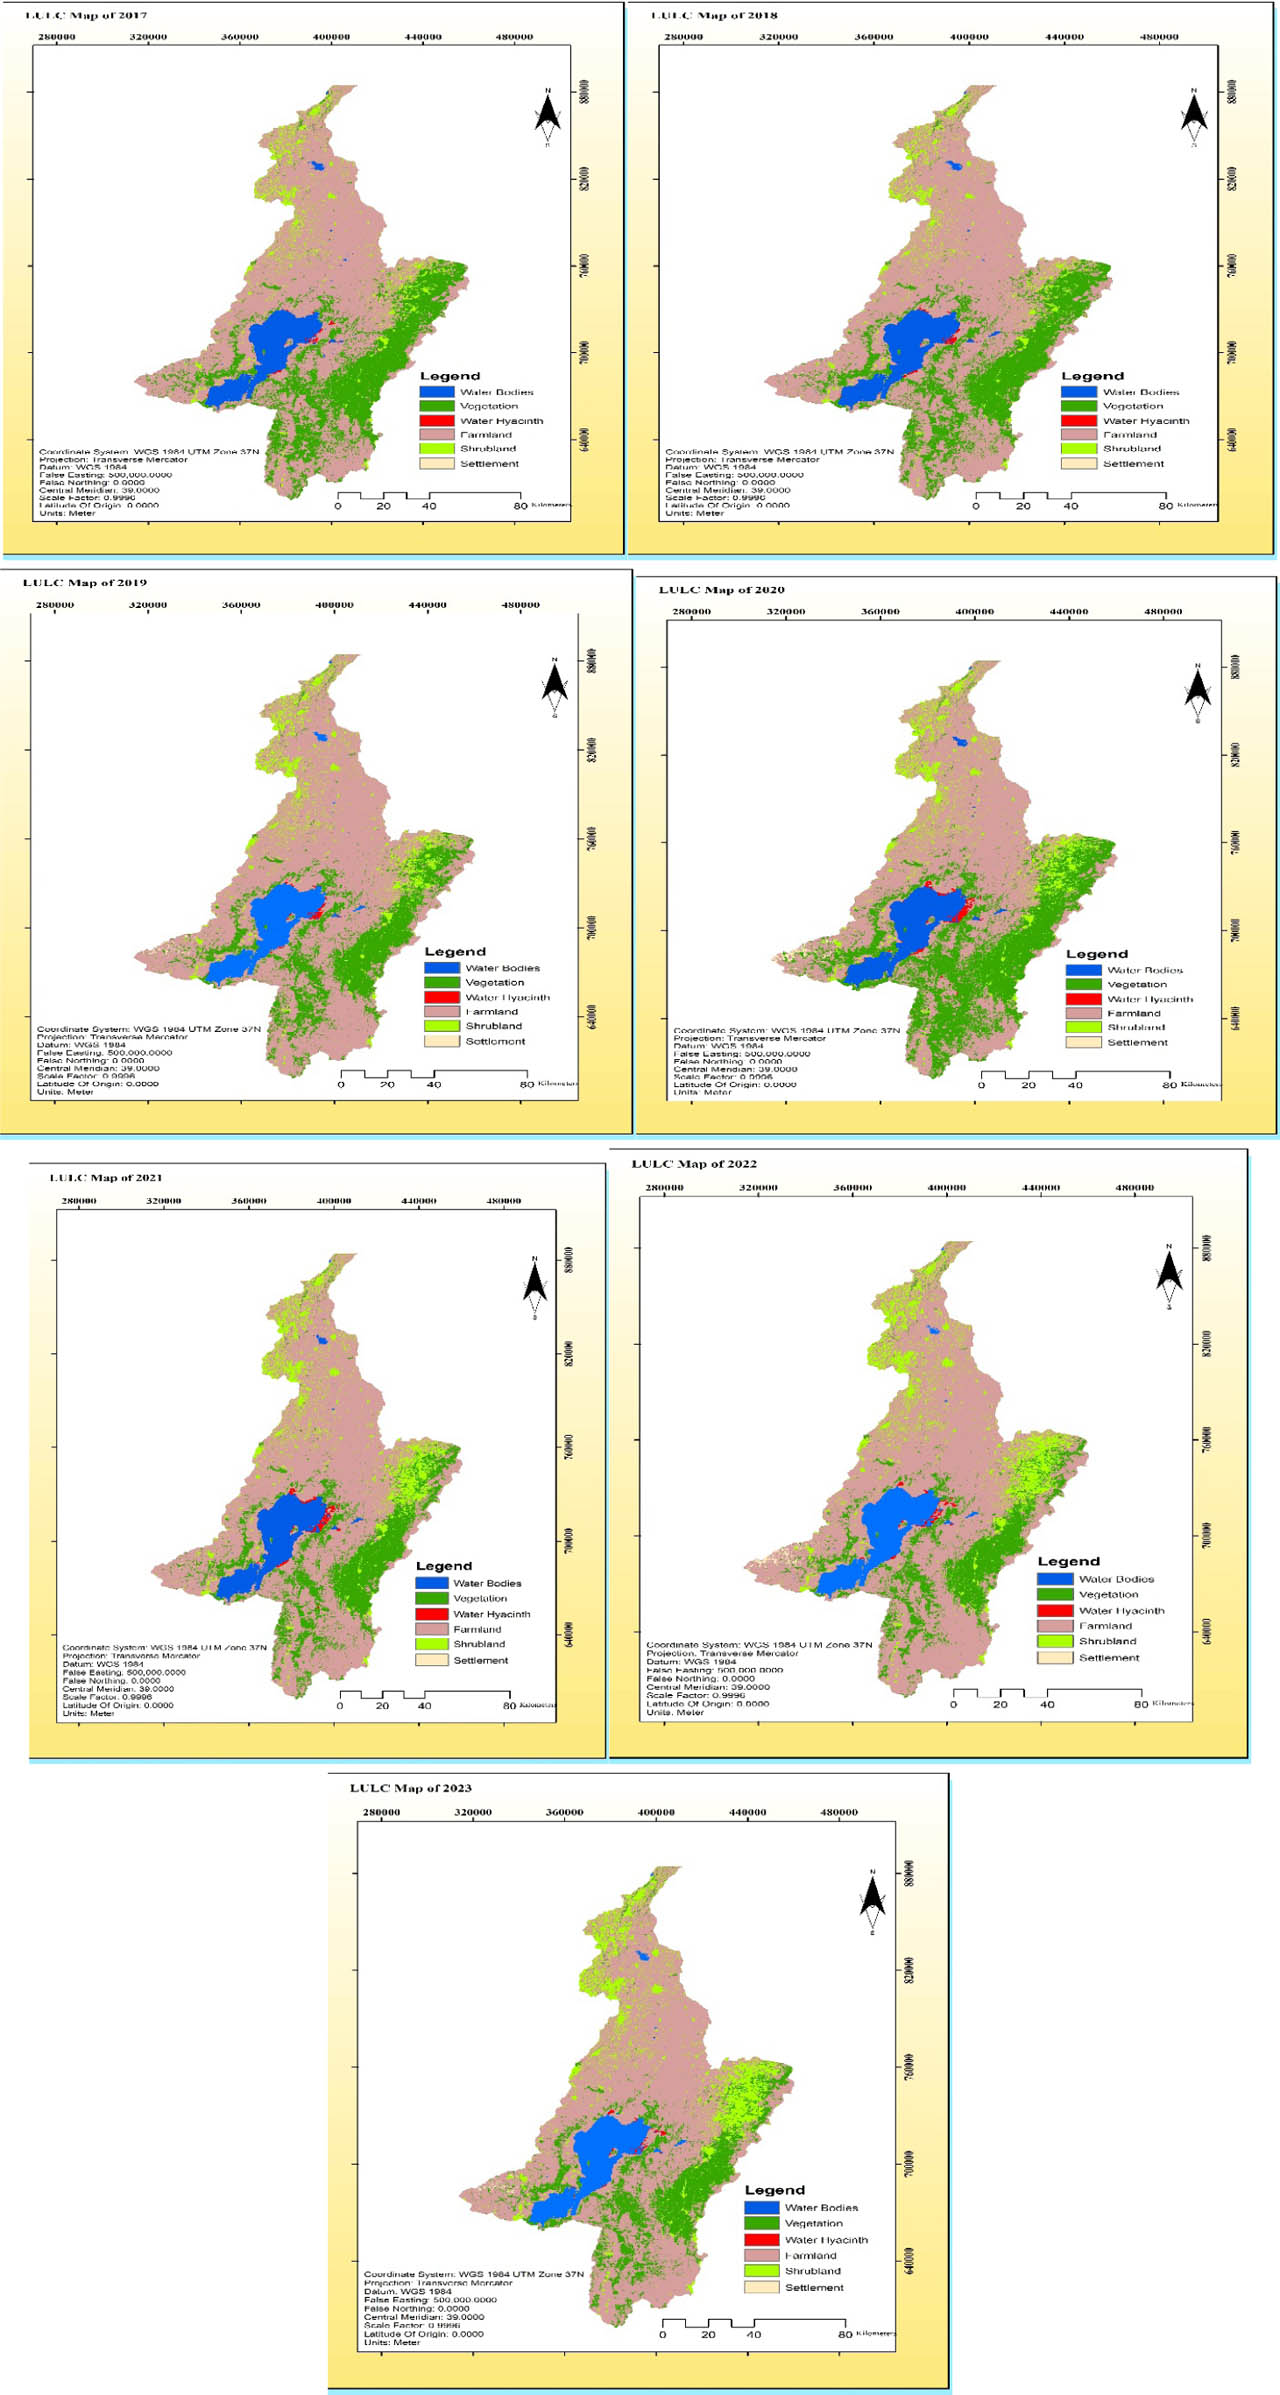
Figure 2.
LULC maps of the study area, 2017–2023
From Table 3, the annual areal coverage of water hyacinth indicates a continuously increasing trend in the first four years and slightly decreasing trend in the last three of the study years. The decreasing trend in the last three study years is due to an effective control mechanism through community awareness and intervention. Accordingly, the areal coverage extended by 879.53 ha (0.05%), 996.75 ha (0.06%), 1552.75 ha (0.10%) and 1796.51ha (0.11%) respectively in the first four study years whereas it only increased by 1396.91ha (0.09%), 1305.87 ha (0.08%) and 1096.78 ha (0.07%) in the last three years of study respectively. Similarly, farmland and settlement area expanded by 1,022,032.058 ha (62.87%) and 35,840.468 ha (2.20%) in 2017, 1,022,919.158 ha (62.92%) and 47,804.46 ha (2.94%) in 2018, 1,040,971.242 ha (64.03%) and 61,224.972 ha (3.77%) in 2019, 1,055,316.482 ha (64.91%) and 62,634.00 ha (3.85%) in 2020, 1,065,536.85 ha (65.54%) and 70,774.56 ha (4.35%) in 2021, 1,070,181.592 ha (65.83%) and 74,406.262 ha (4.58%) in 2022, and 1,075,138.286 ha (66.13%) and 79,954.396 ha (4.92%) in 2023 respectively, revealing a consistently increasing trend in the study years. However, across the study years of 2017 to 2023, vegetation and shrubland in the study area indicated no clear trends in patterns of change. The expansion of commercial farms such as banana, cotton, fruit and vegetable, and the redistribution of land to landless farmers and military veterans were also causes of reduction of vegetation and shrubland in the catchment. The western part of the catchment was extensively used for big public farms (Arba Minch, Wajifo and Silte) and recently leased for private investors. Lack of a buffer zone around the lake is also considered as a reason why farming activities are expanding within the catchment without any intervention by concerned bodies. The results illustrate a continuously increasing trend during the study periods in the settlement area in the western coast of the Abaya Lake wetland due to population increase through natural means and migration from other areas because of factors like malaria. Contrary to this, water body area coverage in the Lake Abaya catchment followed a continuously decreasing trend within the study period. Accordingly, the study results indicate that water bodies changed by 139,455.058 ha (8.58%), 129,372.608 ha (7.96%), 120,017.24 ha (7.38%), 119,713.09 ha (7.36%), 118,005.476 ha (7.26%), 117,086.142 ha (7.20%), and 116,094.916 ha (7.14%) in 2017, 2018, 2019, 2020, 2021, 2022 and 2023 respectively.
Table 3.
Land use and land cover change of 7 consecutive years (2017–2023)
| S/No | LULC Classes | LULC changes in the study years | |||||||
|---|---|---|---|---|---|---|---|---|---|
| 2017 | % | 2018 | % | 2019 | % | 2020 | % | ||
| 1 | Water body | 139,455.06 | 8.58 | 129,372.61 | 7.96 | 120,017 | 7.38 | 119,713.09 | 7.36 |
| 2 | Water hyacinth | 879.53 | 0.05 | 996.75 | 0.06 | 1,553 | 0.10 | 1,796.53 | 0.11 |
| 3 | Farmland | 1,022,032.06 | 62.87 | 1,022,919.16 | 62.92 | 1,040,971 | 64.03 | 1,055,316.48 | 64.91 |
| 4 | Settlement | 35,840.47 | 2.20 | 47,804.46 | 2.94 | 61,225 | 3.77 | 62,634.00 | 3.85 |
| 5 | Vegetation | 115,330.67 | 7.09 | 113,274.44 | 6.97 | 110,038 | 6.77 | 124,140.01 | 7.64 |
| 6 | Shrubland | 312,153.95 | 19.20 | 311,324.32 | 19.15 | 291,888 | 17.95 | 262,091.63 | 16.12 |
| Total Area | 1,625,691.74 | 100.00 | 1,625,691.74 | 100.00 | 1,625,691.74 | 100.00 | 1,625,691.74 | 100.00 | |
| S/No | LULC Classes | LULC changes in the study years | |||||
|---|---|---|---|---|---|---|---|
| 2021 | % | 2022 | % | 2023 | % | ||
| 1 | Water body | 118,005.47 | 7.26 | 117,086.16 | 7.20 | 116,094.91 | 7.14 |
| 2 | Water hyacinth | 1,396.91 | 0.09 | 1,305.87 | 0.08 | 1,096.78 | 0.07 |
| 3 | Farmland | 1,065,536.85 | 65.54 | 1,070,181.59 | 65.83 | 1,075,138.29 | 66.13 |
| 4 | Settlement | 70,774.60 | 4.35 | 74,406.26 | 4.58 | 79,954.40 | 4.92 |
| 5 | Vegetation | 131,494.38 | 8.09 | 133,950.93 | 8.24 | 137,925.42 | 8.48 |
| 6 | Shrubland | 238,483.53 | 14.67 | 228,760.93 | 14.07 | 215,481.94 | 13.25 |
| Total Area | 1,625,691.74 | 100.00 | 1,625,691.74 | 100.00 | 1,625,691.74 | 100.00 | |
Table 4.
Error matrices of LULC map derived from sentinel images (2017–2023)
| LULC Classes | 2017 | ||||||||
|---|---|---|---|---|---|---|---|---|---|
| 1 | 2 | 3 | 4 | 5 | 6 | Total | Producer's accuracy (%) | User's accuracy (%) | |
| 1 | 108 | 3 | 0 | 0 | 0 | 0 | 111 | 96.43 | 97.3 |
| 2 | 3 | 200 | 4 | 2 | 3 | 4 | 216 | 86.58 | 92.59 |
| 3 | 1 | 11 | 191 | 0 | 17 | 5 | 225 | 89.67 | 84.89 |
| 4 | 0 | 15 | 7 | 211 | 1 | 11 | 245 | 95.48 | 86.12 |
| 5 | 0 | 0 | 3 | 3 | 117 | 5 | 128 | 84.78 | 91.41 |
| 6 | 0 | 2 | 8 | 5 | 0 | 390 | 405 | 93.98 | 96.3 |
| Total | 112 | 231 | 213 | 221 | 138 | 415 | 1330 | ||
| Overall accuracy = 91.50%, Kappa coefficient = 0.88 | |||||||||
| LULC Classes | 2018 | ||||||||
|---|---|---|---|---|---|---|---|---|---|
| 1 | 2 | 3 | 4 | 5 | 6 | Total | Producer's accuracy (%) | User's accuracy (%) | |
| 1 | 109 | 9 | 1 | 0 | 1 | 0 | 120 | 93.16 | 90.83 |
| 2 | 3 | 151 | 0 | 0 | 0 | 0 | 154 | 80.75 | 98.05 |
| 3 | 0 | 11 | 163 | 0 | 23 | 0 | 197 | 93.14 | 82.74 |
| 4 | 5 | 9 | 5 | 261 | 1 | 0 | 281 | 92.88 | 92.88 |
| 5 | 0 | 5 | 3 | 18 | 112 | 0 | 138 | 81.75 | 81.16 |
| 6 | 0 | 2 | 3 | 2 | 0 | 91 | 98 | 100 | 92.86 |
| Total | 117 | 187 | 175 | 281 | 137 | 91 | 988 | ||
| Overall accuracy = 89.78%, Kappa coefficient = 0.86 | |||||||||
| LULC Classes | 2019 | ||||||||
|---|---|---|---|---|---|---|---|---|---|
| 1 | 2 | 3 | 4 | 5 | 6 | Total | Producer's accuracy (%) | User's accuracy (%) | |
| 1 | 143 | 11 | 0 | 0 | 0 | 0 | 154 | 91.67 | 92.86 |
| 2 | 13 | 92 | 4 | 0 | 1 | 2 | 112 | 85.19 | 82.14 |
| 3 | 0 | 1 | 89 | 0 | 3 | 5 | 98 | 88.12 | 90.82 |
| 4 | 0 | 0 | 3 | 76 | 1 | 3 | 83 | 93.83 | 91.57 |
| 5 | 0 | 3 | 4 | 2 | 83 | 3 | 95 | 88.30 | 87.37 |
| 6 | 0 | 1 | 1 | 3 | 6 | 101 | 112 | 88.60 | 90.18 |
| Total | 156 | 108 | 101 | 81 | 94 | 114 | 654 | ||
| Overall accuracy = 89.30%, Kappa coefficient = 0.85 | |||||||||
| LULC Classes | 2019 | ||||||||
|---|---|---|---|---|---|---|---|---|---|
| 1 | 2 | 3 | 4 | 5 | 6 | Total | Producer's accuracy (%) | User's accuracy (%) | |
| 1 | 143 | 11 | 0 | 0 | 0 | 0 | 154 | 91.67 | 92.86 |
| 2 | 13 | 92 | 4 | 0 | 1 | 2 | 112 | 85.19 | 82.14 |
| 3 | 0 | 1 | 89 | 0 | 3 | 5 | 98 | 88.12 | 90.82 |
| 4 | 0 | 0 | 3 | 76 | 1 | 3 | 83 | 93.83 | 91.57 |
| 5 | 0 | 3 | 4 | 2 | 83 | 3 | 95 | 88.30 | 87.37 |
| 6 | 0 | 1 | 1 | 3 | 6 | 101 | 112 | 88.60 | 90.18 |
| Total | 156 | 108 | 101 | 81 | 94 | 114 | 654 | ||
| Overall accuracy = 89.30%, Kappa coefficient = 0.85 | |||||||||
| LULC Classes | 2020 | ||||||||
|---|---|---|---|---|---|---|---|---|---|
| 1 | 2 | 3 | 4 | 5 | 6 | Total | Producer's accuracy (%) | User's accuracy (%) | |
| 1 | 131 | 12 | 0 | 0 | 0 | 0 | 143 | 92.25 | |
| 2 | 11 | 119 | 4 | 2 | 3 | 4 | 143 | 86.86 | |
| 3 | 0 | 3 | 89 | 0 | 7 | 0 | 99 | 89.00 | |
| 4 | 0 | 1 | 3 | 107 | 0 | 9 | 120 | 83.59 | |
| 5 | 0 | 0 | 2 | 10 | 87 | 2 | 101 | 89.69 | |
| 6 | 0 | 2 | 2 | 9 | 0 | 129 | 142 | 89.58 | |
| Total | 142 | 137 | 100 | 128 | 97 | 144 | 748 | ||
| Overall accuracy = 88.50%, Kappa coefficient = 0.84 | |||||||||
| LULC Classes | 2021 | ||||||||
|---|---|---|---|---|---|---|---|---|---|
| 1 | 2 | 3 | 4 | 5 | 6 | Total | Producer's accuracy (%) | User's accuracy (%) | |
| 1 | 143 | 11 | 0 | 0 | 0 | 0 | 154 | 91.67 | |
| 2 | 13 | 92 | 4 | 0 | 1 | 2 | 112 | 85.19 | |
| 3 | 0 | 1 | 89 | 0 | 3 | 5 | 98 | 88.12 | |
| 4 | 0 | 0 | 3 | 76 | 1 | 3 | 83 | 93.83 | |
| 5 | 0 | 3 | 4 | 2 | 83 | 3 | 95 | 88.30 | |
| 6 | 0 | 1 | 1 | 3 | 6 | 101 | 112 | 88.60 | |
| Total | 156 | 108 | 101 | 81 | 94 | 114 | 654 | ||
| Overall accuracy = 89.29%, Kappa coefficient = 0.85 | |||||||||
| LULC Classes | 2022 | ||||||||
|---|---|---|---|---|---|---|---|---|---|
| 1 | 2 | 3 | 4 | 5 | 6 | Total | Producer's accuracy (%) | User's accuracy (%) | |
| 1 | 121 | 11 | 0 | 0 | 0 | 0 | 132 | 90.30 | |
| 2 | 13 | 98 | 1 | 0 | 2 | 0 | 114 | 88.29 | |
| 3 | 0 | 0 | 95 | 4 | 5 | 2 | 106 | 87.16 | |
| 4 | 0 | 0 | 2 | 79 | 1 | 3 | 85 | 92.94 | |
| 5 | 0 | 2 | 6 | 2 | 77 | 3 | 90 | 90.59 | |
| 6 | 0 | 0 | 5 | 0 | 0 | 91 | 96 | 91.92 | |
| Total | 134 | 111 | 109 | 85 | 85 | 99 | 623 | ||
| Overall accuracy = 90.05%, Kappa coefficient = 0.87 | |||||||||
| LULC Classes | 2023 | ||||||||
|---|---|---|---|---|---|---|---|---|---|
| 1 | 2 | 3 | 4 | 5 | 6 | Total | Producer's accuracy (%) | User's accuracy (%) | |
| 1 | 129 | 12 | 0 | 0 | 0 | 0 | 141 | 92.14 | |
| 2 | 11 | 131 | 0 | 0 | 2 | 0 | 144 | 87.92 | |
| 3 | 0 | 2 | 87 | 3 | 4 | 2 | 100 | 90.63 | |
| 4 | 0 | 0 | 4 | 91 | 1 | 2 | 102 | 92.86 | |
| 5 | 0 | 2 | 0 | 0 | 127 | 6 | 142 | 91.37 | |
| 6 | 0 | 2 | 5 | 4 | 5 | 119 | 142 | 92.25 | |
| Total | 140 | 149 | 96 | 98 | 139 | 129 | 771 | ||
| Overall accuracy = 88.72%, Kappa coefficient = 0.87 | |||||||||
Table 5.
Land transformation, magnitude, percentage share LULC of seven consecutive years (2017–2023)
| LULC Classes | LULC of 2017 | ||||||||||
|---|---|---|---|---|---|---|---|---|---|---|---|
| 1 | 2 | 3 | 4 | 5 | 6 | Total | Total area gained (ha) | Total area lost (ha) | Net changes | ||
| 1 | 135,751.01 | - | - | - | - | 0.09 | 135,751.10 | 6.96 | 0.09 | 6.87 | |
| LULC of 2018 | 2 | 6.87 | 869.55 | 0.67 | - | - | - | 877.09 | 0.09 | 7.54 | (7.45) |
| 3 | 0.09 | 0.09 | 1,035,950.94 | 14.46 | 8.00 | 29.34 | 1,036,002.92 | 15.28 | 51.89 | (36.61) | |
| 4 | - | - | 6.89 | 39,971.96 | 0.98 | 6.97 | 39,986.80 | 14.46 | 13.86 | 0.60 | |
| 5 | - | - | 4.31 | - | 108,798.59 | 26.33 | 108,829.23 | 398.18 | 30.64 | 367.54 | |
| 6 | - | - | 3.41 | - | 390.18 | 303,851.09 | 304,244.68 | 62.64 | 393.59 | (330.95) | |
| Total | 135,757.97 | 869.64 | 1,035,966.22 | 39,986.42 | 109,197.75 | 303,913.82 | 1,625,691.82 | 497.61 | 497.61 | 0.00 | |
| LULC Classes | LULC of 2018 | ||||||||||
|---|---|---|---|---|---|---|---|---|---|---|---|
| 1 | 2 | 3 | 4 | 5 | 6 | Total | Total Area gained (ha) | Total area lost (ha) | Net changes | ||
| LULC of 2019 | 1 | 135,108.77 | 0 | 0.65 | 0 | 0 | 0 | 135,109.42 | 0 | 426.13 | 425.98 |
| 2 | 425.96 | 871.34 | 0.17 | 0 | 0 | 0 | 1,297.47 | 426.630 | 0.65 | −426.13 | |
| 3 | 0.67 | 1.37 | 1,101,785.54 | 14.46 | 8.01 | 9.14 | 1,101,819.19 | 15.43 | 32.28 | −16.85 | |
| 4 | 0 | 0 | 6.89 | 40,235.84 | 0 | 6.97 | 40,249.70 | 21.28 | 13.86 | 7.42 | |
| 5 | 0 | 0 | 4.31 | 6.82 | 103,368.41 | 36.33 | 103,415.87 | 58.19 | 47.46 | 10.73 | |
| 6 | 0 | 0 | 3.41 | 0 | 50.18 | 243,746.49 | 243,800.08 | 52.44 | 53.59 | −1.15 | |
| Total | 135,535.40 | 872.71 | 1,101,800.97 | 40,257.12 | 103,426.60 | 243,798.93 | 1,625,691.73 | 573.97 | 573.97 | 0.00 | |
| LULC Classes | LULC of 2019 | ||||||||||
|---|---|---|---|---|---|---|---|---|---|---|---|
| 1 | 2 | 3 | 4 | 5 | 6 | Total | Total Area gained (ha) | Total area lost (ha) | Net changes | ||
| LULC of 2020 | 1 | 130,433.45 | 0 | 0.09 | 0 | 0 | 0 | 130,433.54 | 6.96 | 0.09 | 6.87 |
| 2 | 6.87 | 909.77 | 0 | 0 | 0 | 0 | 916.64 | 0 | 6.87 | −6.87 | |
| 3 | 0.09 | 0 | 1,108,611.39 | 1.93 | 1.07 | 1.22 | 1,108,615.70 | 4.71 | 4.31 | 0.4 | |
| 4 | 0 | 0 | 0.92 | 40,950.65 | 0 | 0.93 | 40,952.50 | 2.84 | 1.85 | 0.99 | |
| 5 | 0 | 0 | 1.91 | 0.91 | 102,531.10 | 4.85 | 102,538.77 | 7.77 | 7.67 | 0.1 | |
| 6 | 0 | 0 | 1.79 | 0 | 6.7 | 242,226.09 | 242,234.58 | 7 | 8.49 | −1.49 | |
| Total | 126838.5 | 2974.76 | 28967.17 | 14453.49 | 11542.76 | 32288.66 | 1,625,691.73 | 29.28 | 29.28 | 0.00 | |
| LULC Classes | LULC of 2020 | ||||||||||
|---|---|---|---|---|---|---|---|---|---|---|---|
| 1 | 2 | 3 | 4 | 5 | 6 | Total | Total Area gained (ha) | Total area lost (ha) | Net changes | ||
| LULC of 2021 | 1 | 129,547.76 | 0 | 0.18 | 0 | 0 | 0 | 129,547.94 | 14.14 | 0.18 | 13.96 |
| 2 | 7.86 | 917.57 | 2.29 | 0 | 1.09 | 0 | 928.81 | 1.35 | 11.24 | −9.89 | |
| 3 | 6.28 | 1.35 | 1,219,029.26 | 0.89 | 14.73 | 92.18 | 1,219,144.69 | 7.21 | 115.43 | −108.22 | |
| 4 | 0 | 0 | 4.74 | 47,961.54 | 4.97 | 5.91 | 47,977.16 | 0.89 | 15.62 | −14.73 | |
| 5 | 0 | 0 | 0 | 0 | 98,359.77 | 8.19 | 98,367.96 | 46.27 | 8.19 | 38.08 | |
| 6 | 0 | 0 | 0 | 0 | 20.48 | 129,704.69 | 129,725.17 | 106.28 | 20.48 | 85.8 | |
| Total | 129,561.90 | 918.92 | 1,219,036.47 | 47,962.43 | 98,401.04 | 129,810.97 | 1,625,691.73 | 171.14 | 171.14 | 0.00 | |
| LULC Classes | LULC of 2021 | ||||||||||
|---|---|---|---|---|---|---|---|---|---|---|---|
| 1 | 2 | 3 | 4 | 5 | 6 | Total | Total Area gained (ha) | Total area lost (ha) | Net changes | ||
| LULC of 2022 | 1 | 128,142.48 | - | - | - | - | - | 128,142.48 | 11.28 | - | 11.28 |
| 2 | 6.259 | 19.73 | 2.08 | - | - | - | 928.06 | - | 8.33 | (8.33) | |
| 3 | 5.03 | - | −1,223,031.80 | - | 0.67 | 1.42 | 1,223,038.92 | 12.06 | 7.12 | 4.94 | |
| 4 | - | - | - | −49,447.80 | 3.24 | 7.75 | 49,458.79 | - | 10.99 | (10.99) | |
| 5 | - | - | 5.14 | - | −96,298.29 | 8.19 | 96,311.62 | 13.67 | 13.33 | 0.34 | |
| 6 | - | - | 4.84 | - | 9.76 | 127,797.26 | 127,811.86 | 17.36 | 14.60 | 2.76 | |
| Total | 128,153.76 | 919.73 | 1,223,043.86 | 49,447.80 | 96,311.96 | 127,814.62 | 1,625,691.73 | 54.37 | 54.37 | 0.00 | |
| LULC Classes | LULC of 2022 | ||||||||||
|---|---|---|---|---|---|---|---|---|---|---|---|
| 1 | 2 | 3 | 4 | 5 | 6 | Total | Total Area gained (ha) | Total area lost (ha) | Net changes | ||
| LULC of 2023 | 1 | 124,266.96 | - | 2.73 | - | - | - | 124,269.69 | 14.87 | 2.73 | 12.14 |
| 2 | 4.53 | 921.89 | - | - | - | - | 926.42 | - | 4.53 | (4.53) | |
| 3 | 10.34 | - | 1,228,300.33 | - | 3.13 | 52.46 | 1,228,366.26 | 12.49 | 65.93 | (53.44) | |
| 4 | - | - | 7.68 | 53,316.66 | 5.81 | - | 53,330.15 | - | 13.49 | (13.49) | |
| 5 | - | - | - | - | 95,105.19 | 3.22 | 95,108.41 | 14.62 | 3.22 | 11.40 | |
| 6 | - | - | 2.08 | - | 5.68 | 123,683.04 | 123,690.80 | 55.68 | 7.76 | 47.92 | |
| Total | 124,281.83 | 921.89 | 1,228,312.82 | 53,316.66 | 95,119.81 | 123,738.72 | 1,625,691.73 | 97.66 | 97.66 | 0.00 | |
| LULC classes | LULC of 2017 | ||||||||||
|---|---|---|---|---|---|---|---|---|---|---|---|
| 1 | 2 | 3 | 4 | 5 | 6 | Total | Total area gained (ha) | Total area lost (ha) | Net changes | ||
| LULC of 2023 | 1 | 121,971.67 | 324.37 | 0.08 | 0 | 0 | 0 | 122,296.12 | 4.52 | 324.45 | −319.93 |
| 2 | 4.22 | 1,909.11 | 1.72 | 0 | 0 | 0 | 1,915.05 | 325.33 | 5.94 | 319.39 | |
| 3 | 0 | 0.96 | 1,235,148.53 | 0 | 3.88 | 11.22 | 1,235,164.59 | 4.58 | 16.06 | −11.48 | |
| 4 | 0 | 0 | 2.78 | 62,244.84 | 3.99 | 24.28 | 62,275.89 | 0.00 | 31.05 | −31.05 | |
| 5 | 0.3 | 0 | 0 | 0 | 82,356.19 | 5.24 | 82,361.73 | 13.94 | 5.54 | 8.4 | |
| 6 | 0 | 0 | 0 | 0.00 | 6.07 | 121,672.28 | 121,678.35 | 40.74 | 6.07 | 34.67 | |
| Total | 121,976.19 | 2,234.44 | 1,235,153.11 | 62,244.84 | 82,370.13 | 121,713.02 | 1,625,691.73 | 389.11 | 389.11 | 0.00 | |
3.1.1. Accuracy assessment
Accuracy assessment is a process of validating the exactness of the image classification result by comparing the classified thematic map with field reference data [Chughtai et al. 2021]. In order to use the derived LULC thematic map for further analysis and interpretation, the errors need to be quantified and evaluated in terms of accuracy assessment threshold [Stehman and Foody 2019]. Overall accuracy, user's accuracy, producer's accuracy and the kappa coefficient are the most popular measures to address the difference between actual and change agreement. This change agreement was calculated from an error matrix. Therefore, for this study, the reference data were collected from Google Maps and field observation, and accuracy of the thematic map for each study year was then calculated from the error matrices and followed by a brief explanation, as follows.
Even when satisfactory results were obtained from image classification, misclassification challenges happened due to similar spectral responses of different features. To minimize this challenge, researchers performed field observation and ground control point (GCP) collection for sample sites to arrive at the reasonable validation threshold. The present study's confusion matrix of all the derived LULC maps has revealed the overall accuracy levels as more than the minimum accuracy threshold defined by Anderson. As a result, the calculated kappa coefficients were 0.88, 0.86, 0.84, 0.84, 0.85, 0.87 and 0.87 for LULC maps of 2017, 2018, 2019, 2020, 2021, 2022 and 2023, respectively. According to Getu and Bhat [2021], a kappa coefficient higher than 0.8 indicates a good classification performance and a strong agreement between the derived land use map and reality on the ground. Therefore, it was logical to employ the derived maps for subsequent change detection and land transformation analyses.
3.2. Assessing the impact of water hyacinth
Water hyacinth occurs in almost all of Africa's wetlands and poses serious social, economic and environmental challenges for millions of people in riparian communities. These consequently add challenges to the development of the country [Howard and Matindi 2003]. Therefore, addressing these challenges will require harmonized investigation and collective efforts to formulate effective management strategies among governmental and non-governmental agencies, local communities, and environmental organizations.
3.2.1. Key demographic and socioeconomic characteristic of the respondents
Demographic characteristics of sampled household respondents by age, sex, family size, and education rank are summarized as Tables: 6, 7, 8, 9.
Table 6.
Age category of the respondents
| Age | Frequency | Percent |
|---|---|---|
| 15–29 | 38 | 21.84 |
| 30–49 | 42 | 24.14 |
| 50–64 | 47 | 27.01 |
| >64 | 47 | 27.01 |
| Total | 174 | 100 |
Table 8.
Category of family size of the respondents
| Family size | Frequency | Percent |
|---|---|---|
| 2–5 | 42 | 24.14 |
| 6–10 | 128 | 73.56 |
| 11–15 | 4 | 2.30 |
| Total | 174 | 100 |
Table 9.
Educational level of the respondents
| Level of Education | Frequency | Percent |
|---|---|---|
| Illiterate | 52 | 29.89 |
| Only read and write | 108 | 62.07 |
| Primary school | 7 | 4.02 |
| Secondary school | 4 | 2.30 |
| University/college graduate | 3 | 1.72 |
| Total | 174 | 100 |
As shown in Table 6, approximately 72.99% of the sampled household heads are of working age (15–64 years), while 27.01% are elderly (65 years and older).
The data from the household survey indicates that about 89.66% of the respondent heads are male and the rest (10.34%) are female.
On average, the respondents had a family size of more than 5.0 persons, which was relatively high compared to the national average (4.6 persons) [Gashu and Muchie 2018]. As shown in Table 9, about 30% of households were illiterate and approximately 62% of the respondents were only able to read and write, and the rest had some level of formal education. Nearly 43% of the respondents keep different types of livestock and use the wetland of the lake as a source of animal feeding.
The average land holding size of the study area was 1.35 hectares per household, with a range from 0.25 to 4.25 hectares, which is higher than the national average of 1.14 hectares per household [Alemu et al. 2017]. Nearly half of the respondents held less than one hectare of land and engaged in various off-farming and non-farming activities such as fishing, wage labour and petty trading to sustain their livelihoods.
3.2.2. Impact water hyacinth on livelihood
Most respondents were aware of the water hyacinth infestation along the lake's catchment shoreline. However, the level of awareness regarding water hyacinth and its consequences varied significantly between communities living adjacent to the lake and those situated further inland within the catchment. Communities in close proximity to the water who were directly affected by the infestation demonstrated a higher level of awareness because it actively disrupted their daily livelihoods, particularly fishing, irrigation and water transportation. Local residents often possess invaluable, firsthand knowledge regarding shifts in fish population dynamics and navigation challenges caused by water hyacinth infestation. These empirical insights can significantly deepen our understanding of the ecological crisis. Furthermore, proximity to those challenges frequently fosters community dialogue and grassroots initiatives; local groups often form to organize clean-up efforts or advocate for long-term management solutions. This heightened awareness is largely driven by the severe economic implications of the infestation, such as reduced fish catches that directly threaten local livelihoods. Ultimately, because these lakeside communities have a vested interest in mitigating these adverse effects, they are substantially more likely to participate actively in targeted training programs and management workshops. Conversely, communities located farther from the lake may have limited awareness of water hyacinth and its impacts, as they do not experience the issue directly. These populations often lack access to adequate information regarding environmental issues affecting distant ecosystems, leading to a disconnect between their daily lives and the challenges posed by invasive species. Without direct experience or targeted education, misconceptions about the ecological role of water hyacinth can arise, resulting in misunderstandings about its true impacts and management needs. Consequently, more distant communities are less likely to participate in management efforts or advocacy due to a lack of awareness or perceived relevance.
Regarding local observations, the vast majority of respondents (93%) noted that the weed infestation began along the lakeshore approximately 10 years ago, while the remaining respondents were unaware of when the infestation reached the lake's catchment area. Within the study area, respondents characterized the overall impact of water hyacinth as overwhelmingly negative rather than positive. Furthermore, data from both the household survey and qualitative analysis indicated that water hyacinth has severely compromised crop production, fishing activities and fish stocks, livestock feeding resources, water supply, water transportation and other economic activities. The comprehensive findings of both the household survey and qualitative data analysis are reported and discussed as follows.
3.2.3. Impact of water hyacinth on crop production
In Africa, India and Sri Lanka, water hyacinth interferes with agricultural practices through increasing water loss [Gedefaw and Gondar 2018]. Similar to other parts of Ethiopia, crop production is the primary source of food and income for the population in the study area. The majority of farmland within the catchment is allocated for cultivation, with cereal crops, vegetables, and tubers and root crops grown on the fertile soils adjacent to the lake's wetland. However, the water hyacinth infestation in the catchment has severely impacted crop production and reduced agricultural yields, as shown in Table 10.
Table 10.
Impact of water hyacinth on crop production
| Severity level of water hyacinth on crop production | Respondents | Infested land | Estimated yield lost (%) | Remark | ||
|---|---|---|---|---|---|---|
| No | % | km2 | % | |||
| Severe | 123 | 70.69 | 0.78 | 40.63 | 58–100 | |
| Moderate | 36 | 20.69 | 0.53 | 27.60 | 25–58 | |
| Rare | 15 | 8.62 | 0.61 | 31.77 | 0–25 | |
| Total | 174 | 100 | 1.92 | 100 | ||
As presented in Table 10, approximately 71% of households living adjacent to the lake reported that nearly 41% of their holdings were severely affected by the invasive weed, resulting in 58% to 100% yield loss during peak seasons. Likewise, roughly 21% of households stated that 27.60% of their holdings were moderately affected, with yield reductions ranging from 25% to 58%. The remaining 8.62% of respondents indicated that the infestation rarely impacted their holdings, affecting an average of 0.61 hectares and causing minimal crop production losses of 0% to 25%.
3.2.4. Impact of water hyacinth on fishing activities
Fishing and related businesses are a way of life for many communities living around lakes. However, the growth of microorganisms that impact fish and fishing activities is limited by the habitat change and complexity created by water hyacinth at the water's surface (Delgado-Ramírez et al. 2022). Water hyacinth mats also significantly impact fish catch rates by obstructing access to fishing grounds, clogging and damaging net meshes, and increasing overall fishing expenses. Data obtained from the Woreda Animal and Fish Development sectors indicate that approximately 112 individuals are engaged in commercial fishing activities within the study area. The invasion of the lakeshore, river mouths and wetlands by water hyacinth has led to a severe deterioration of both fish populations and fishing operations.
Due to this invasion, the fish resources of Lake Abaya are experiencing a sharp decline, particularly during the peak spawning season. Household surveys conducted with local fishermen confirm that daily catch volumes have dropped significantly compared to the pre-invasion period. According to the survey results, an individual fisherman could previously catch an average of 22.5 kilograms of fish per day during the spawning season. Following the water hyacinth invasion, the average daily catch during the same period declined by 34.40% (an average reduction of 7.749 kilograms per day). The findings of other researchers also quantified and reported the reduction of fish caught per fisherman after the water hyacinth infestation. Enyew et al. [2020] revealed that, in comparison to before the water hyacinth infestation, the average daily catch of fish per fisherman dropped by 90% in the Wouri River Basin, Cameroon. Evidence from focus group discussions (FGD) with fishermen indicated that the depletion of fish feed and the obstruction of fish migration to spawning habitats accounted for the reduction in daily catch per fisherman. Similarly, De Groote et al. [2003] reported that dense weed mats destroy breeding grounds and block access to fishing areas, ultimately driving down fish populations and overall catchability.
The reduction in fish catches resulted in a corresponding decrease in income for local fishermen. Based on estimates from the district cooperative offices' reports and current market values, fishermen lost an average of USD 17.39 per day during spawning season.
Focus group discussions with fishermen revealed that the water hyacinth infestation has reduced the lifespan of gillnets and reed boats, thereby increasing annual fishing costs. Participants reported that before the lake was invaded by the weed, fishnets lasted between 7 and 9 months. However, the water hyacinth has shortened this lifespan to just 2–4 months by physically damaging the nets and obstructing transportation. Survey results corroborated these findings, confirming that the shortened lifespan of equipment has driven up operational costs. Current economic valuations indicate that each fisherman now spends a minimum of USD 120 extra per year due to the shoreline infestation. Consequently, fishermen expressed deep frustration during the discussions, noting that the combination of lower catches per gillnet and rising equipment costs has forced many to abandon the trade and seek alternative livelihoods.
3.2.5. Impact of water hyacinth on the availability of livestock feeding resources
Farmers within the study area raised various types of livestock, predominantly cattle, sheep, camels, donkeys and poultry. Due to the availability of feed and water resources on the lakeshore, livestock holdings per household in the Lake Abaya catchment were relatively large. The primary sources of livestock feed included grazing pasture, crop residues, crop aftermaths, hay, weeds and agricultural by products.
Communal grazing pastures serve as the main source of feed for herders across the region, contributing significantly to the overall supply of animal fodder. Findings from focus group discussions revealed that all livestock populations grazed freely along the lakeshore, which provided the principal grazing grounds for cattle in kebeles located near the lake, particularly during periods of scarcity. Over time, the quality of grazing pastures along the lakeshore deteriorated, with much of the area overtaken by invasive water hyacinth.
Historically, farmers regarded the shoreline grazing pastures as their primary source for livestock feed. Focus group discussions confirmed this, revealing that during dry seasons, these lakeshores were often the only available feeding grounds. Recently, however, the expansion of non-native plant species within the lake's shoreline and marshlands has severely reduced the area's feed supply. Furthermore, the encroachment of agricultural activities into the fertile lakeshores and wetlands has severely degraded these grazing pastures. Discussion participants noted that a significant portion of the wetlands had been illegally converted into cropland over the past decade. The availability of feeding resources was further strained by government officials allocating communal grazing lands to landless youth.
Consequently, nearly all cattle owners now prefer to keep their animals within household compounds, relying primarily on crop residues and cut-and-carry feeding systems. Participants also identified the water hyacinth infestation as a major driver of feed scarcity, noting the weed heavily damages local crop fields. To compensate for the resulting feed shortages, interviewed farmers reported having to purchase external feed resources. On average, livestock owners spent USD 169.01 per year on hay, crop residues, and agro-industrial by-products. Local district experts corroborated these findings, reporting that weed infestations have had a severely negative impact on both communal lakeshore grazing lands and their associated wetlands.
3.3. Factors responsible for water hyacinth evasion dynamics in Lake Abaya
The invasion of water hyacinth in the Lake Abaya catchment is the collective result of various anthropogenic factors, deeply rooted in the local community's heavy reliance on the goods and services provided by the wetland ecosystem. Primary drivers responsible for introducing the water hyacinth, subsequently degrading the lake's ecosystem and reducing its socioeconomic benefits, include agricultural expansion, the unregulated use of wetland resources for livestock grazing under open-access conditions, rapid population growth, urban waste disposal, and general neglect. These factors are further compounded by the severe depletion of vegetation in the upper catchment of the lake, as detailed in Table 11.
Table 11.
Drivers for water hyacinth expansion
| S/No | Factors Responsible for the expansion of Water Hyacinth | Respondents in number | Respondents in % |
|---|---|---|---|
| 1 | Open access | 57 | 32.76 |
| 2 | Rapid population growth | 39 | 22.41 |
| 3 | Farmland expansion | 29 | 16.67 |
| 4 | Deforestation | 21 | 12.07 |
| 5 | Overgrazing | 17 | 9.77 |
| 6 | Urbanization and urban waste disposal | 11 | 6.32 |
| Total | 174 | 100 | |
The expansion of water hyacinth and the subsequent degradation of the Lake Abaya wetland ecosystem along with the loss of its socioeconomic benefits are primarily driven by the exploitation of the wetland as an open-access resource (32.76%). Additional key drivers include rapid population growth (22.41%), agricultural expansion (16.67%), deforestation (12.07%), overgrazing (9.77%), and urbanization combined with improper urban waste disposal (6.32%). Rapid population growth and critical shortage of arable land have systematically induced agricultural encroachment into marginal areas and directly toward the wetland.
Furthermore, the heavy use of chemical fertilizers and pesticides by local farmers and commercial investors for high-yield crop cultivation in the surrounding highlands has severely exacerbated lake pollution. This nutrient runoff creates an environment highly favourable to the rapid proliferation of invasive water hyacinth. This weed not only disrupts local aquatic ecosystems but also severely hinders fishing and recreational activities, directly threatening the livelihoods of communities dependent on the lake.
Consequently, targeted efforts to manage the water hyacinth infestation and reduce agricultural runoff are critical to restoring the lake's ecological health and preserving its biodiversity. Protecting this biodiversity is vital to maintaining ecological balance and ensuring that future generations can benefit from the lake's natural resources. Achieving this goal will require the urgent implementation of sustainable farming practices and the promotion of community-led environmental awareness. Finally, statistical analysis indicates that rural household size also exerts a significant negative impact on the stability of the wetland ecosystem. Key informants' interviews (KII) and focus group discussions (FGD) confirmed that the expansion of farmland into the wetland's buffer zone introduced exotic plant species to the Abaya wetland ecosystem. According to respondents, local authorities actively supported wetland cultivation, viewing it as a mechanism for job creation, agricultural productivity enhancement, food security and rural income generation. Broadly, this trend reflects a systemic issue across Africa, where executive bodies continue to afford inadequate attention to the critical value of wetland ecosystem services.
According to a key informant, the primary drivers of degradation in the Lake Abaya wetland include a lack of explicit laws and regulations protecting wetlands, insufficient penalties for violators, and a lack of commitment to natural resource preservation among relevant institutional entities. Rapid population growth serves as a root cause of resource overexploitation, particularly in the upper catchment of the lake. This demographic pressure is driven by a combination of high local natural increase and significant in-migration spurred by push-factors, such as population density, in areas of origin.
Furthermore, discussion participants highlighted that the absence of clearly defined buffer zones has led to the spontaneous, unregulated expansion of private smallholder farming within the Lake Abaya catchment, causing severe environmental damage and ecosystem degradation. Consequently, the wetlands adjacent to Lake Abaya are now predominantly covered by banana plantations, tomato fields, and other fruit farms. Recent land-use changes within the catchment are ongoing, characterized by the introduction of new, advanced commercial horticulture operations. Ultimately, findings from the FGDs and KIIs, particularly with woreda (district) and kebele (local) experts, underscore that despite short-term livelihood benefits, the ecological functions of the lake's wetlands remain highly vulnerable to the unmanaged expansion of agricultural practices in the study area.
4. CONCLUSIONS AND RECOMMENDATIONS
4.1. Conclusions
In conclusion, the invasive dynamics of water hyacinth carry severe socioeconomic and ecological implications. The weed severely restricts navigation and blocks access to essential waterways, disrupting both transportation and fishing activities. This directly compromises the livelihoods of local fishing communities who depend heavily on these aquatic resources for income. Furthermore, efforts to control and manage the water hyacinth infestation demand substantial financial resources, frequently diverting funds from critical regional development agencies. Current interventions ranging from manual harvesting to chemical treatments are not only costly but often prove unsustainable in the long run. These challenges are exacerbated by gaps in Ethiopia's current water management policies and legal frameworks, which fail to curb nutrient pollution and untreated sewage discharge, thereby creating ideal conditions for accelerated weed growth.
Ultimately, the aggressive spread of water hyacinth induces far-reaching biophysical and economic disruptions. By altering the ecological balance of aquatic ecosystems, it accelerates environmental degradation, damages vital infrastructure, diminishes local economic productivity, and undermines the well-being of communities dependent on these water bodies. Developing proactive, integrated, and sustainable management strategies is therefore imperative to mitigate these environmental threats and protect the socioeconomic future of the region.
4.2. Recommendations
Based on the findings of the study, the following recommendations are put forth.
Regular Monitoring and Early Detection: Implement routine investigation and monitoring systems to detect water hyacinth invasion at an early stage. This should include regular field surveys and the deployment of remote sensing technologies to efficiently identify and map infested areas.
Public Awareness and Community Engagement: Educate local communities on the negative implications of water hyacinth and the critical importance of early detection and control. Encouraging active community participation fosters a collective, highly effective approach to manage invasive species. Furthermore, as noted by key informants (particularly development agents), the degradation of the Lake Abaya wetland is exacerbated by lack of clear regulations, weak enforcement against resource abuse, and limited commitment from responsible stakeholders. Therefore, community engagement must be integrated with robust, transparent legal frameworks that regulate sustainable resource use and hold stakeholders accountable.
Rapid Response Teams and Integrated Management Approach: Establish dedicated, multi-disciplinary rapid resource teams equipped with the necessary tools and expertise to contain sudden outbreaks. Management strategies should be comprehensive and sustainable, integrating manual removal, mechanical harvesting, biological control agents, and carefully managed chemical treatments.
Research and Technological Innovation: Invest in research and development of advanced technologies such as use of drone surveillance, high resolution satellite imagery, and automated mapping tools to improve the precision and efficiency of invasion control techniques.
National and International Collaboration: Partner with domestic and international institutions facing similar environmental challenges to share knowledge, data, and best practices. Strengthening collaboration between government agencies and non-governmental organizations (NGOs) is essential for pooling resources, coordinating large-scale efforts, and developing proactive cross-border mitigation strategies to halt the rapid expansion of the weed.
Formulation And Enforcement of Regulatory Frameworks: Formulate and strictly impose effective water and wetland management regulations. This framework should include enforceable penalties for entities responsible for nutrient pollution and discharging untreated sewage into water bodies, which creates the ideal, nutrient-rich conditions for water hyacinth proliferation.
Restoration and Habitat Management: Focus on the ecological restoration and sustainable management of wetland catchments. Key actions should include restoring local biodiversity, promoting native plant species, and mitigating upstream agricultural runoff. Because water hyacinth heavily impacts agricultural productivity and economic viability particularly regarding cash crops, integrated habitat management is essential not only to protect local biodiversity but also to safeguard agricultural economies and support sustainable livelihoods.