
Table 1
Substances, emitted to the environment, inventoried according to EMEP EEA procedure [EEA/EMEP Emission Inventory Guidebook 2019]
| Substance |
|---|
| Carbon monoxide |
| Volatile organic compounds |
| Non-methane volatile organic compounds |
| Polycyclic aromatic hydrocarbons |
| Hexachlorobenzene, polychlorinated biphenyls, dioxins, and furans |
| Nitrogen monoxide |
| Nitrogen dioxide |
| Nitrogen oxides as nitrogen dioxide |
| Particulate matter PM10 |
| Particulate matter PM2.5 |
| Total suspended particulate matter TSP |
| Carbon black (soot) |
| Sulfur oxides as sulfur dioxide |
| Ammonia |
| Heavy metals: lead, cadmium, mercury, arsenic, chromium, copper, nickel, zinc, selenium |
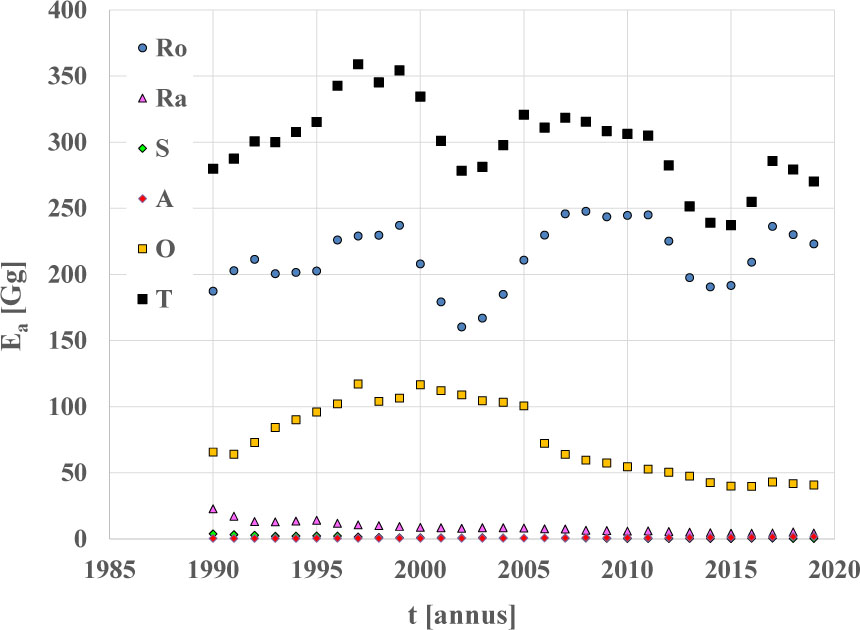
Figure 1
National annual emissions – Ea of nitrogen oxides – NOx for transport categories: Ro - road transport, Ra - rail transport, S - water transport, A - air transport, O - other transport modes, T - total transport
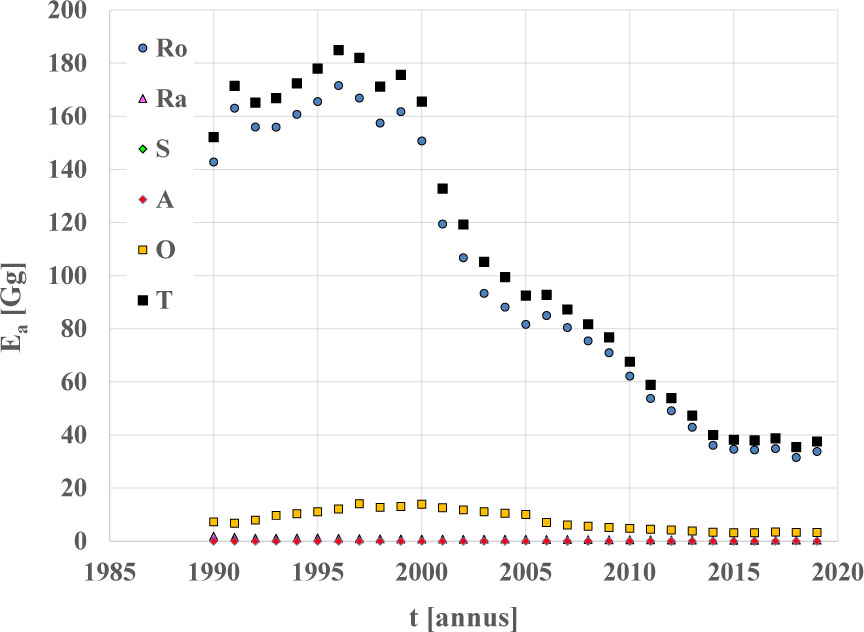
Figure 2
National annual emissions – Ea of non-methane volatile organic compounds – NMVOCs for transport categories: Ro - road transport, Ra - rail transport, S - water transport, A - air transport, O - other transport modes, T - total transport
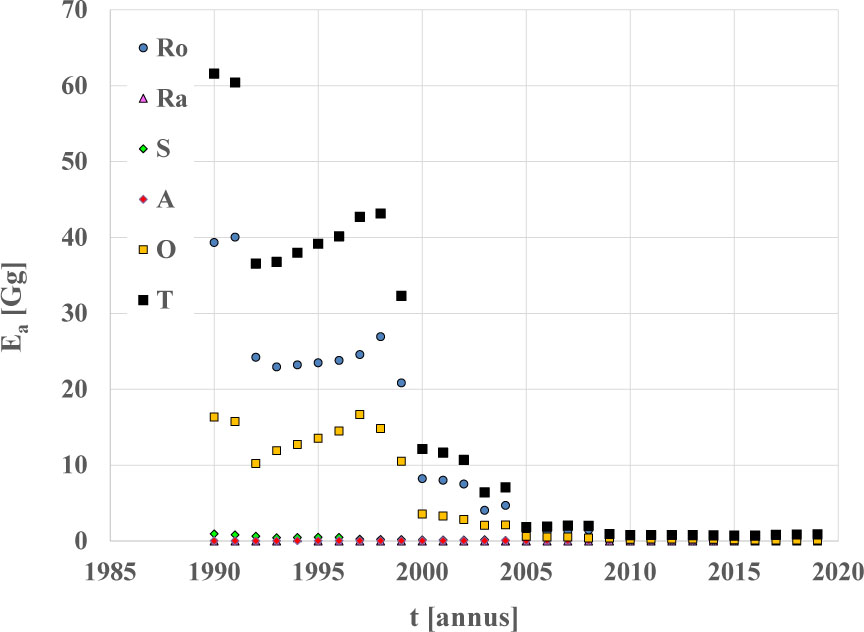
Figure 3
National annual emission – Ea of sulfur oxides – SOx for transport categories: Ro - road transport, Ra - rail transport, S - water transport, A - air transport, O - other transport modes, T - total transport
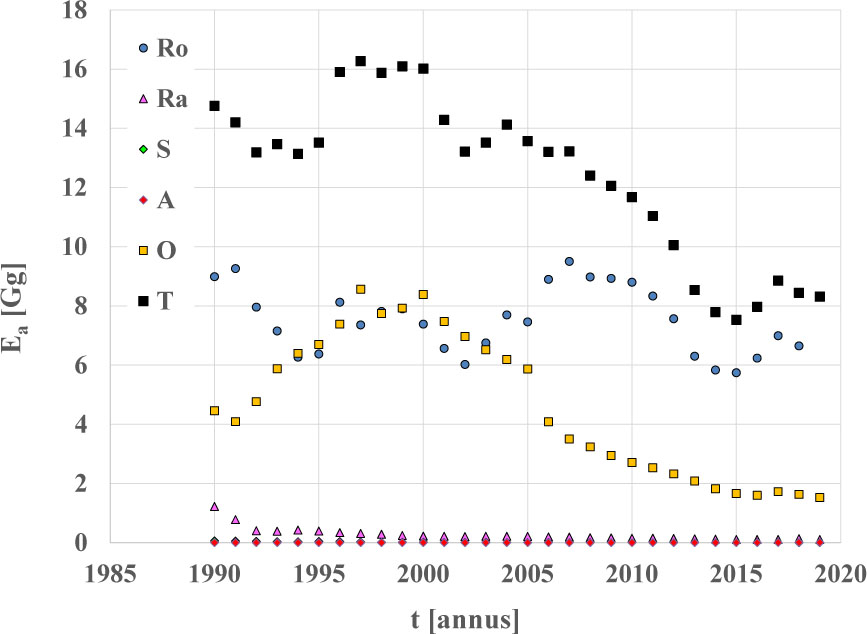
Figure 4
National annual emission – Ea of particulate matter PM2.5 for transport categories: Ro - road transport, Ra - rail transport, S - water transport, A - air transport, O - other transport modes, T - total transport
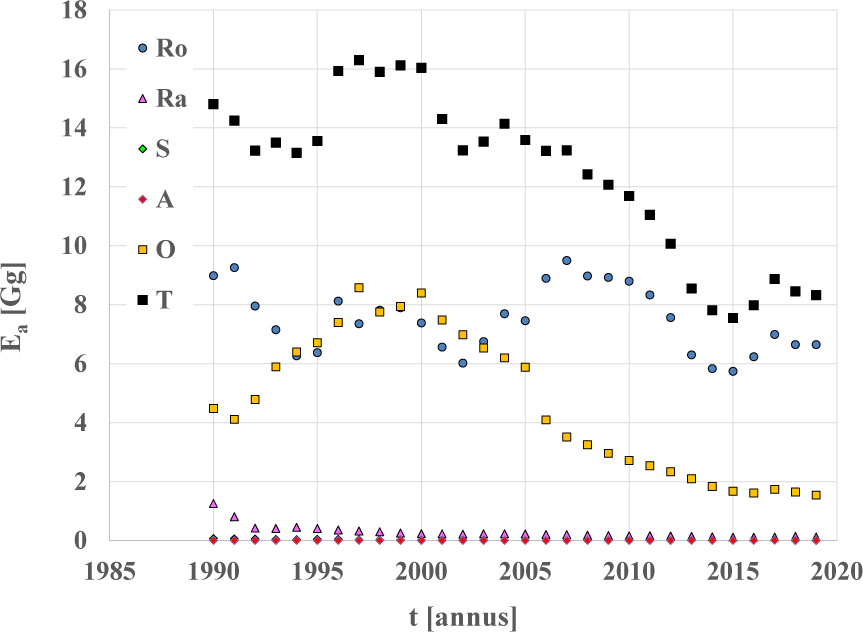
Figure 5
National annual emission – Ea of PM10 for transport categories: Ro - road transport, Ra - rail transport, S - water transport, A - air transport, O - other transport modes, T - total transport
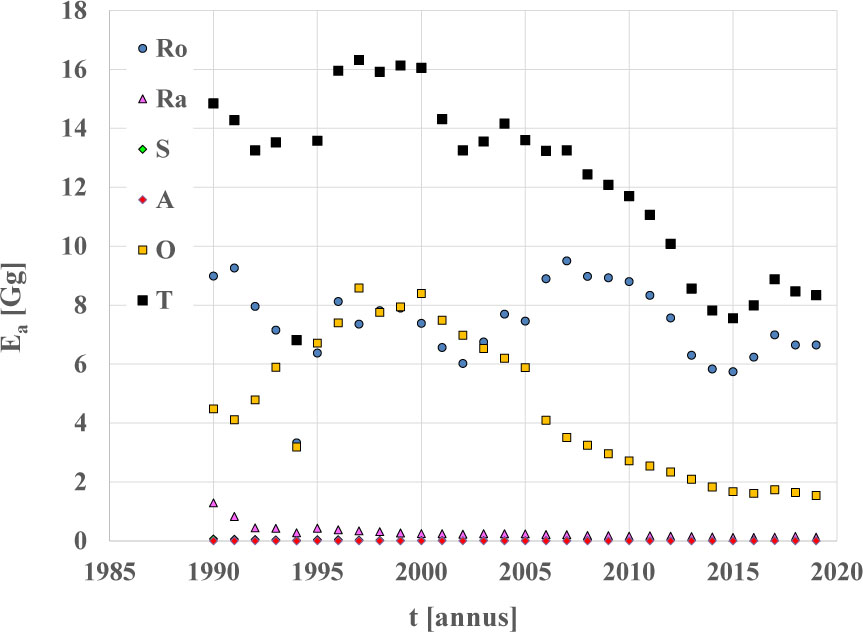
Figure 6
National annual emission – Ea of total particulate matter – TSP for transport categories: Ro - road transport, Ra - rail transport, S - water transport, A - air transport, O - other transport modes, T - total transport
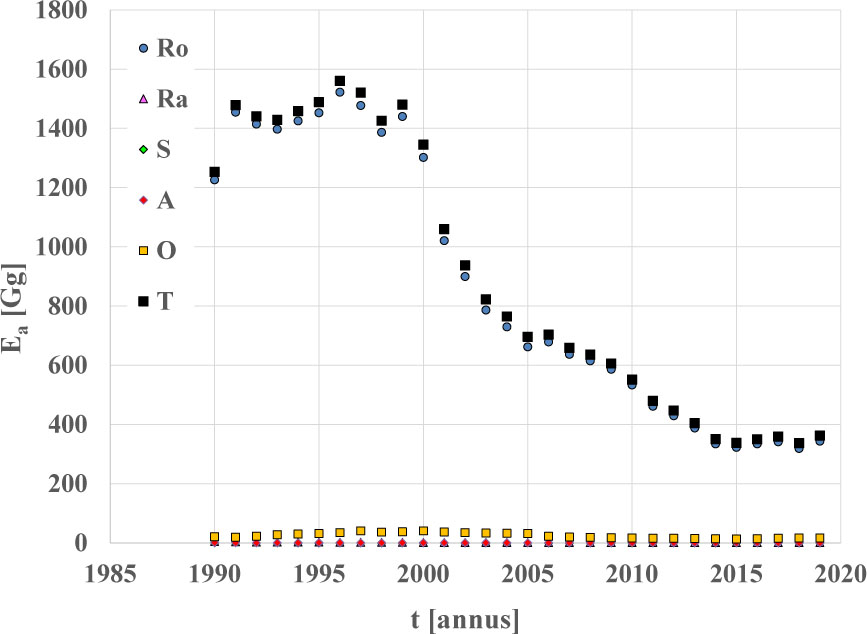
Figure 7
National annual emission – Ea of carbon monoxide – CO for transport categories: Ro - road transport, Ra - rail transport, S - water transport, A - air transport, O - other transport modes, T - total transport
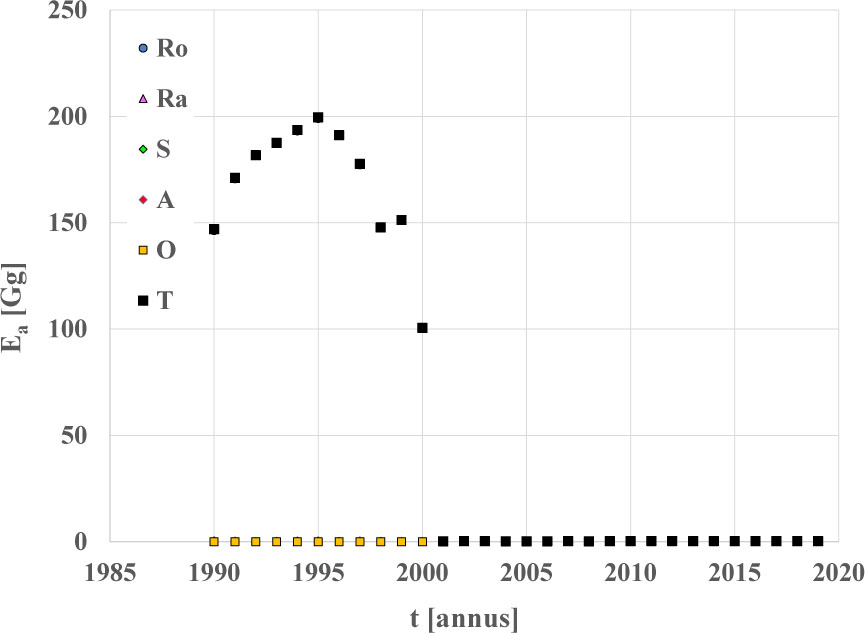
Figure 8
National annual emission – Ea of lead – Pb for transport categories: Ro - road transport, Ra - rail transport, S - water transport, A - air transport, O - other transport modes, T - total transport
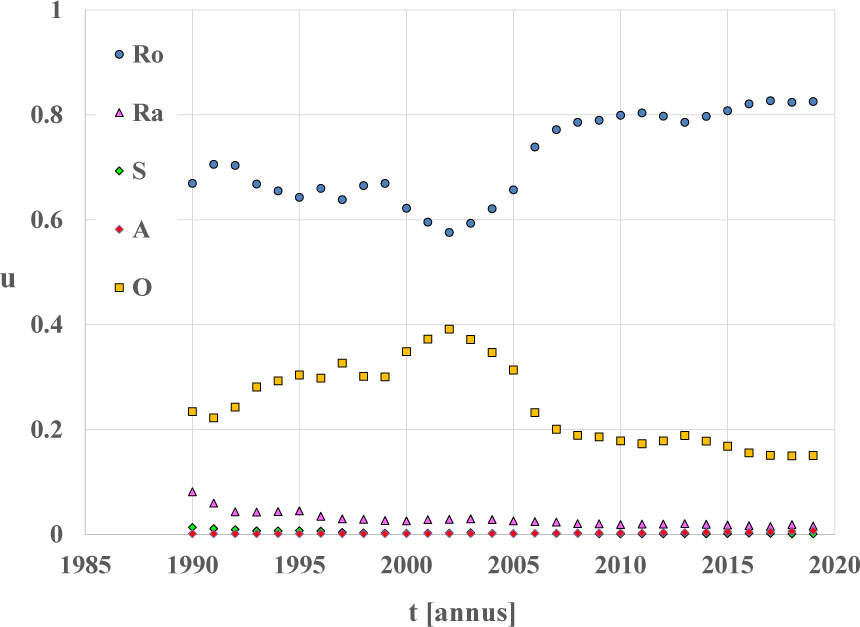
Figure 9
Shares of national annual emissions – u of nitrogen oxides – NOx from individual transport categories: Ro - road transport, Ra - rail transport, S - water transport, A - air transport, O - other transport modes, in the national annual emission from total transport
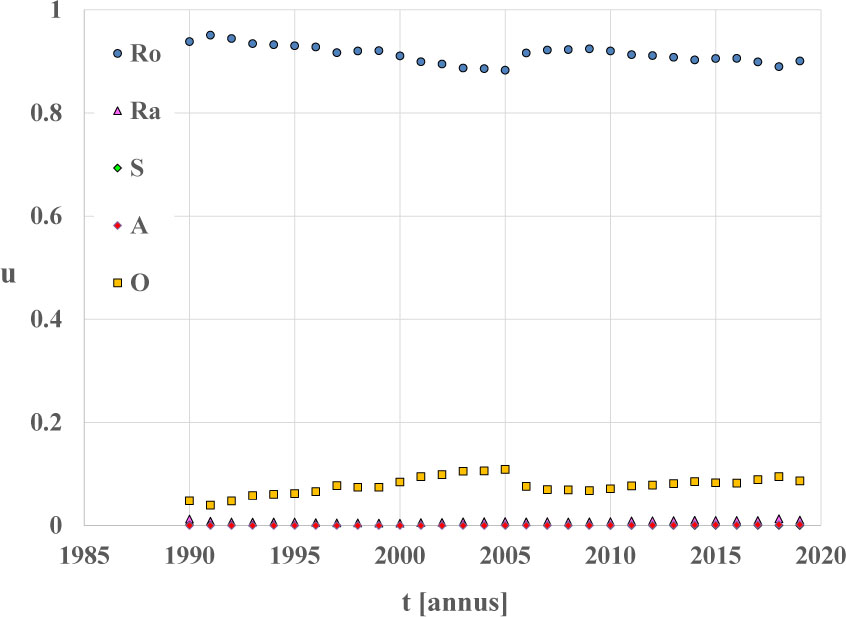
Figure 10
Shares of the national annual emissions – u of non-methane volatile organic compounds – NMVOCs from individual transport categories: Ro - road transport, Ra - rail transport, S - water transport, A - air transport, O - other transport modes, in the national annual emission from total transport
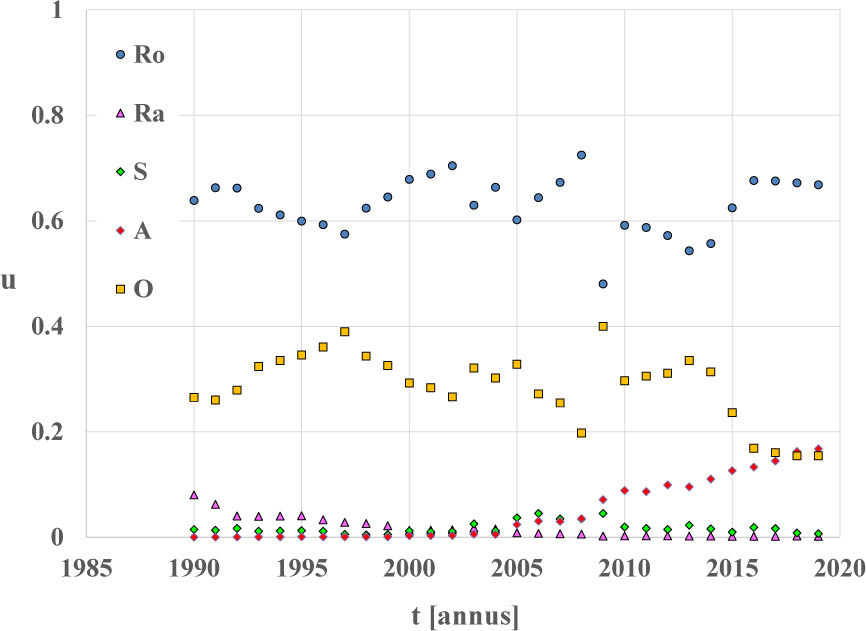
Figure 11
Shares of the national annual emissions – u of sulfur oxides – SOx from individual transport categories: Ro - road transport, Ra - rail transport, S - water transport, A - air transport, O - other transport modes, in the national annual emission from total transport
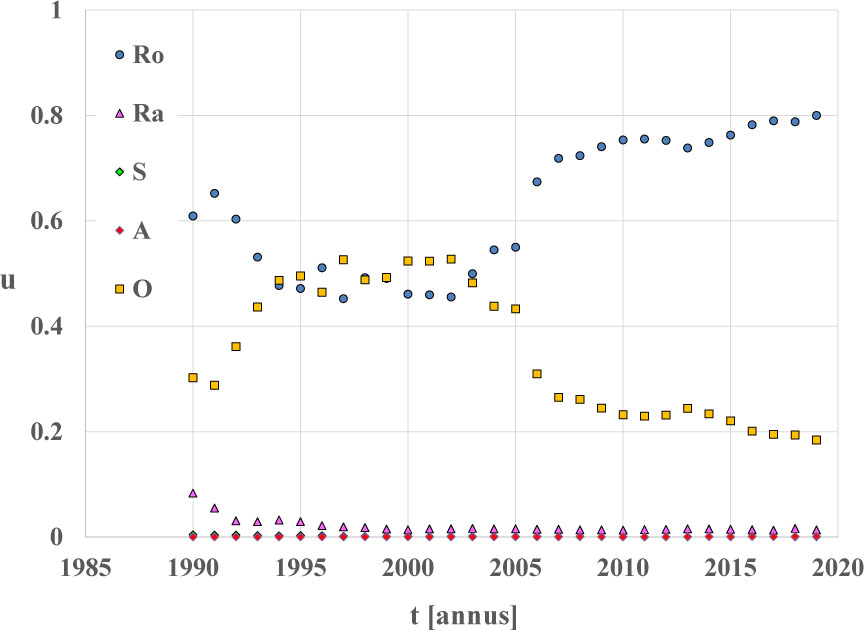
Figure 12
Shares of the national annual emissions – u of particulate matter PM2.5 from individual categories of transport: Ro - road transport, Ra - rail transport, S - water transport, A - air transport, O - other transport modes, in the national annual emission from total transport
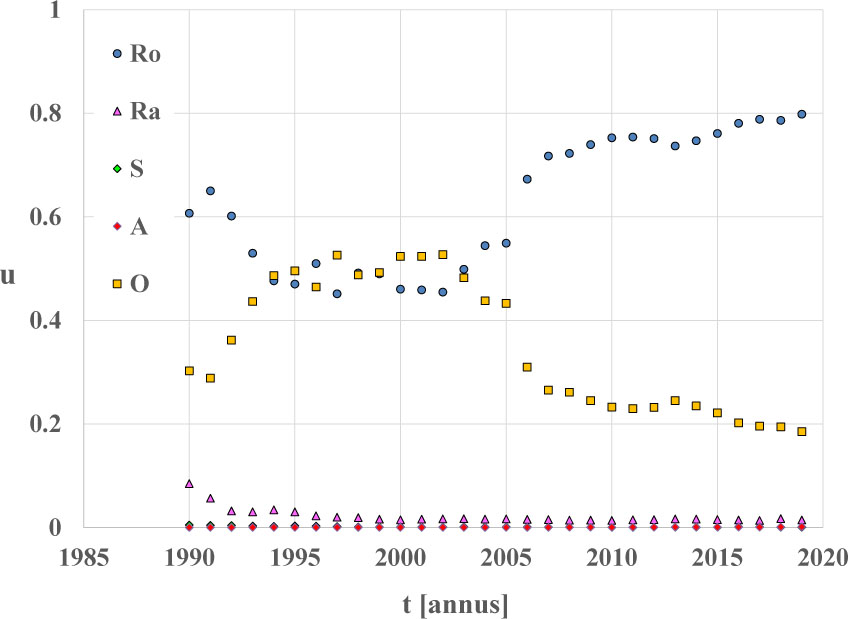
Figure 13
Shares of the national annual emissions – u of PM10 particulate matter from individual transport categories: Ro - road transport, Ra - rail transport, S - water transport, A - air transport, O - other transport modes, in the national annual emission from total transport
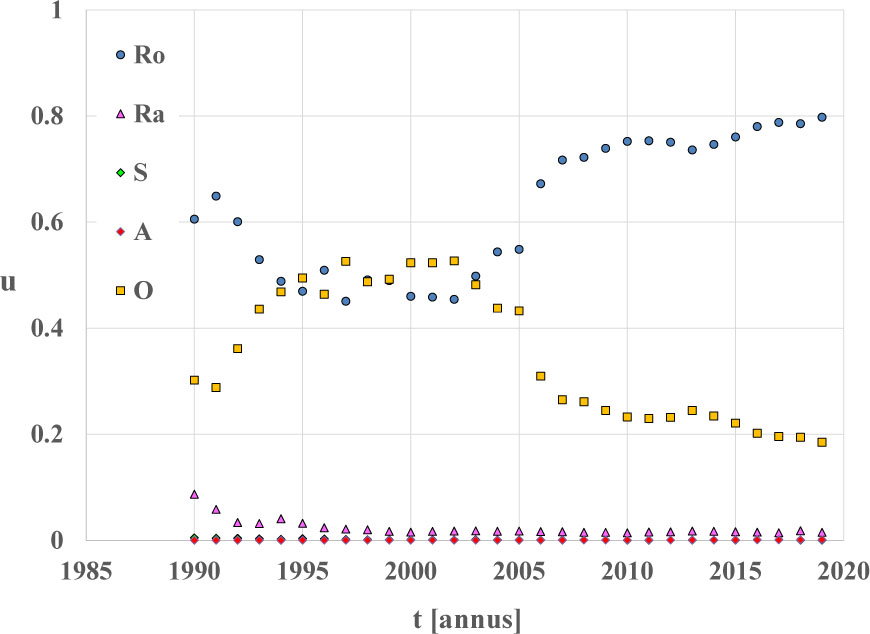
Figure 14
Shares of the national annual emissions – u of total particulate matter – TSP from individual transport categories: Ro - road transport, Ra - rail transport, S - water transport, A - air transport, O - other transport modes, in the national annual emission from total transport
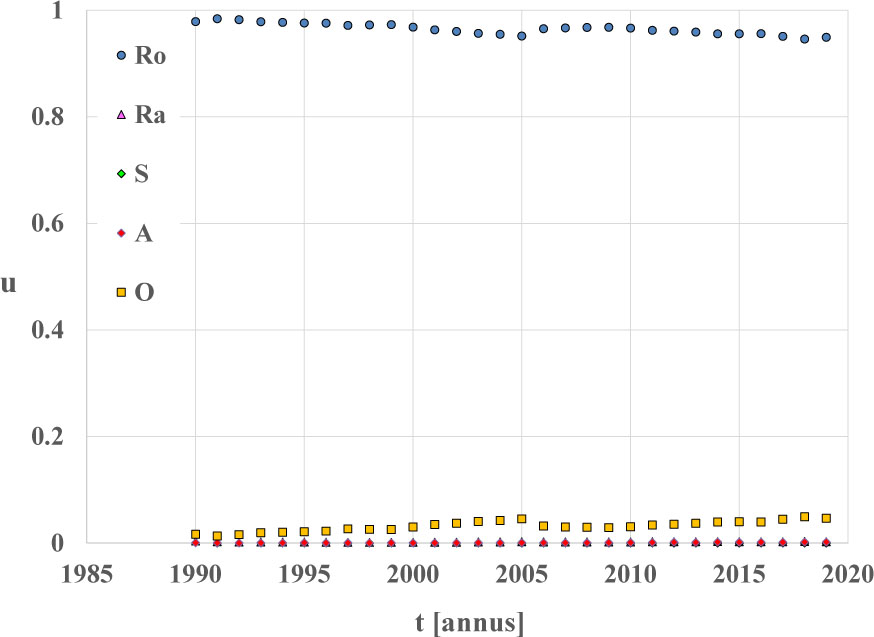
Figure 15
Shares of the national annual emissions – u of carbon monoxide – CO from individual transport categories: Ro - road transport, Ra - rail transport, S - water transport, A - air transport, O - other transport modes, in the national annual emission from total transport
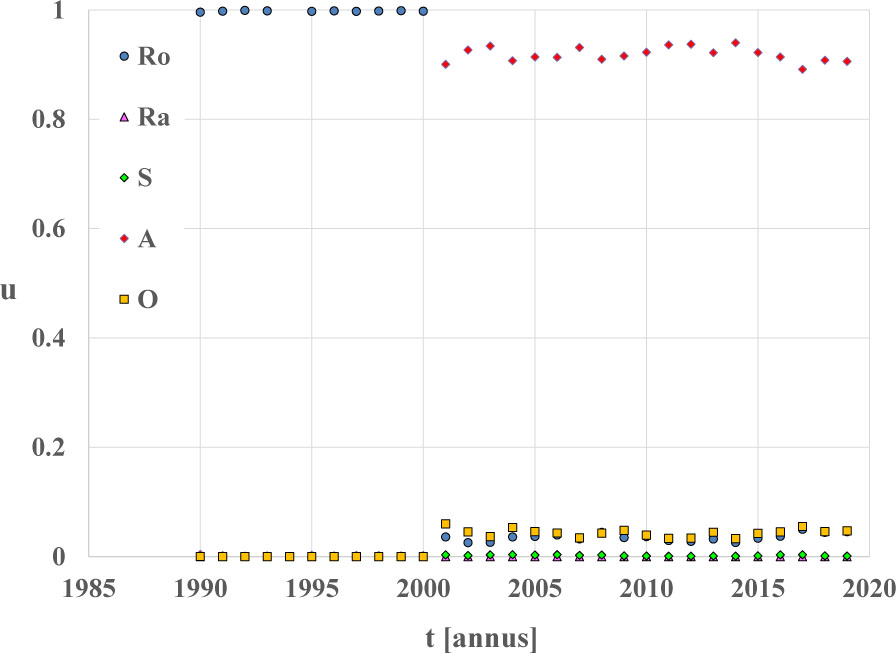
Figure 16
Shares of the national annual emissions – u of lead – Pb from individual transport categories: Ro -road transport, Ra - rail transport, S - water transport, A - air transport, O - other transport modes, in the national annual emission from total transport
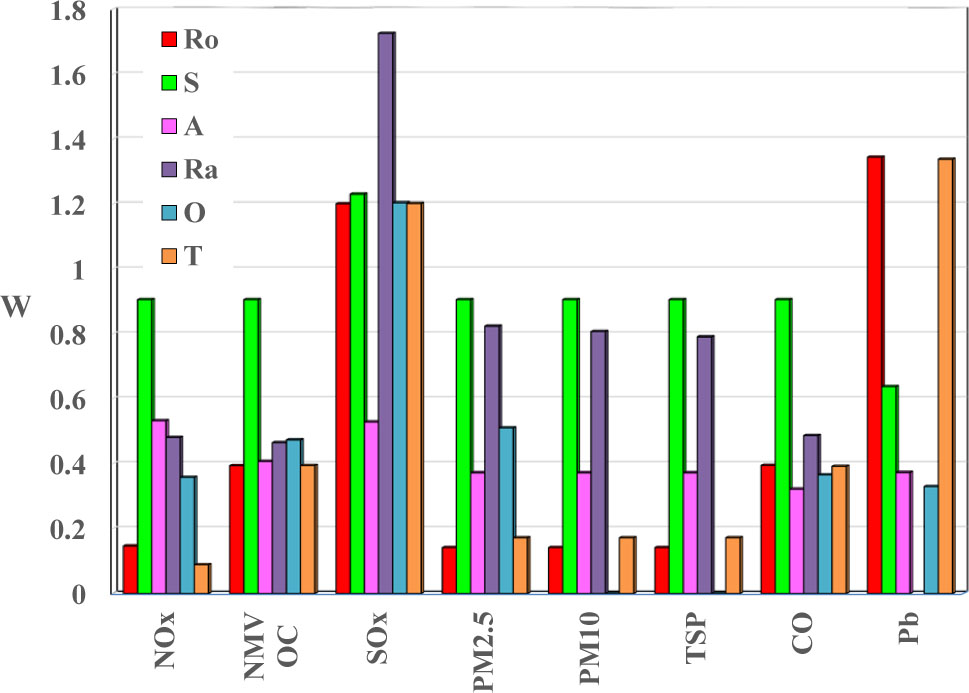
Figure 17
The coefficient of variation – W of the national annual emission of the following pollutants: NOx -nitrogen oxides, NMVOC - non-methane volatile organic compounds, SOx - sulfur oxides, particulate matter PM2.5, particulate matter PM10, total suspended particulate matter TSP, CO - carbon monoxide, and Pb - lead from individual transport categories: Ro - road transport, Ra - rail transport, S - water transport, A - air transport, O -other transport modes, T - total transport
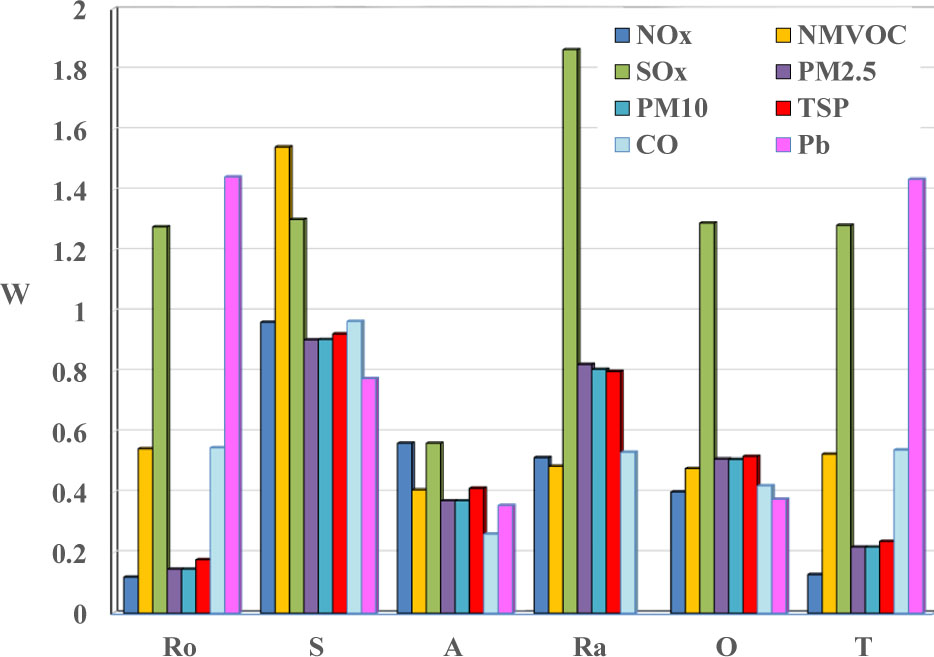
Figure 18
The coefficient of variation – W of the national annual emission of the following pollutants: NOx -nitrogen oxides, NMVOC - non-methane volatile organic compounds, SOx - sulfur oxides, particulate matter PM2.5, particulate matter PM10, total suspended particulate matter TSP, CO - carbon monoxide, and Pb - lead from individual transport categories: Ro - road transport, Ra - rail transport, S - water transport, A - air transport, O -other transport modes, T - total transport
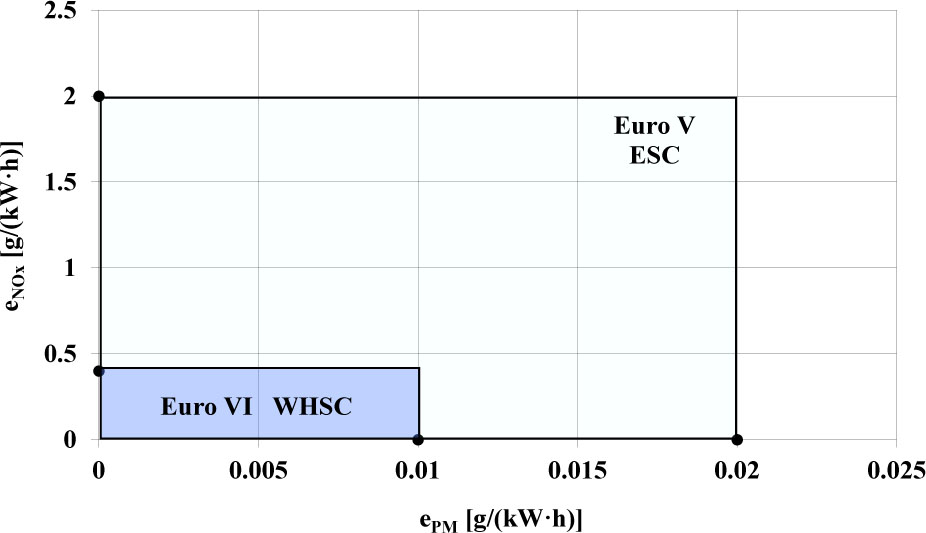
Figure 19
Specific emission values for nitrogen oxides and particulate matter from compression ignition engines of vehicles with the reference mass higher than 2.61 Mg (trucks and buses) in static tests (ESC for Euro V regulation level and WHSC for Euro VI regulation level)
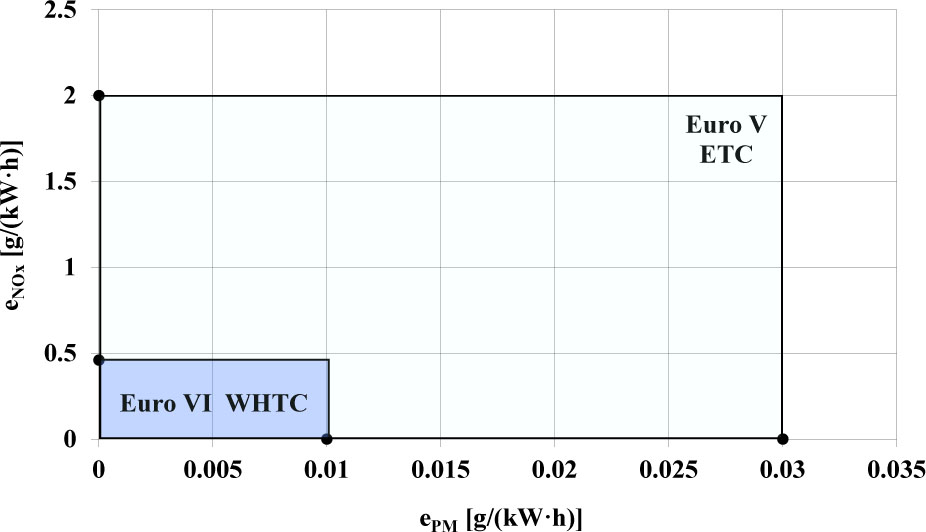
Figure 20
Specific emission values for nitrogen oxides and particulate matter from compression ignition engines of vehicles with the reference mass higher than 2.61 Mg (heavy duty trucks and buses) in dynamic tests (ETC for Euro V regulation level and WHTC for Euro VI regulation level)