
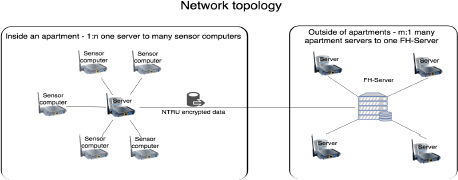
Figure 1
Network topology of measuring sensor systems.
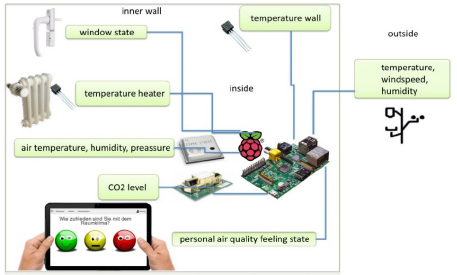
Figure 2
Example of a measuring system in an apartment.
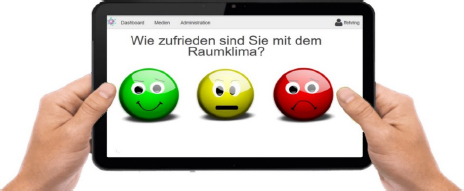
Figure 3
Visual display unit logging personal room climate feelings AQF.
Table 1
Ranges of sensor data as good, neutral and bad.
| DIN standard ranges for winter | |||||||
|---|---|---|---|---|---|---|---|
| Features | Unit | Range good | Range neutral | Range bad | |||
| RHin | [%] | 40 | 68 | 40 | 62 | <40 | >70 |
| Tair | [ºC] | 21 | 23 | 20 | 24 | <20 | >24 |
| CO2 | [ppm] | 0 | 1,000 | 1,000 | 2,000 | 2,000 | >2,000 |
| Twall | [ºC] | 13 | 23 | 23 | 35 | >13 | >35 |
| DIN standard ranges for summer | |||||||
| Features | Unit | Range good | Range neutral | Range bad | |||
| RHin | [%] | 40 | 62 | 40 | 55 | <40 | >70 |
| Tair | [ºC] | 23.50 | 25.50 | 22 | 26 | <22 | >26 |
| CO2 | [ppm] | 0 | 1,000 | 1,000 | 2,000 | 2,000 | >2,000 |
| Twall | [ºC] | 13 | 23 | 23 | 35 | >13 | >35 |
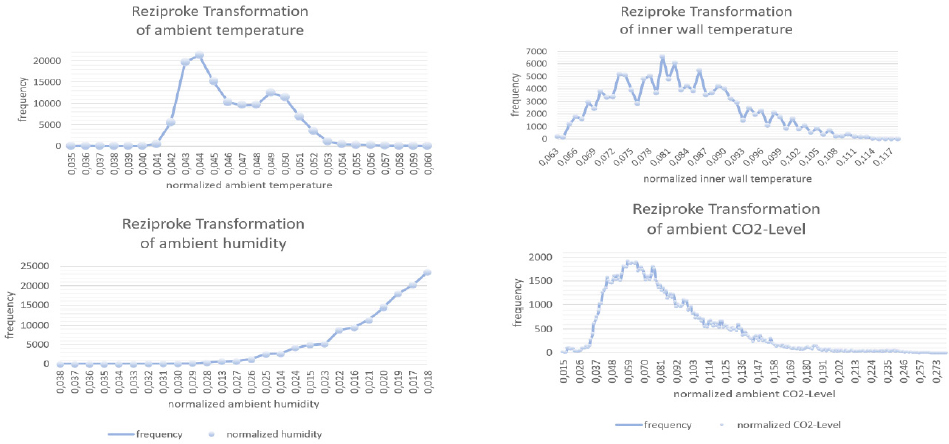
Figure 4
Interpolation and normalisation within reciprocal transformations.
Table 2
Overview of minima and maxima of collected measurement datasets for winter and summer season.
| Features | Unit | Winter ranges | Summer ranges | ||
|---|---|---|---|---|---|
| STwindow | [state] | 0.00 | 2.00 | 0.00 | 2.00 |
| RHin | [%] | 14.27 | 77.10 | 35.71 | 67.45 |
| p | [hPa] | 960.33 | 1029.31 | 1006.13 | 1015.32 |
| Tair | [ºC] | 15.89 | 28.66 | 21.48 | 28.93 |
| Wout | [km/h] | 0.00 | 11.40 | 0.10 | 2.35 |
| Tout | [ºC] | −10.50 | 17.60 | 14.70 | 32.70 |
| RHout | [%] | 22.20 | 99.00 | 30.70 | 86.20 |
| CO2 | [ppm] | 350.00 | 6865.00 | 400.00 | 1230.00 |
| Theat | [ºC] | 14.13 | 54.44 | 22.56 | 28.94 |
| Twall | [ºC] | 8.50 | 27.31 | 24.13 | 32.06 |
| AQF | [state] | 0.00 | 2.00 | 0.00 | 2.00 |
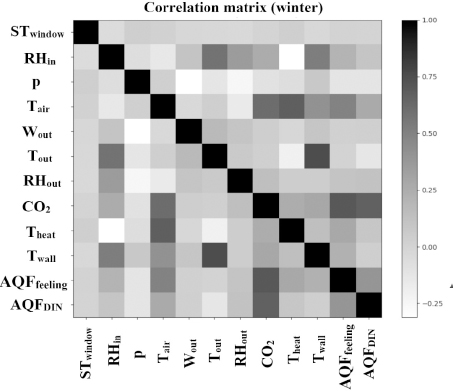
Figure 5
Correlation matrix on winter datasets.
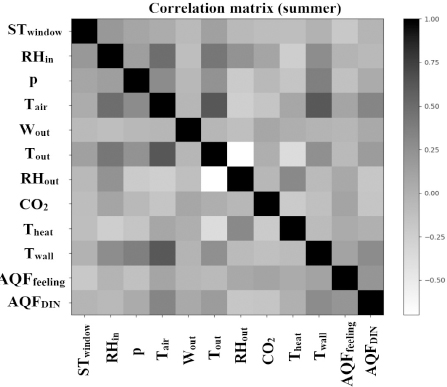
Figure 6
Correlation matrix on summer datasets.
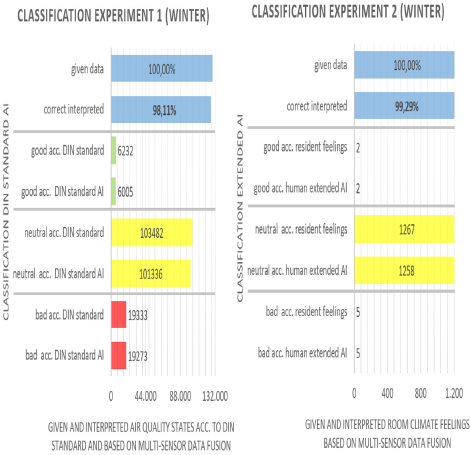
Figure 7
Comparing suitability of AIDIN-winter according to the DIN standard.
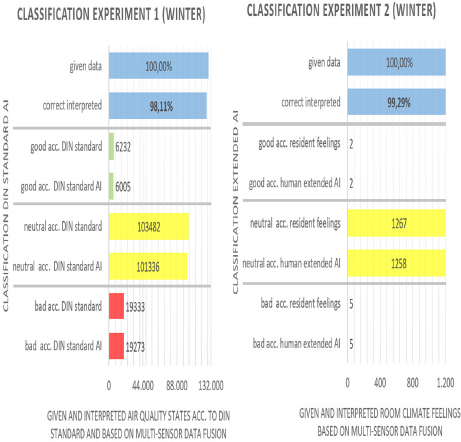
Figure 8
Comparing suitability of AIextended-winter according to the air feeling.
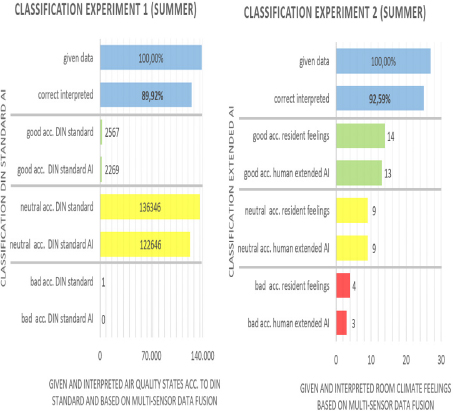
Figure 9
Comparing suitability of AIDIN-summer according to the DIN standard.
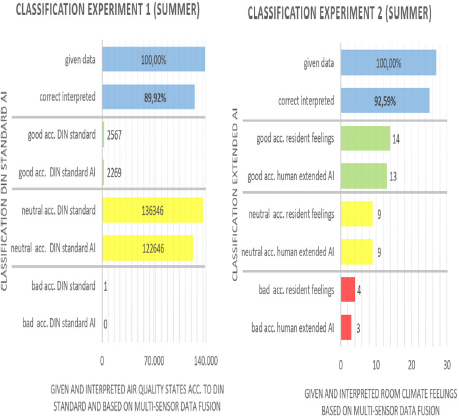
Figure 10
Comparing suitability of AIextended-summer according to the air feeling.