
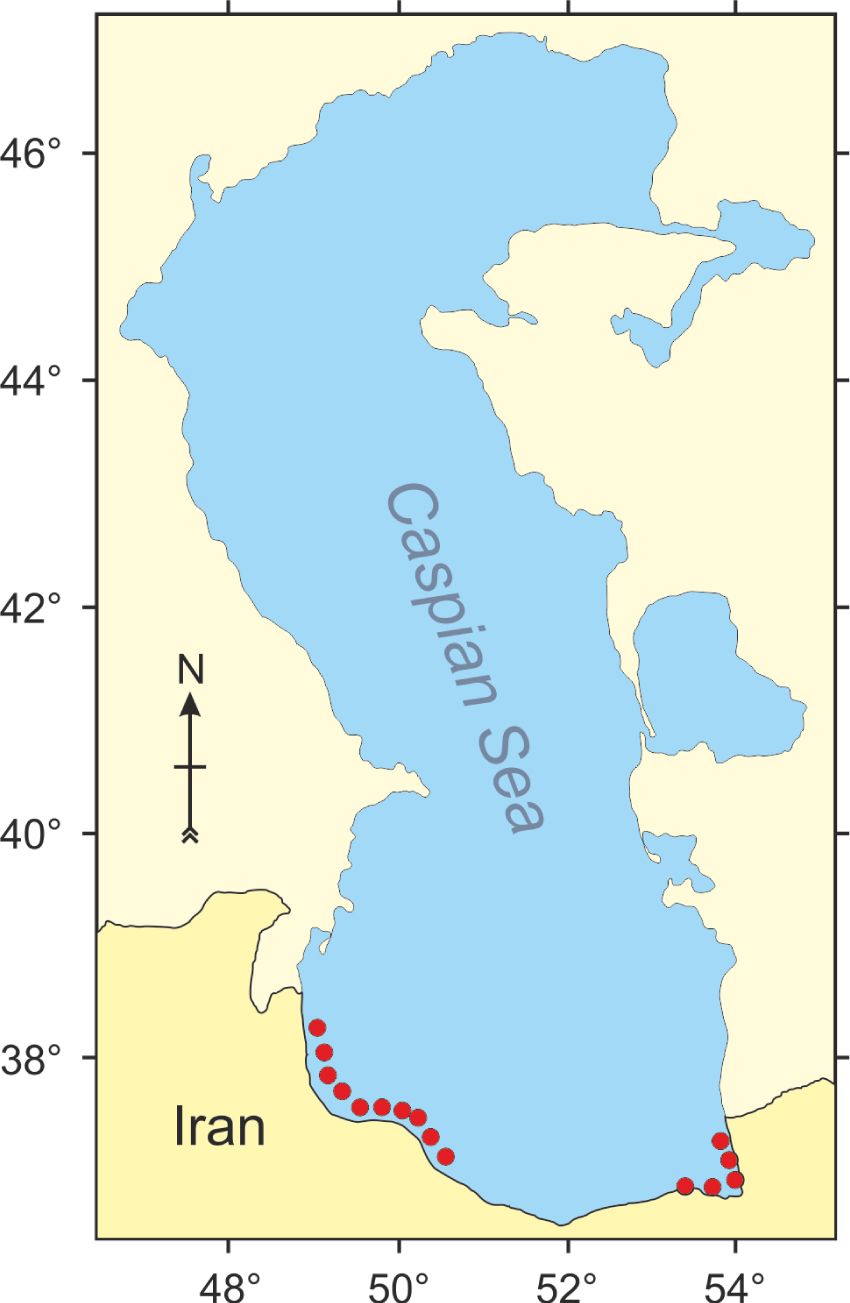
Figure 1
Sampling locations (red closed circles) of sturgeon in the Iranian coastal waters of the Caspian Sea
Table 1
Descriptive length and weight composition of male and female great sturgeon from the Iranian waters of the Caspian Sea in 2008–2010
| Size | Sex | Number | Mean | Standard error of the mean | Minimum | Maximum |
|---|---|---|---|---|---|---|
| Fork Length (cm) | Female | 33 | 214.17 | 7.06 | 84 | 305 |
| Male | 24 | 194.17 | 8.10 | 84 | 255 | |
| Weight (kg) | Female | 33 | 111.26 | 10.70 | 4 | 287 |
| Male | 24 | 69.77 | 6.72 | 4 | 141 |
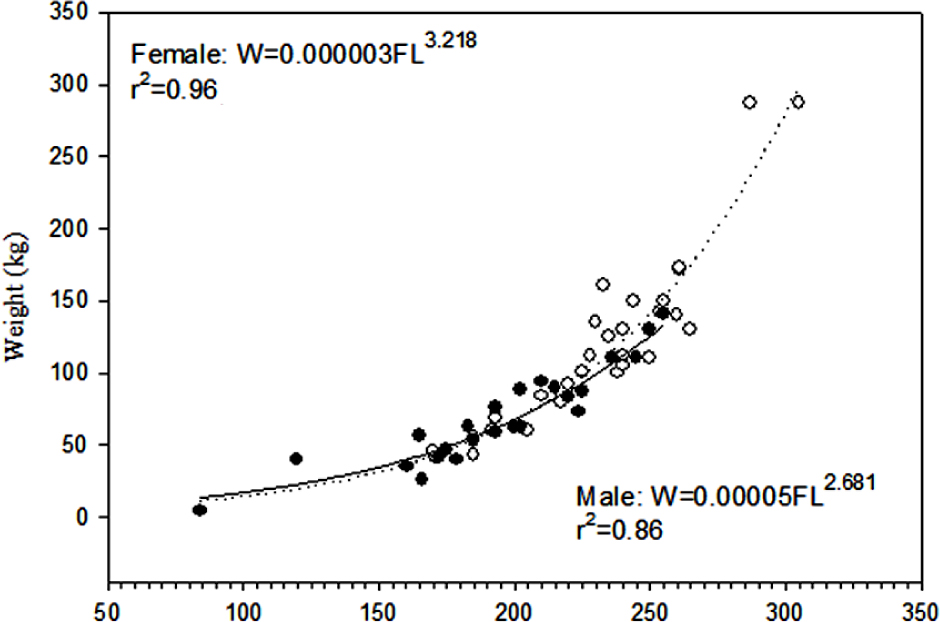
Figure 2
Length–weight relationship for female (open circles and dotted line) and male (closed circles and solid line) great sturgeon in the Iranian coastal waters of the Caspian Sea; W = gutted weight (kg); FL = fork length (cm)
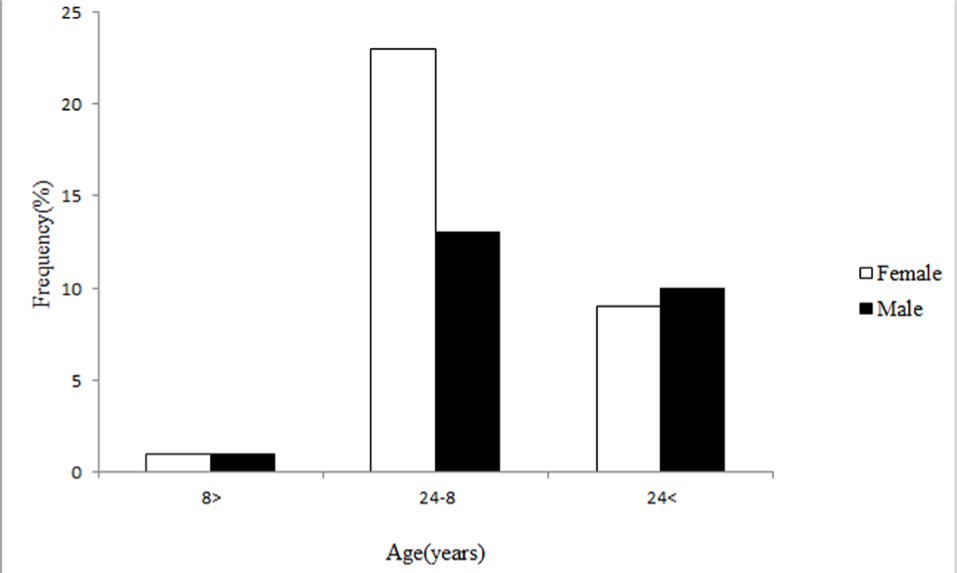
Figure 3
Age composition for female and male great sturgeon between 2008 and 2010 in the Iranian coastal waters of the Caspian Sea (n = 105). Arrows indicate the direction in which the observed frequencies differed from those expected under the assumption that the age class was uncorrelated with sex.
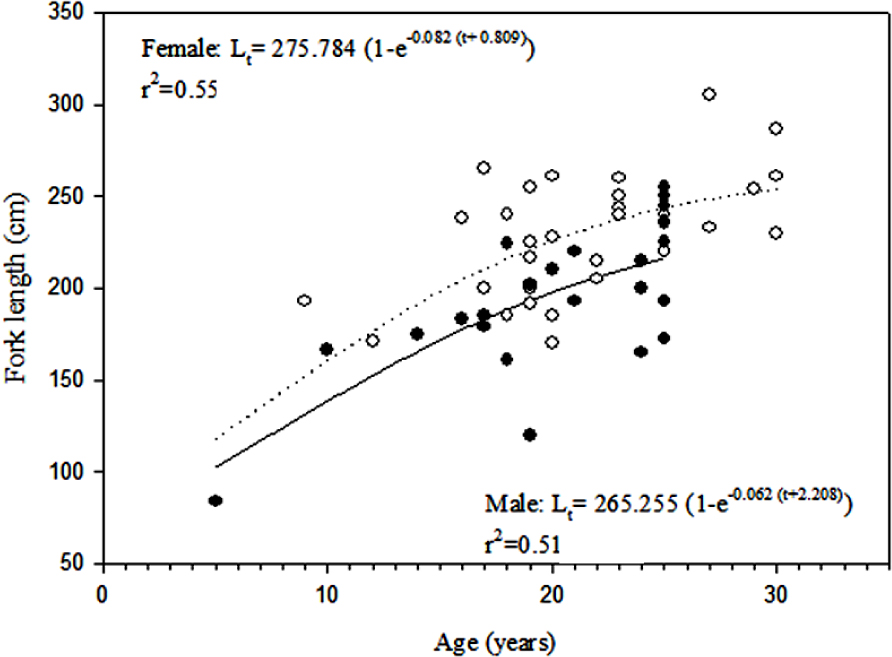
Figure 4
The von Bertalanffy growth function fit to size-at-age relationships for female (open circles and dotted line) and male (closed circles and solid line) great sturgeon in the Iranian coastal waters of the Caspian Sea; Lt = fork length (cm)
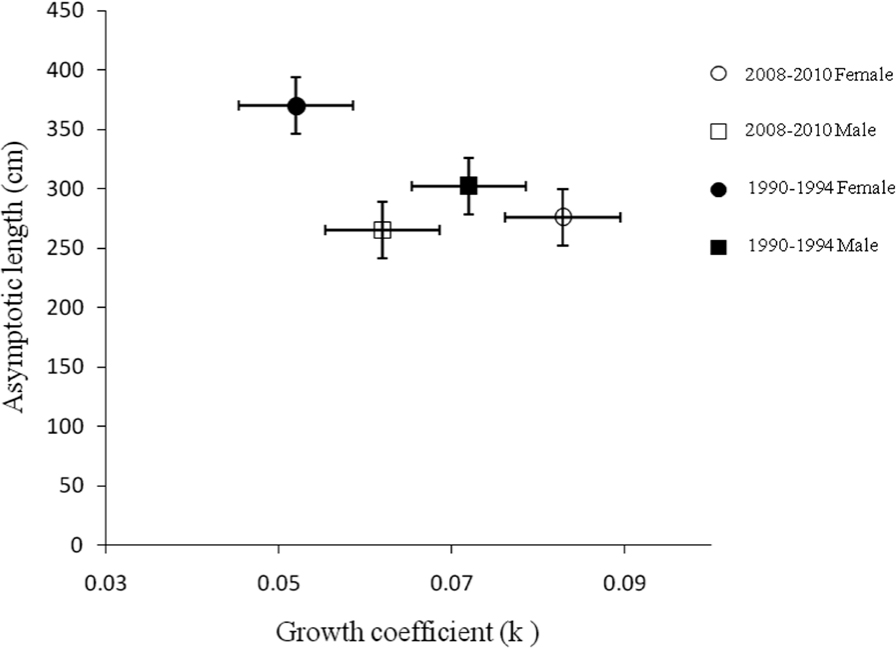
Figure 5
Confidence regions (95%) of mean estimates for the growth parameters (K and L∞) for males and females of great sturgeon in1990–1994 and in 2008–2010 in the Iranian coastal waters of the Caspian Sea