
Figure 1
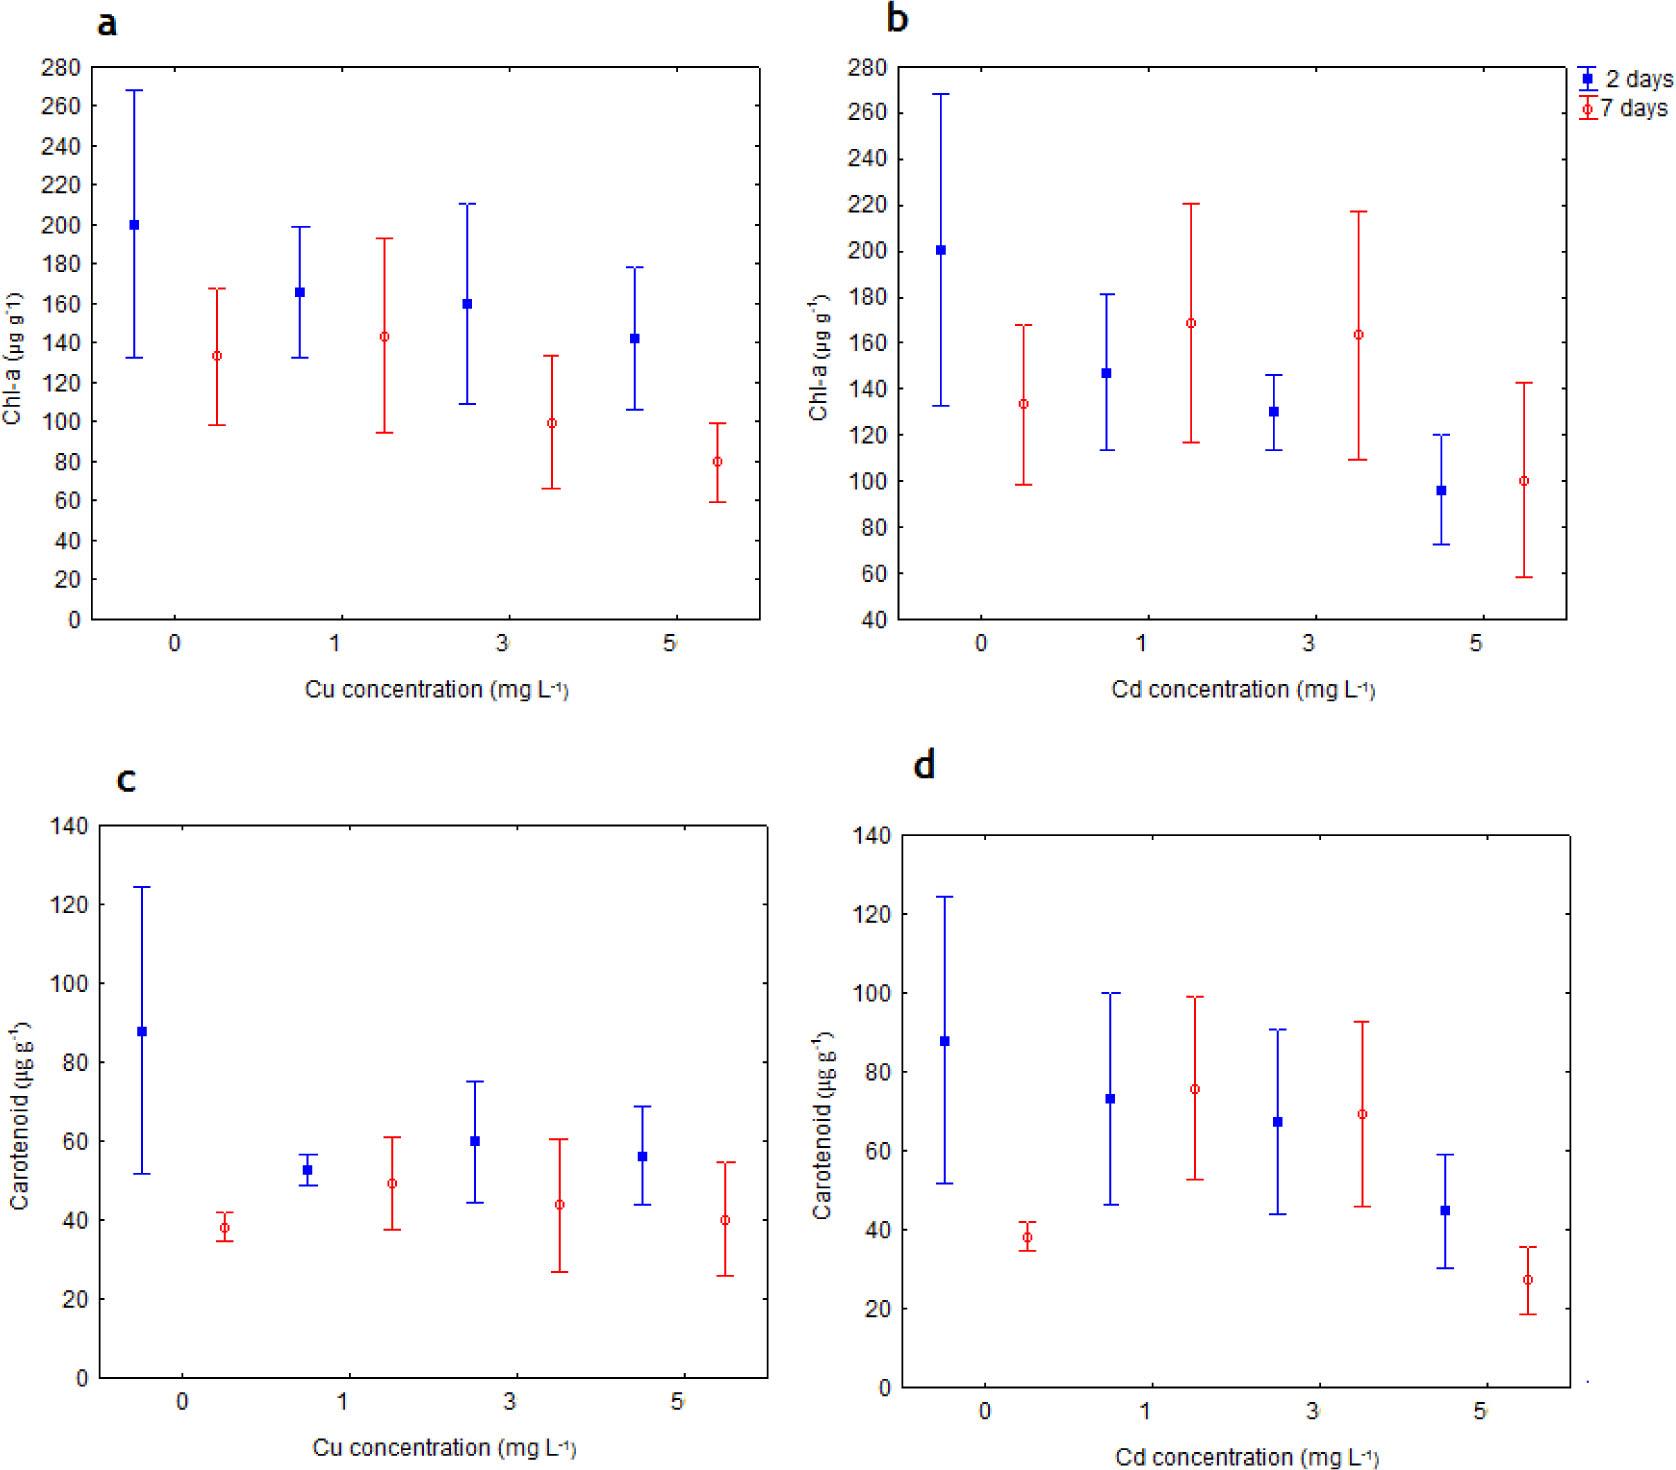
Figure 2

Figure 3
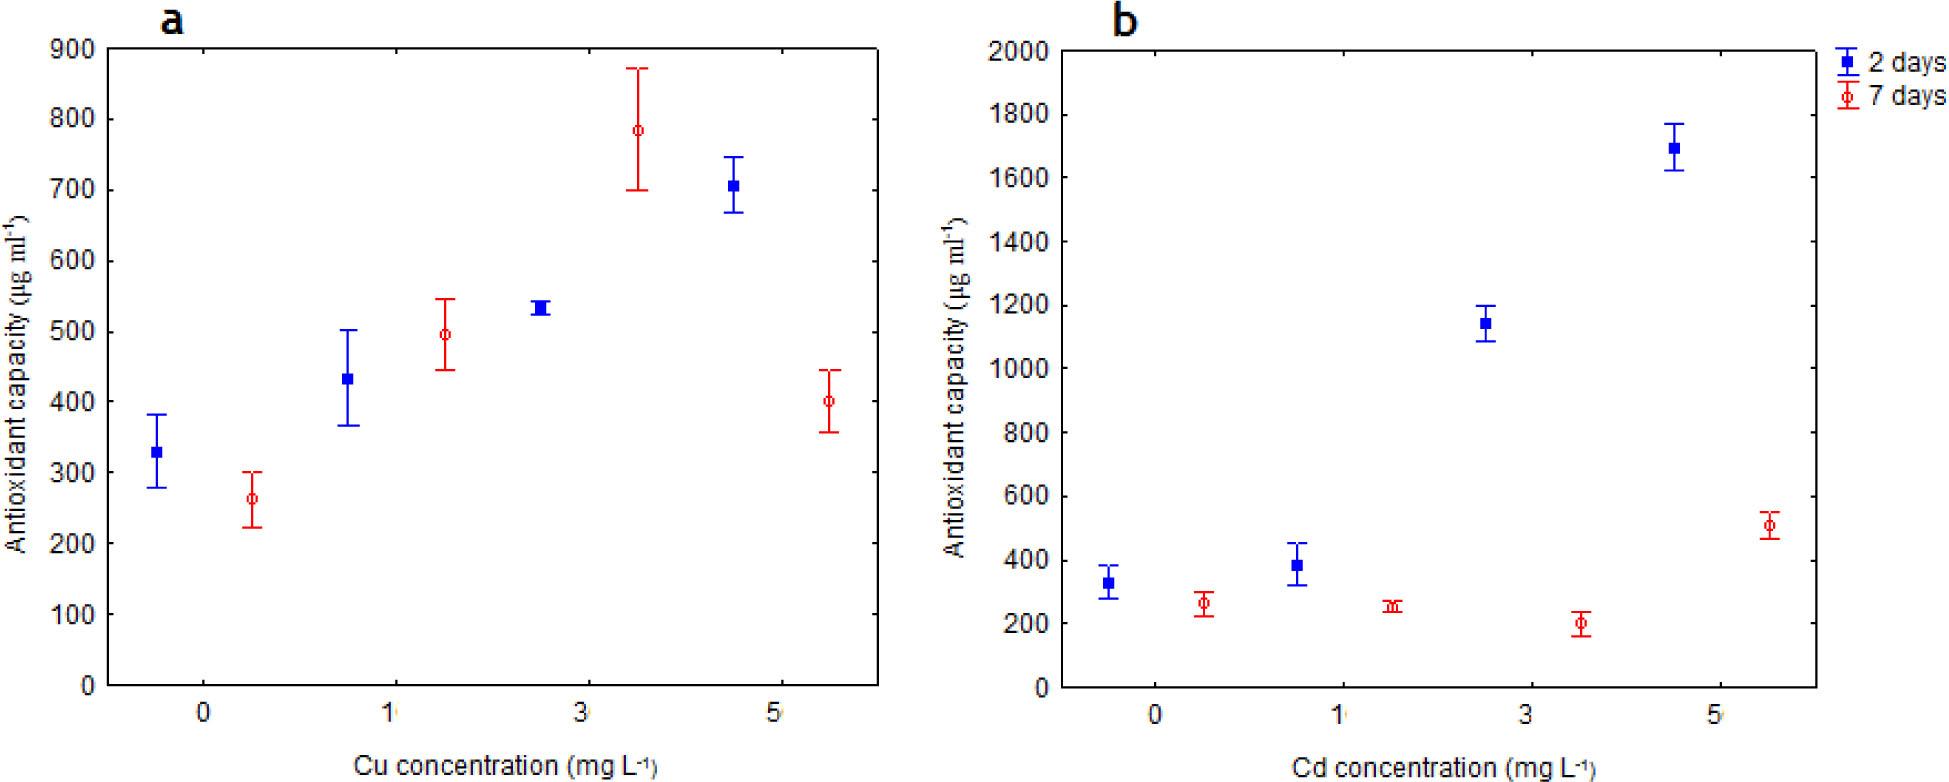
Figure 4

Figure 5

Three-way ANOVA results showing the variations in antifouling defense and physiological parameters of the macroalga U_ reticulata treated with copper and cadmium_ Treatment concentration (0, 1, 3 and 5 mg l−1), duration (2 and 7 days) and metals (copper and cadmium) were used as factors for ANOVA (p < 0_05 = significant)_
| Factors | df | P. shioyasakiensis | V. harveyi | Chl-a | Carotenoids | Phenol | Total antioxidant capacity | ||||||
|---|---|---|---|---|---|---|---|---|---|---|---|---|---|
| F | p | F | p | F | p | F | p | F | p | F | p | ||
| Concentration | 3 | 18.68 | 0.000 | 15.15 | 0.000 | 1.57 | 0.213 | 1.02 | 0.395 | 1.40 | 0.258 | 89.65 | 0.000 |
| Days | 1 | 40.29 | 0.000 | 0.91 | 0.345 | 1.61 | 0.213 | 3.48 | 0.070 | 18.08 | 0.000 | 133.51 | 0.000 |
| Metals | 1 | 0.15 | 0.695 | 1.98 | 0.168 | 0.00 | 0.934 | 0.48 | 0.490 | 9.10 | 0.004 | 16.22 | 0.000 |
| Concentration × Days | 3 | 8.08 | 0.000 | 1.42 | 0.253 | 0.44 | 0.723 | 1.22 | 0.317 | 2.07 | 0.123 | 40.36 | 0.000 |
| Concentration × Metals | 3 | 0.52 | 0.666 | 0.77 | 0.517 | 0.08 | 0.970 | 0.66 | 0.582 | 1.99 | 0.134 | 34.77 | 0.000 |
| Days × Metals | 1 | 7.98 | 0.008 | 2.28 | 0.140 | 1.38 | 0.248 | 0.08 | 0.776 | 5.68 | 0.023 | 120.35 | 0.000 |
| Concentration × Days × Metals | 3 | 4.98 | 0.006 | 3.03 | 0.043 | 0.20 | 0.889 | 0.04 | 0.984 | 1.25 | 0.306 | 29.64 | 0.000 |
| Error | 32 | ||||||||||||
| Total | 47 | ||||||||||||
Two-way ANOVA of bioaccumulation of copper and cadmium in the macroalga U_ reticulata_ Treatment concentration and duration were used as factors (p < 0_05 = significant)_
| Factors | df | Cu accumulation | Cd accumulation | ||
|---|---|---|---|---|---|
| F | p | F | p | ||
| Concentration | 3 | 58.427 | 0.000 | 35.030 | 0.000 |
| Days | 1 | 229.51 | 0.000 | 68.458 | 0.000 |
| Concentration × Days | 3 | 59.790 | 0.000 | 37.720 | 0.000 |
| Error | 16 | ||||
| Total | 23 | ||||
Correlation between metal accumulation and physiological parameters of the macroalga U_ reticulata (p < 0_05 = significant)_
| Metal accumulation | Chl-a | Carotenoid | Total phenol | Antioxidant capacity |
|---|---|---|---|---|
| Copper | −0.444* | −0.264 | −0.481* | 0.208 |
| Cadmium | −0.178 | −0.277 | −0.356 | 0.158 |
Post-hoc Tukey HSD test results for the effects of different concentrations of copper and cadmium on the macroalga U_ reticulata (p < 0_05 = significant)
| Factor 1 | Factor 2 | Total antioxidant activity | Bacterial growth P. shioyasakiensis | Bacterial growth V. harveyi | |||
|---|---|---|---|---|---|---|---|
| Cu-treated samples | Cd-treated samples | Cu-treated algal extracts | Cd-treated algal extracts | Cu-treated algal extracts | Cd-treated algal extracts | ||
| Control | 1 mg l−1 | 0.049 | 0.966 | 0.028 | 0.001 | 0.001 | 0.000 |
| 3 mg l−1 | 0.000 | 0.000 | 0.020 | 0.007 | 0.001 | 0.005 | |
| 5 mg l−1 | 0.000 | 0.000 | 0.000 | 0.001 | 0.075 | 0.001 | |
| 1 mg l−1 | 3 mg l−1 | 0.013 | 0.000 | 1.000 | 0.999 | 1.000 | 0.981 |
| 5 mg l−1 | 0.668 | 0.000 | 0.669 | 1.000 | 0.811 | 0.999 | |
| 3 mg l−1 | 5 mg l−1 | 0.473 | 0.000 | 0.755 | 0.999 | 0.789 | 0.999 |
Correlation between bacterial growth and physiological parameters of the macroalga U_ reticulate (p < 0_05 = significant)_ Bioaccumulation of copper and cadmium was also used in correlation analysis_
| Copper-treated samples | P. shioyasakiensis | V. harveyi | Cadmium-treated samples | P. shioyasakiensis | V. harveyi |
|---|---|---|---|---|---|
| Antioxidant capacity | 0.39 | 0.31 | Antioxidant capacity | 0.44* | 0.39 |
| Total phenol | 0.20 | −0.37 | Total phenol | 0.38 | 0.29 |
| Chl-a | 0.16 | −0.13 | Chl-a | −0.05 | −0.19 |
| Carotenoid | 0.05 | −0.08 | Carotenoid | 0.05 | 0.02 |
| Cu accumulation | −0.43* | 0.43* | Cd accumulation | −0.008 | 0.047 |