
Figure 1

Figure 2
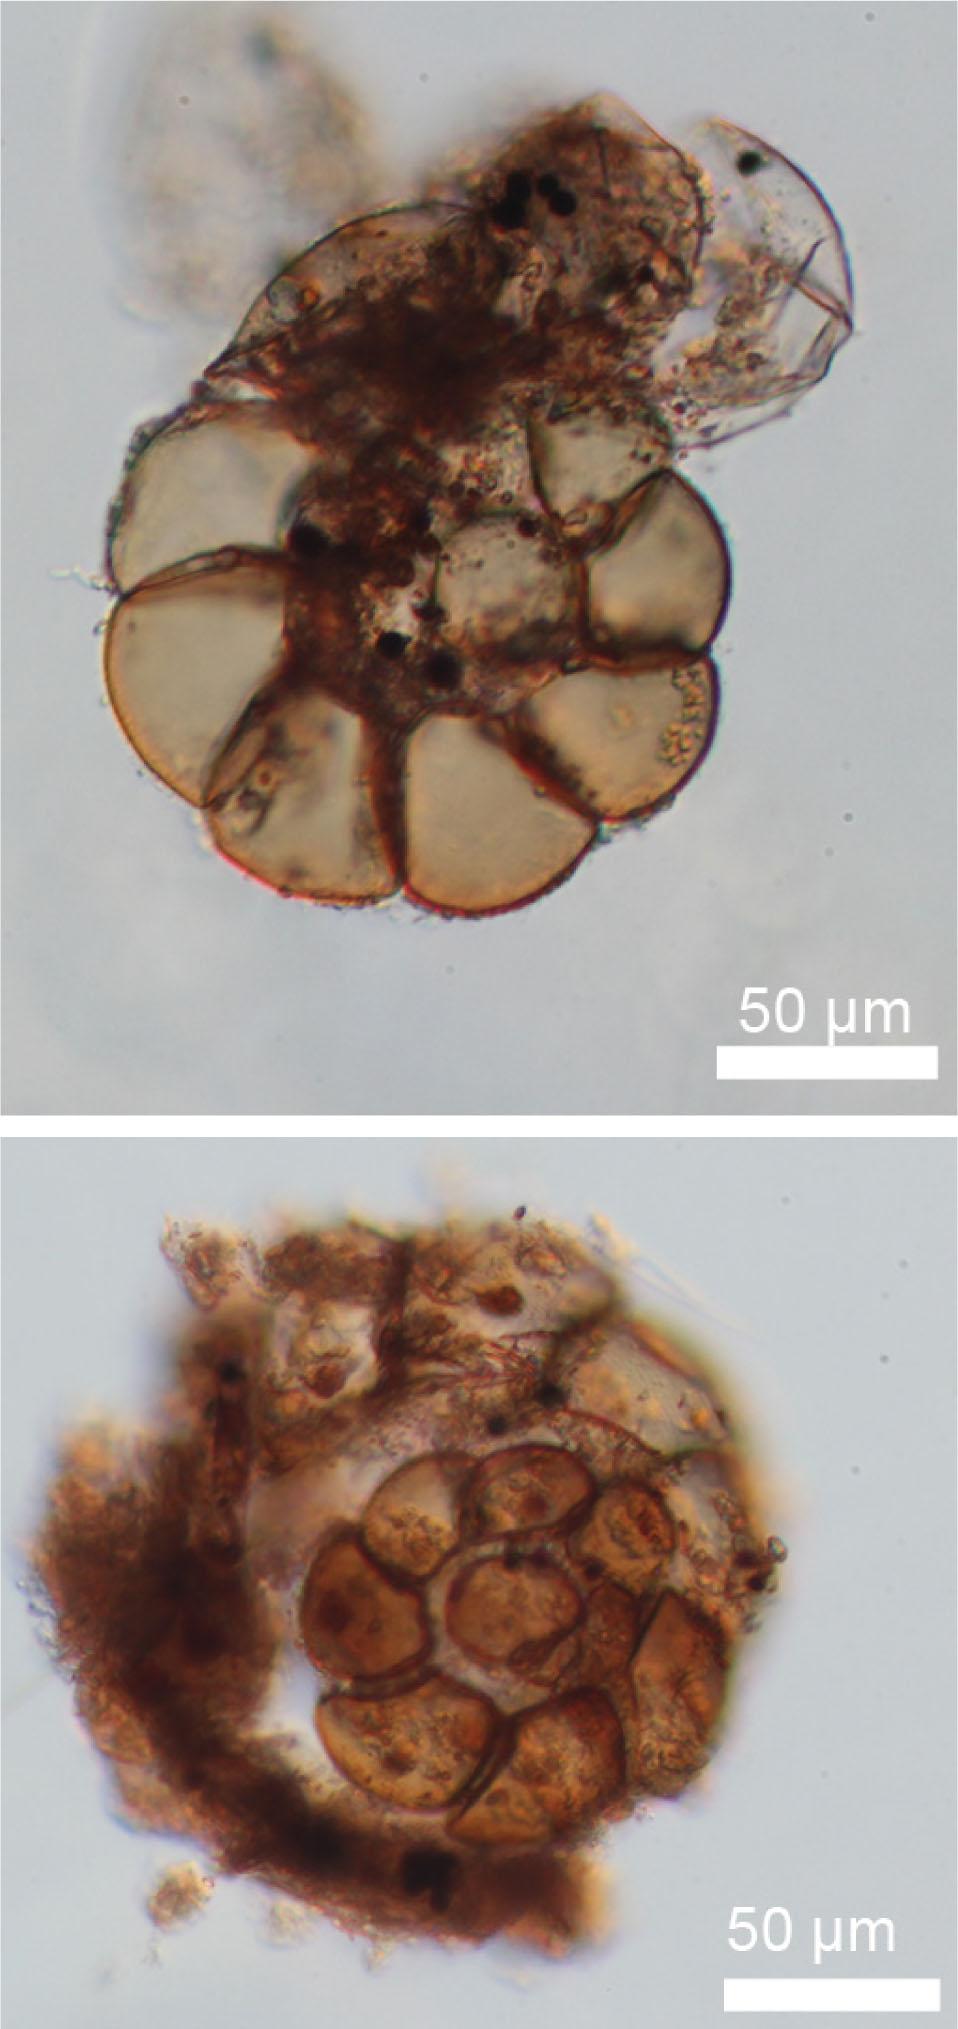
Figure 3
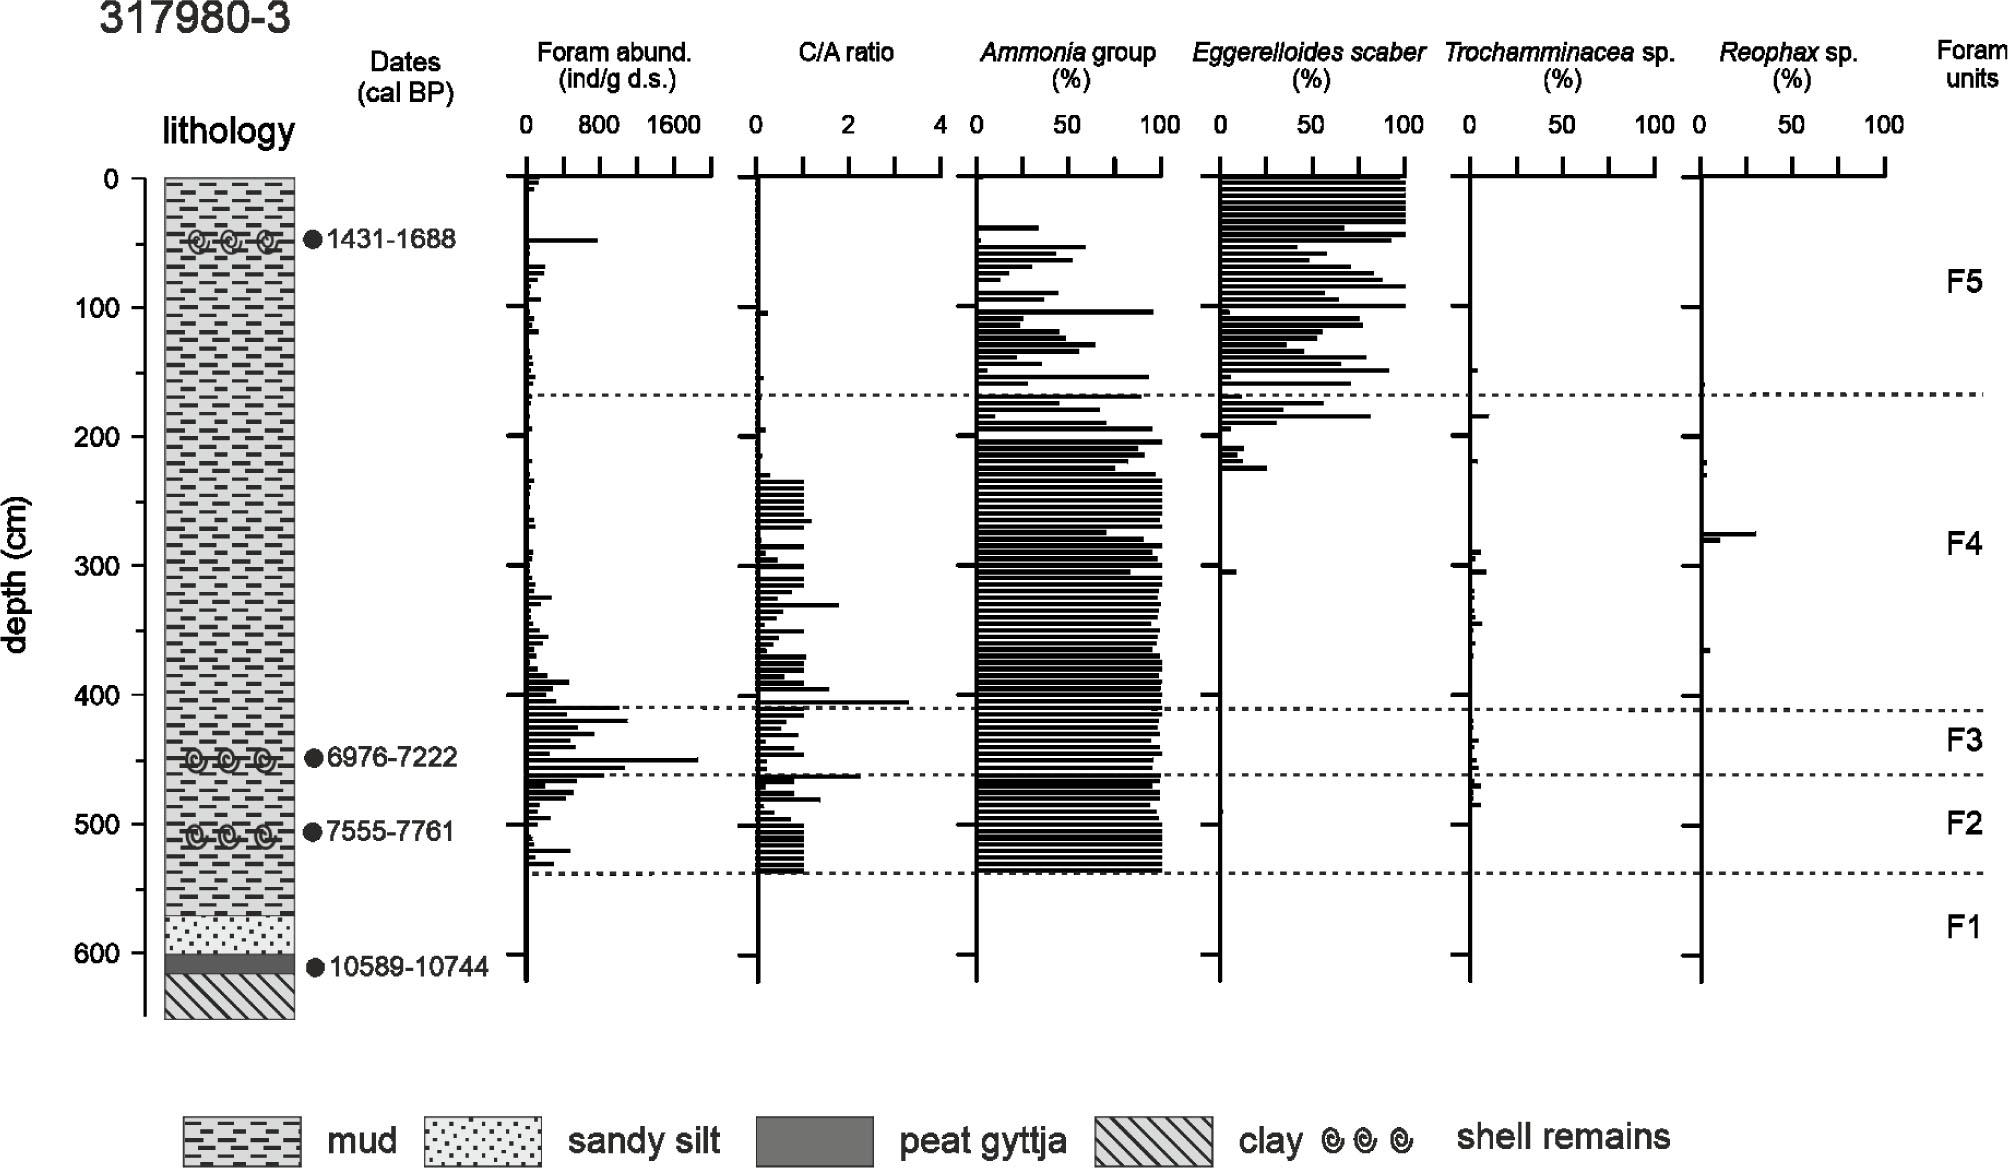
Figure 4

Results of Canonical Correlation Analysis
| Dimensions | ||||
|---|---|---|---|---|
| 1 | 2 | 3 | 4 | |
| Cumulative percentage of variance explained | 0.82 | 0.92 | 0.96 | 0.99 |
| Environmental parameters | ||||
| Si ter | −0.28 | 0.02 | −0.10 | 0.87 |
| Si biog | 0.56 | −0.66 | −0.20 | −0.41 |
| Mg | 0.58 | −0.01 | 0.01 | −0.56 |
| LOI | −0.30 | 0.21 | −0.05 | −0.91 |
| Ca | 0.23 | 0.25 | −0.21 | 0.05 |
| Mean grain size | 0.20 | 0.87 | −0.08 | 0.34 |
| Foraminifera taxa | ||||
| Ammonia group | 0.77 | −0.61 | −0.18 | −0.02 |
| Eggerelloides scaber | −0.76 | −0.55 | −0.32 | −0.06 |
| Trochamminacea | 0.55 | 0.07 | −0.80 | 0.25 |
| Reophax sp. | 0.33 | 0.05 | −0.65 | −0.69 |
Foraminifera-based stratigraphy of Core 317980-3
| Foraminifera – based unit (F) and age (cal yrs BP) | Core layer (cm) | Assemblage characteristics | Sediment characteristics | Notes and comments |
|---|---|---|---|---|
| F1 | 620–540 | No foraminifera | Admixture of fine sand; sulphide micronodules in the deepest layer; abundant fine and coarse plant remains (including seeds and characean oogonia), freshwater mollusc shell fragments | Abundant cladoceran fauna (600–540 cm); occasional shells of limnic ostracods |
| F2 | 540–470 | Foraminifera present; abundance fluctuates, but gradually increases to peak at 475–480 cm, and to decline thereafter; almost 100% domination of the Ammonia group, with a slight admixture of arenaceous forms; C/A ratio strongly in favour of calcareous forms | The lowest layer still with cladoceran fragments; mud with admixture of fine sand; abundant plant remains | Occasional hydrobiid snail shell fragments |
| F3 | 470–410 | Maximum abundance; highest taxon richness; domination of the Ammonia group (occasionally not decalcified), but contribution of arenaceous forms fairly well visible; C/A ratio strongly in favour of calcareous forms | Mud; some plant remains; admixture of fine sand | Occasional brackish-water ostracods and mollusc shell fragments |
| F4 | 410–175 | Abrupt decline in abundance; C/A ratio still in favour of calcareous forms, but agglutinated forms gaining in importance | Mud; occasionally abundant plant remains; admixture of fine sand | Fragments of mollusc shells; occasional valves of fresh- and brackish-water ostracods as well as cladoceran ephippia and carapace fragments |
| F5 | 175–0 | Fluctuating, generally low abundance (except for one layer with an exceptionally high abundance peak); domination of Eggerelloides scaber; C/A ratio very strongly in favour of agglutinated forms | Plant remains; admixture of fine sand; occasional sulphide micronodules | Mollusc shell fragments (e.g. Cardium), occasionally abundant; valves of fresh- and brackish-water ostracods |