
Table 1
Survival rates (%, averages ± SD) of rainbow trout from control (C), androgenetic haploid (aH) and androgenetic diploid (aDH) groups
| Group | Eyed stage | Swim-up stage |
|---|---|---|
| C1 | 99.14 ± 0.56 | 96.24 ± 2.21 |
| C2 | 95.51 ± 0.49 | 93.29 ± 2.20 |
| C3 | 95.08 ± 3.57 | 93.83 ± 4.07 |
| C4 | 93.77 ± 1.01 | 93.14 ± 1.18 |
| aH1 | 46.67 | - |
| aH2 | 3,03 | - |
| aH3 | 69.14 | - |
| aH4 | 67.83 | - |
| aDH1 | 29,35 ± 2.38 | 7.60 ± 0.38 |
| aDH2 | 4,10 ± 1.01 | 1.39 ± 1.05 |
| aDH3 | 1,39 ± 0.50 | 0.24 ± 0.27 |
| aDH4 | 57,14 ± 1.80 | 27.50 ± 0.95 |
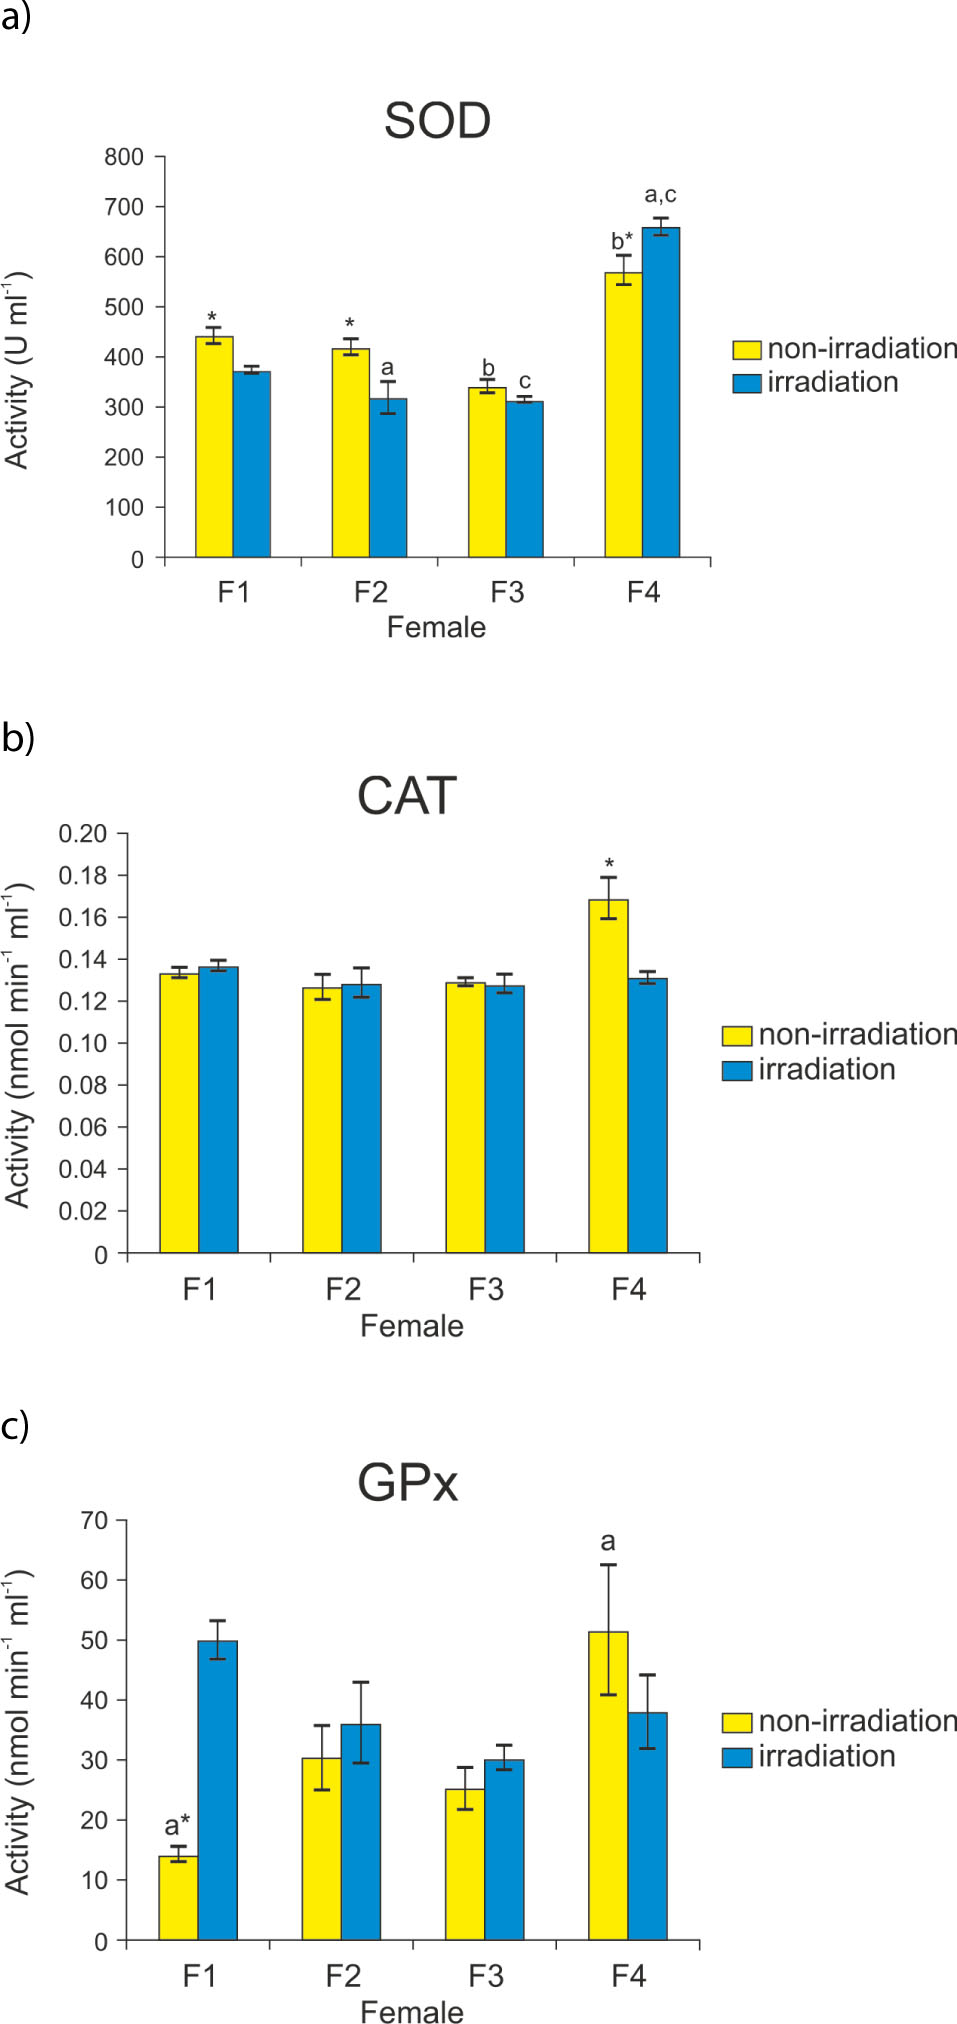
Figure 1a-c
Differences in antioxidant enzyme activity in irradiated and non-irradiated eggs between egg donor females. The same letters represent significant differences (p < 0.05) between antioxidant enzyme activity in eggs from different females. An asterisk indicates significant differences (p < 0.05) between irradiated and non-irradiated eggs from the same female. Error bars represent standard deviations.
Table 2
Comparison of diameters (mm, averages ± SD) of irradiated and non-irradiated eggs of rainbow trout. An asterisk indicates lack of significant differences (p < 0.05) between non-irradiated eggs from females F1 and F2.
| Female | Groups | |
|---|---|---|
| non-irradiated | irradiated | |
| F1 | 4.73 ± 0.17 * | 4.71 ± 0.11 |
| F2 | 4.75 ± 0.17 * | 4.84 ± 0.12 |
| F3 | 5.02 ± 0.12 | 4.98 ± 0.16 |
| F4 | 4.01 ± 0.21 | 3.99 ± 0.18 |
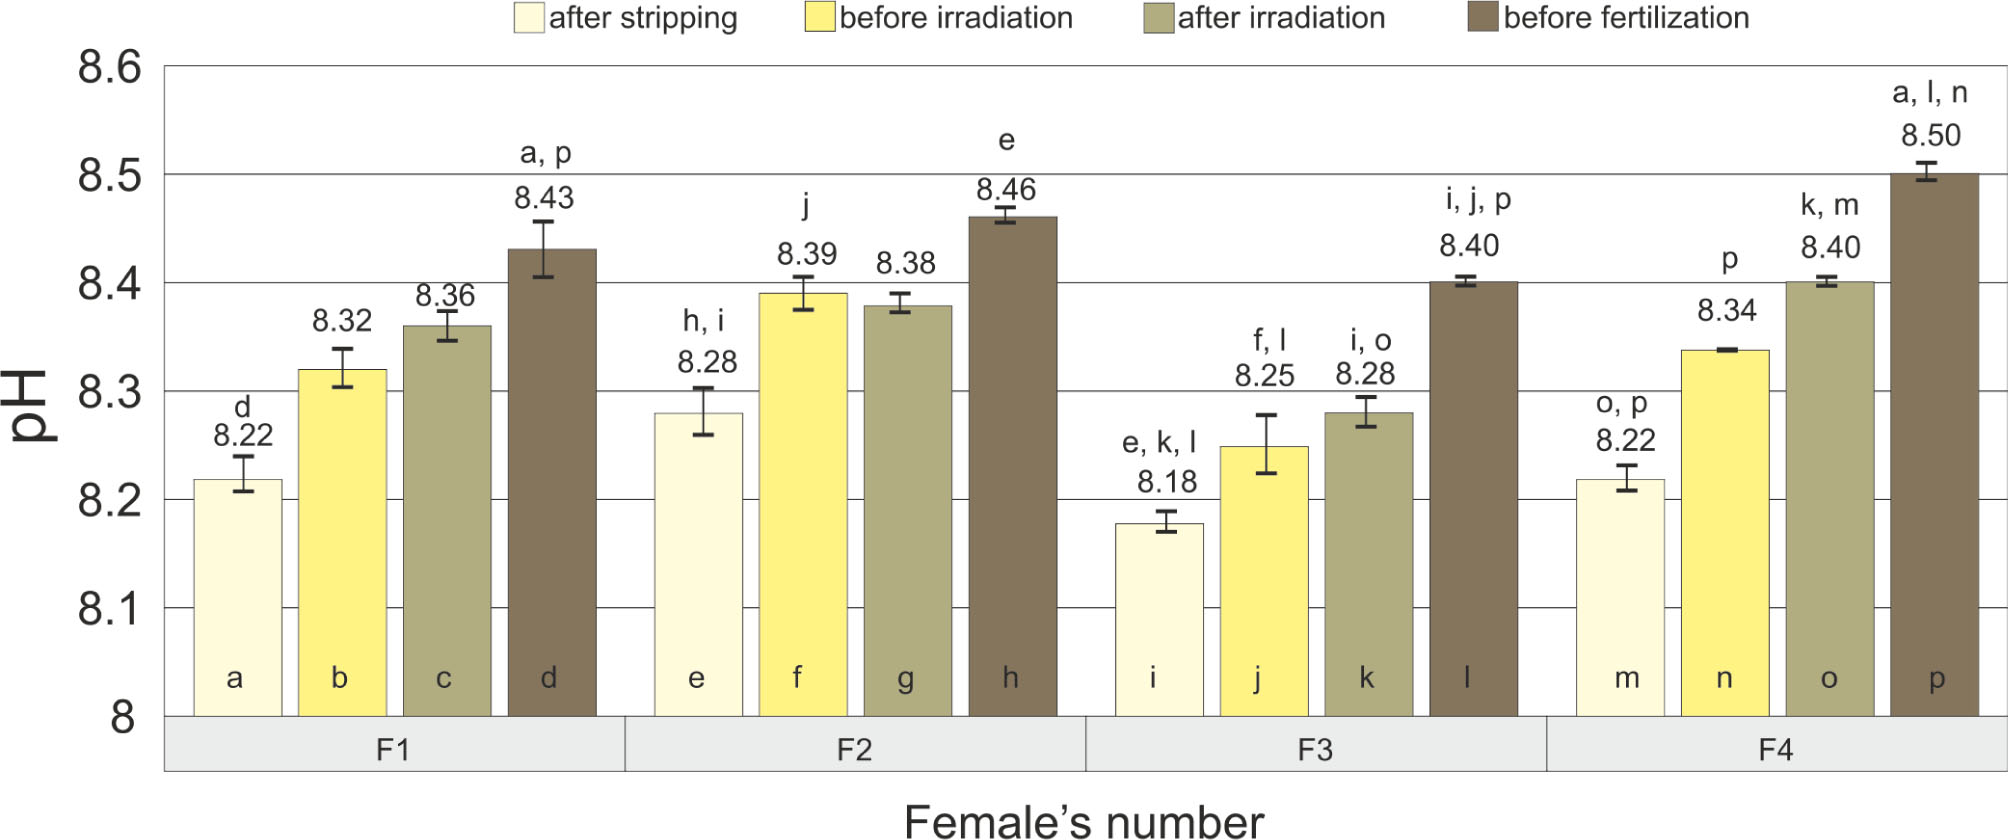
Figure 2
pH values of the ovarian fluid of each female (F1, F2, F3, F4) whose eggs were used in the experiment, measured before and after irradiation. Significant differences in pH values are indicated by letters: a1–a4, b1–b4, c1–c4, d1–d4. Error bars represent standard deviations.