
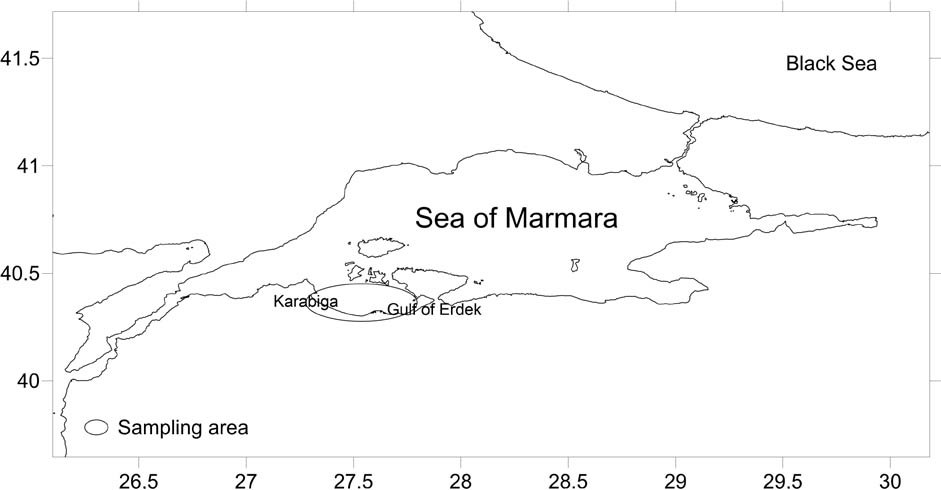
Figure 1
Sampling area in the Sea of Marmara
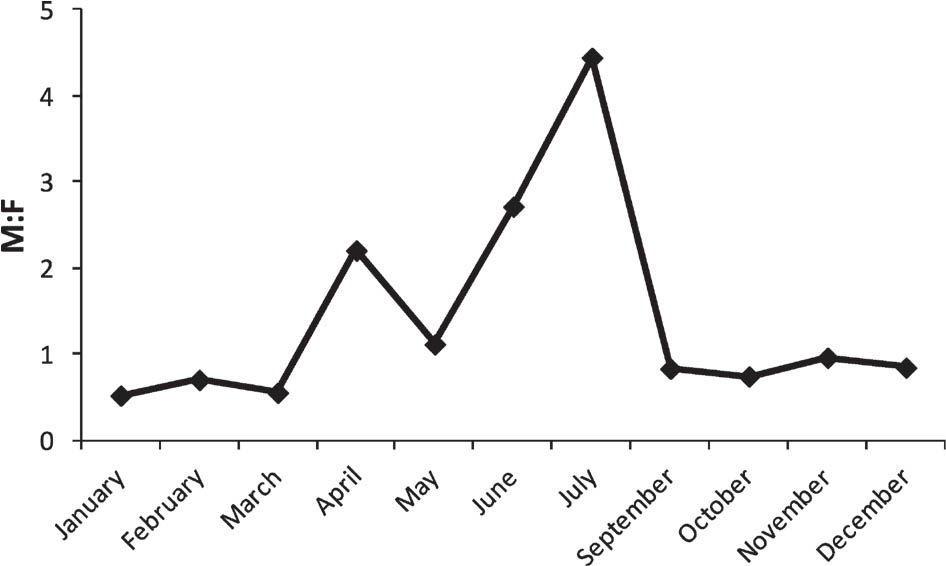
Figure 2
Monthly changes in the sex ratio in P. kerathurus
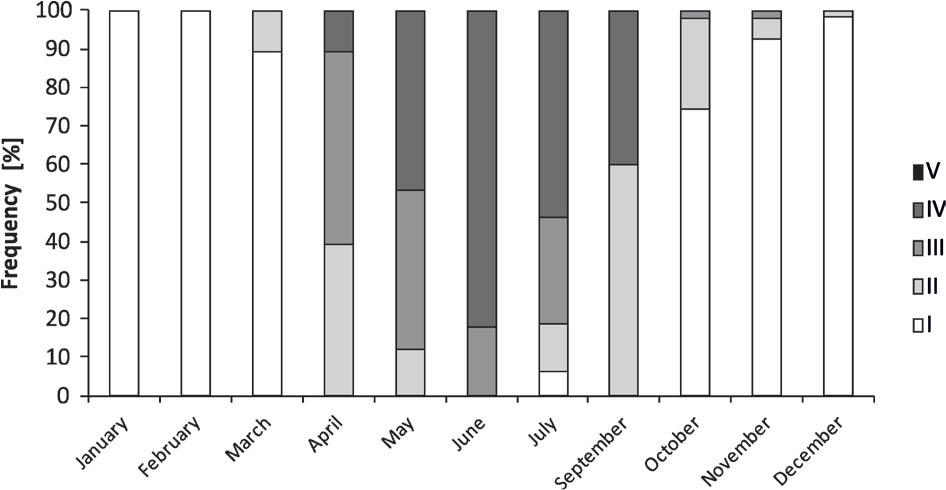
Figure 3
Monthly changes in maturity stages of P. kerathurus
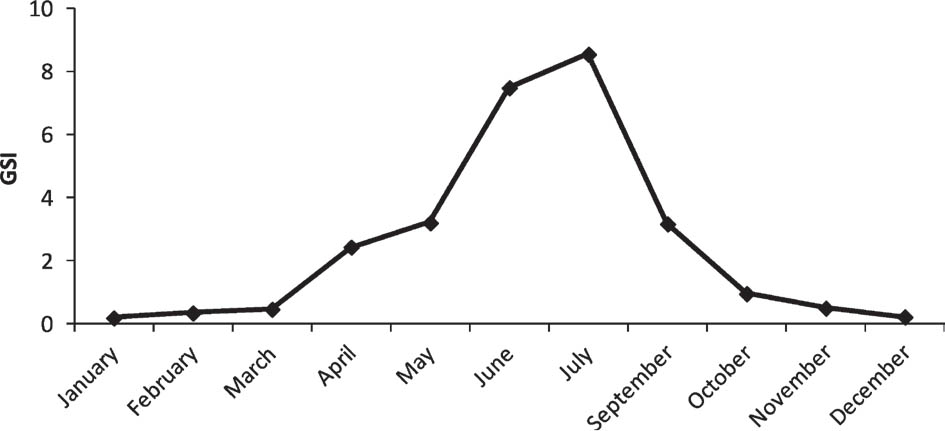
Figure 4
Monthly changes in the GSI values for P. kerathurus
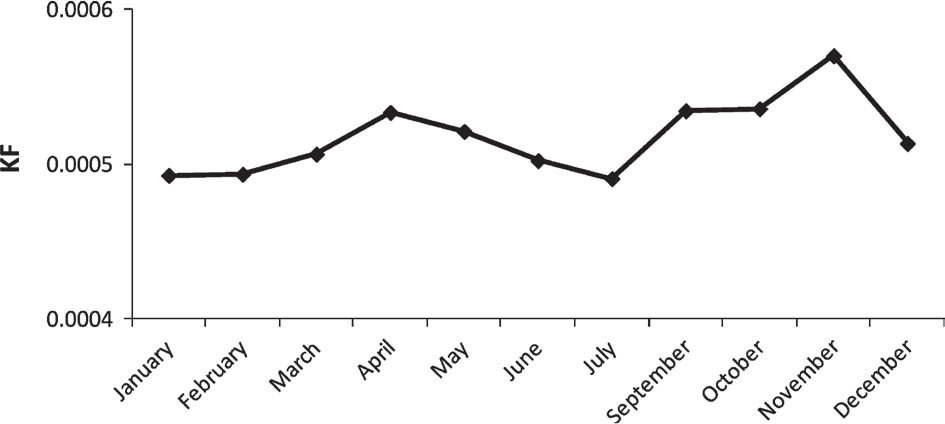
Figure 5
Monthly changes in the K values for P. kerathurus
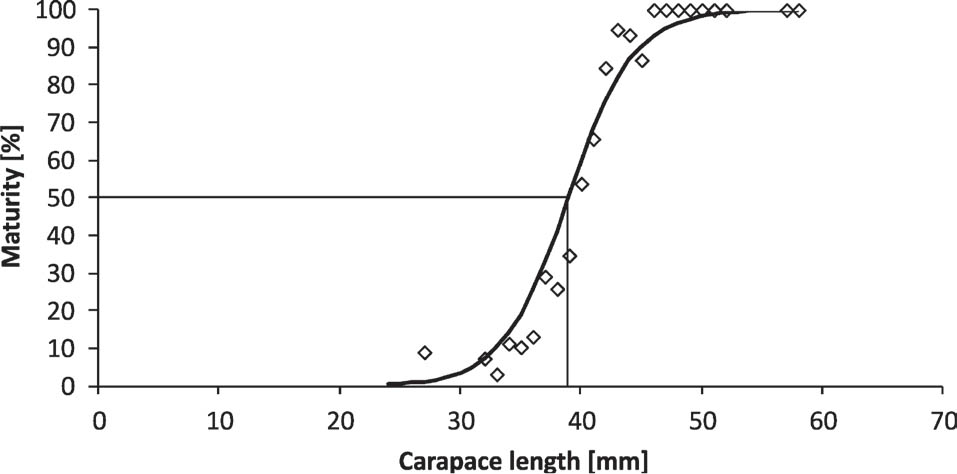
Figure 6
Length at first sexual maturity in female individuals of P. kerathurus
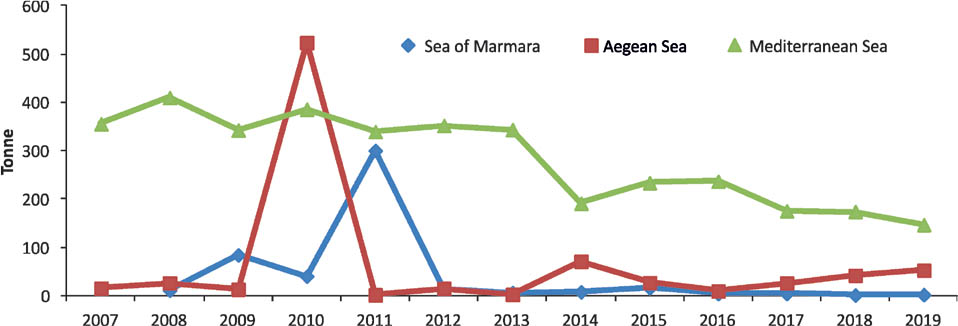
Figure 7
Capture production of P. kerathurus in Turkish Seas
Table 1
Length at 50% maturity LC50 of P. kerathurus in other studies
| Study | Area | L50 | Maturity period |
|---|---|---|---|
| Rodriguez 1987 | Atlantic | 120 mm TL | May–September |
| Turkmen et al. 2007 | Gulluk Bay | 48 mm CL | May–October |
| Metin et al. 2008 | Aegean Sea | 15 cm TL | April–September |
| Conides et al. 2008 | Amvrakikos Gulf | 45.2 mm CL | May–August |
| Lumare 2011 | South Adriatic Sea | 31.42 mm CL | May–August |
| Kevrekidis & Thessalou-Legaki 2013 | Thermaikos Gulf | 40.7 mm CL | April–October |
| Bolognini et al. 2017 | Mediterranean Sea | 30.5 mm CL | Summer |
| This study | Marmara Sea | 39 mm CL | April–September |