Fig. 1.
Fig. 2.
Fig. 3.
Fig. 4.
Fig. 5.
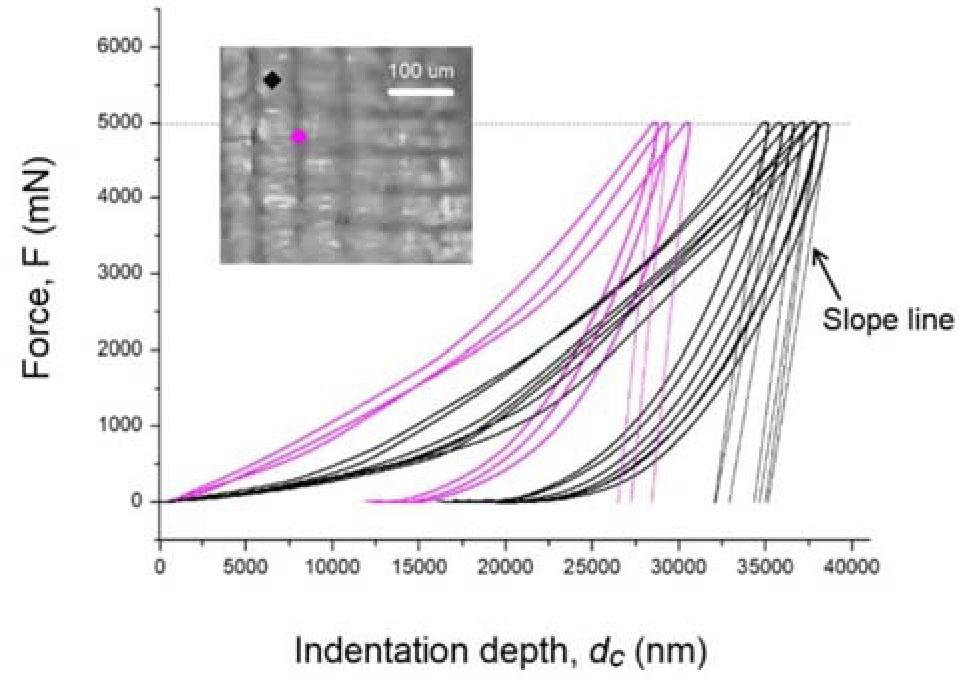
Fig. 6.
Fig. 7.
Fig. 8.
Limits of quantification (LOQ) for the determined elements
| Element | As | Sb | Se | Hg | Cd | Tl |
|---|---|---|---|---|---|---|
| LOQ (μg/kg) | 0.0005 | 0.0008 | 0.03 | 0.04 | 0.0002 | 0.008 |
Hardness (H) and elastic modulus (E) of the polymerized DS3000 before and after irradiation (25 kGy)
| DS3000 | Hardness, H (MPa), n = 4 | Elastic modulus, E (MPa), n = 4 | ||
|---|---|---|---|---|
| Average value | 1 SD | Average value | 1 SD | |
| Before EB | 84.5 | 3.5 | 8500 | 1800 |
| After EB | 203.0 | 5.0 | 8900 | 400 |
Content of elements in the polymerized DS3000 sample (powered and sterilized)
| Element | As | Sb | Se | Hg | Cd | Tl |
|---|---|---|---|---|---|---|
| (mg/kg) | <LOQ | <LOQ | <LOQ | <LOQ | <LOQ | <LOQ |