
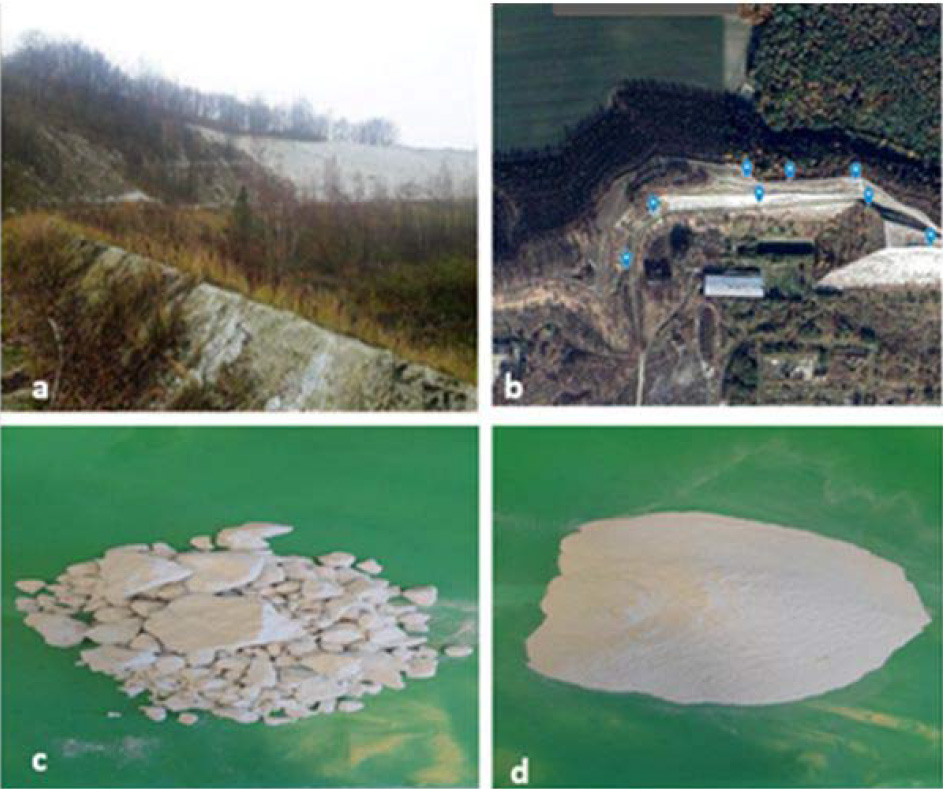
Fig. 1.
(a) Phosphogypsum waste stack of the former Wizów Chemical Plant in Poland. (b) Phosphogypsum sampling points. (c) Raw sample of phosphogypsum. (d) Dried phosphogypsum.
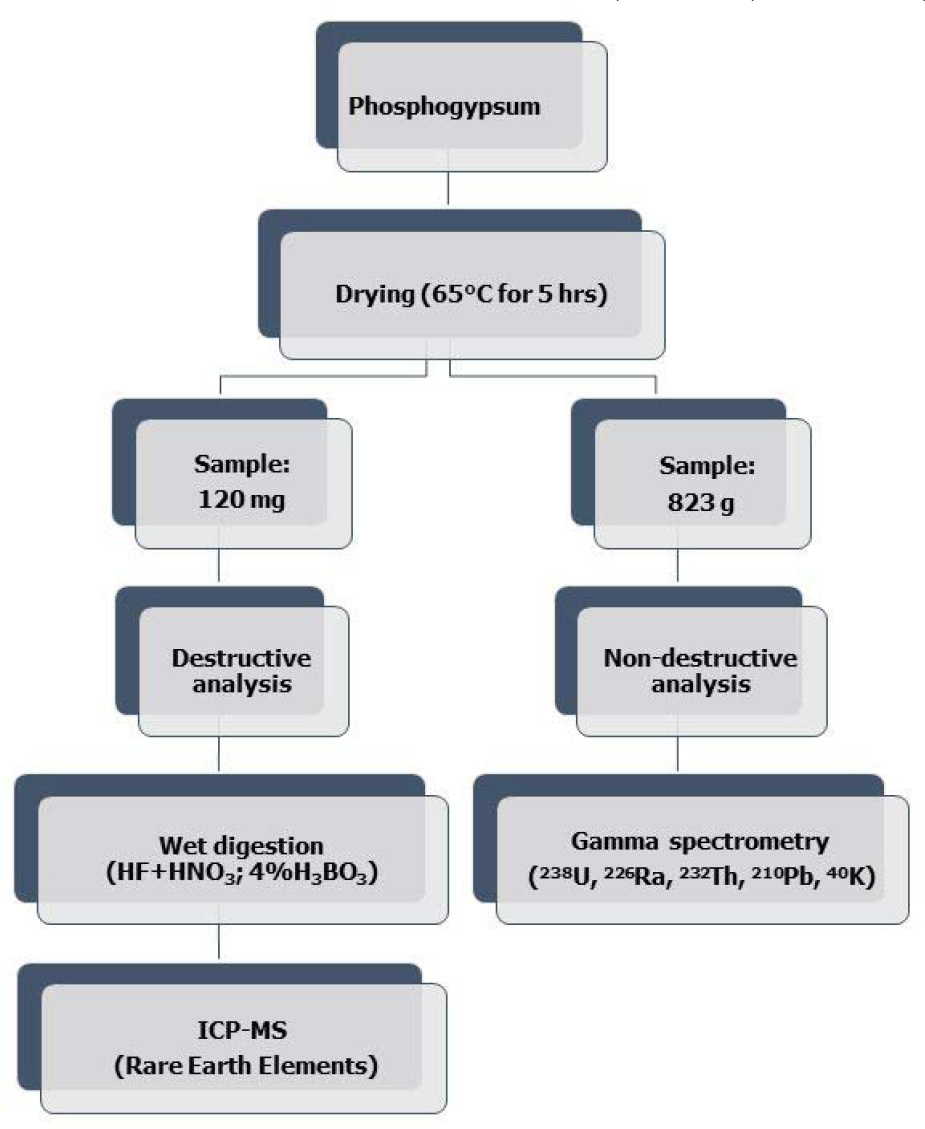
Fig. 2.
Illustration of phosphogypsum sample laboratory preparation steps for analysis.
Table 1.
The content of selected metals in Wizów’s phosphogypsum
| Elements | Concentration (mg/kg) | Elements | Concentration (mg/kg) |
|---|---|---|---|
| Antimony | 0.12–0.15 | Manganese | 22.96–25.18 |
| Arsenic | 4.76–5.23 | Molybdenum | 2.14–2.36 |
| Barium | 476.3–522.5 | Neodymium | 685.9–752.5 |
| Beryllium | 0.27–0.31 | Nickel | 12.54–13.75 |
| Cadmium | 0.06–0.08 | Praseodymium | 200.5–220.0 |
| Cerium | 2036–2234 | Samarium | 97.4–106.8 |
| Cobalt | 3.35–3.69 | Selenium | 6.46–7.10 |
| Copper | 19.77–21.69 | Silver | 0.61–0.67 |
| Dysprosium | 41.92–45.97 | Terbium | 10.23–11.23 |
| Erbium | 15.45–16.95 | Thallium | 0.01–0.02 |
| Europium | 26.98–29.58 | Thorium | 9.92–10.88 |
| Gadolinium | 117.2–128.6 | Thulium | 1.21–1.32 |
| Holmium | 6.26–6.87 | Uranium | 0.67–0.72 |
| Iron | 1024–1124 | Vanadium | 12.27–13.46 |
| Lanthanum | 1408–1545 | Ytterbium | 5.46–5.99 |
| Lead | 3.36–3.72 | Zinc | 14.57–15.99 |
| Lutetium | 0.54–0.61 |
Table 2.
The content of radionuclides in phosphogypsum sample related to sea sand as natural background
| Isotope | Energy (keV) | Combined activity ± uncertainty (Bq/kg) | A/Abackground |
|---|---|---|---|
| 214Pb | 53.2, 241.9, 258.8, 351.9 | 2.13 ± 0.004 | 2.7 |
| 214Bi | 79.7, 609.3, 768.4, 934.1 | 1.33 ± 0.001 | 2.5 |
| 208Tl | 84.9 | 1.25 ± 0.002 | 1.9 |
| 212Pb | 87.3, 115.2, 238.6 | 1.16 ± 0.004 | 2.1 |
| 235U | 89.95, 93.9, 109.2, 185.7 | 0.192 ± 0.011 | 1.48 |
| 228Ac | 99.5, 129.1, 129.1, 153.9, 199, 209.2 | 5.76 ± 0.068 | 1.8 |
| 40K | 1460.8 | 0.132 ± 0.001 | 3.0 |
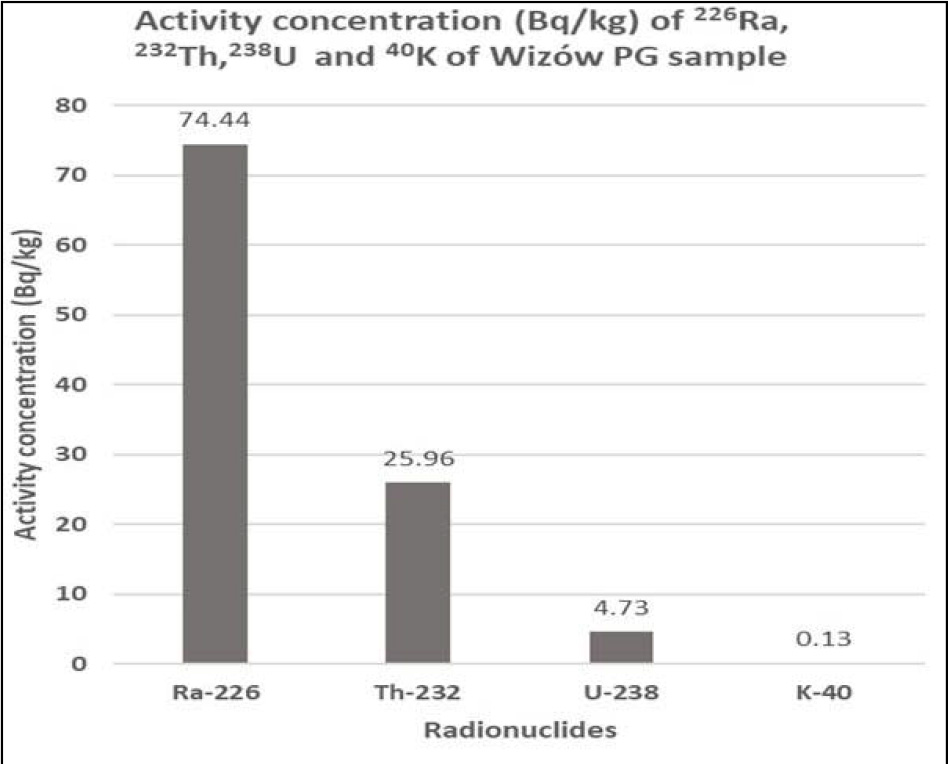
Fig. 3.
Activity concentrations of 226Ra, 232Th, 238U, and 40K in Wizów’s phosphogypsum sample.
Table 3.
Comparison of the radioactivity of phosphogypsum collected from the former Wizów Chemical Plant, Poland, to phosphogypsum from other countries
| Country/Radioisotope | Activity concentration (Bq/kg) | ||||
|---|---|---|---|---|---|
| 226Ra | 232Th | 238U | 40K | Reference | |
| Spain | 670 | 2 | 220 | 39 | [13] |
| Egypt | 459 | 40 | 140 | 2 | [14] |
| USA (Florida) | 1140 | 2 | 130 | 14 | [15] |
| Tunisia | 188 | 2 | 600 | 3 | [16] |
| Serbia | 600 | 3 | – | 47 | [16] |
| Croatia | 811 | 8 | – | 13 | [16] |
| Czech Republic | 115 | 31 | – | 95 | [16] |
| Morocco | 160 | 20 | 190 | 10 | [17] |
| Togo | 100 | 13 | 150 | 3 | [16] |
| Greece | 573 | 2.2 | 29 | 562.4 | [18] |
| Worldwide range | 162–5126 | 2.1–35.2 | 15–60 | 15–1410 | [17, 18] |
| Poland, Wizów | 77.44 | 25.96 | 4.73 | 0.13 | Current study |