
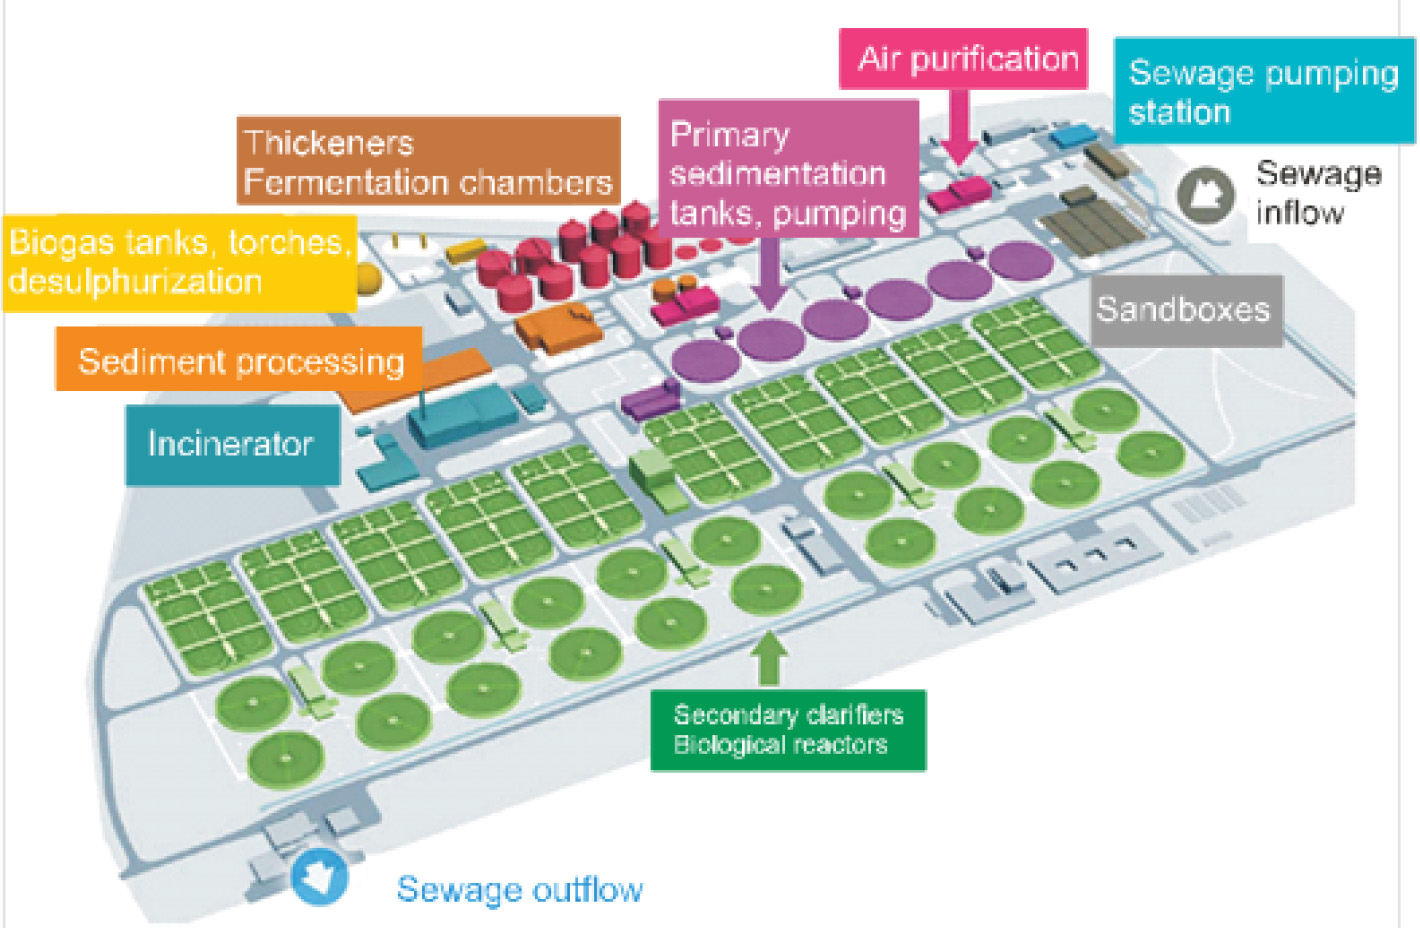
Fig. 1.
Schematic of the “Czajka” sewage treatment plant located in Warsaw, Poland.
Table 1.
Average content in mass percentage determined by the EDX technique
| Element | Average content in mass percentage |
|---|---|
| C, carbon | 1.86 |
| O, oxygen | 33.99 |
| Na, sodium | 0.40 |
| Mg, magnesium | 1.60 |
| Al, aluminum | 13.15 |
| Si, silicon | 13.36 |
| P, phosphorus | 9.18 |
| S, sulfur | 0.92 |
| K, potassium | 1.33 |
| Ca, calcium | 13.93 |
| Ti, titanium | 0.70 |
| Mn, manganese | 0.25 |
| Fe, iron | 8.13 |
| Cu, copper | 0.43 |
| Zn, zinc | 0.75 |
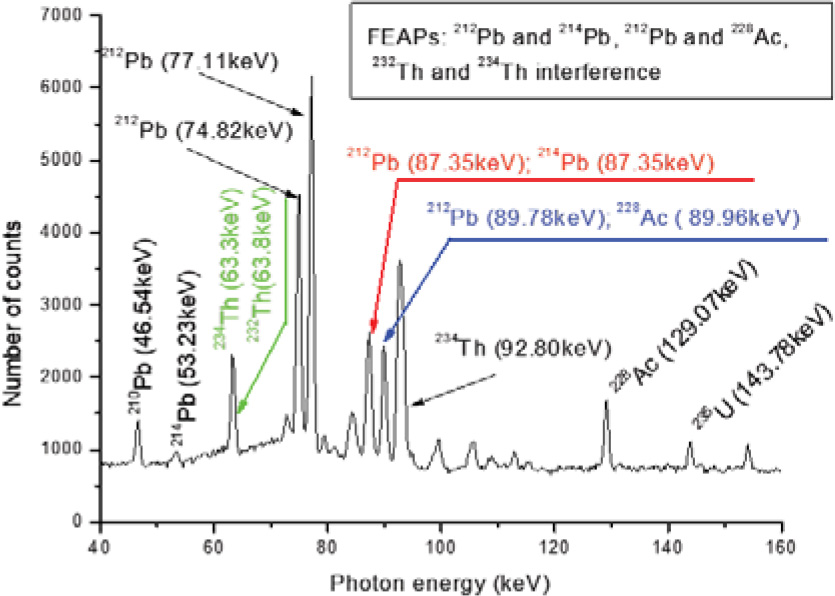
Fig. 2.
Interference of radionuclides FEAPs: 232Th and 234Th, 212Pb and 214Pb, 212Pb and 228Ac based on current results.
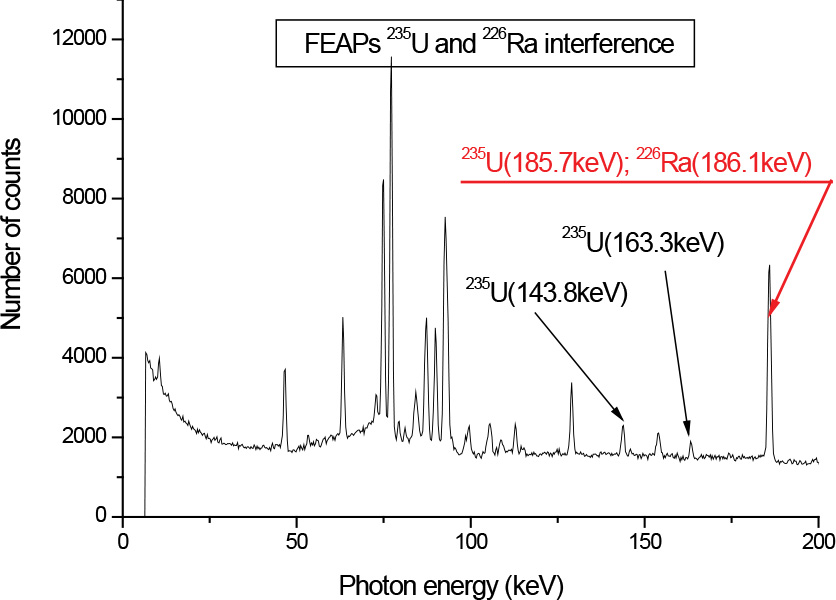
Fig. 3.
Interference of 235U and 226Ra FEAPs based on current results.
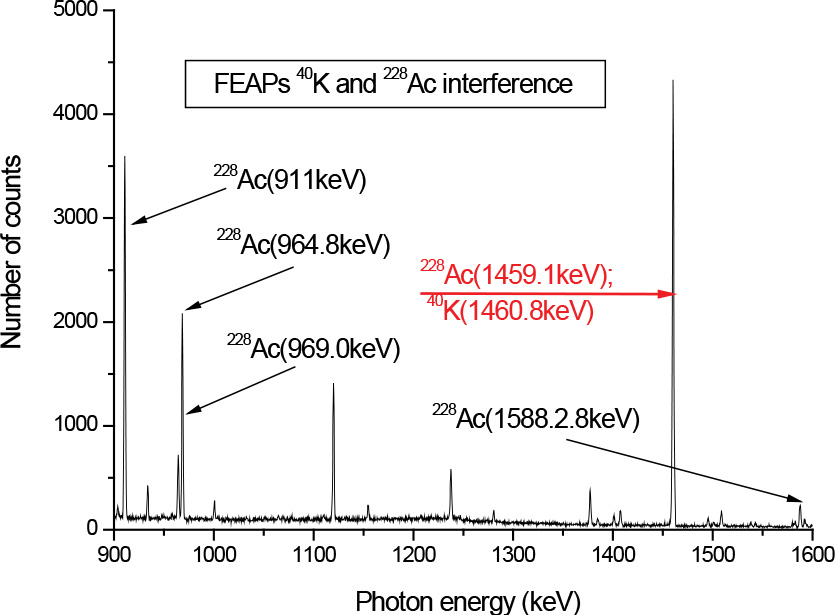
Fig. 4.
Interference of 40K and 228Ac FEAPs based on current results.
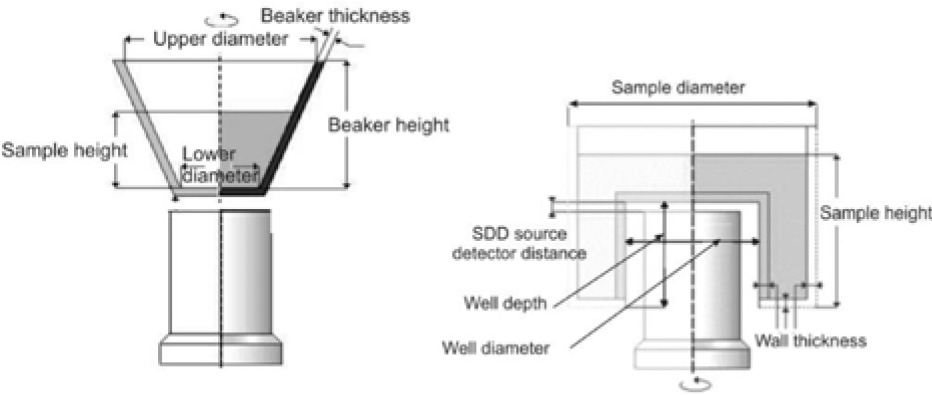
Fig. 5.
The measurement geometries adopted for both series of measurements. Simplified beaker (on the left) and Marinelli beaker. Own drawing based on the Geometry Composer screen.
Table 2.
The mean value of the specific activity and its standard deviation (SD) for radionuclides detected in samples of ashes from the “Czajka” plant
| Radionuclide | Mean specific activity ± SD (Bq/kg) |
|---|---|
| 137Cs | 5 ± 2 |
| 7Be | 479 ± 98 |
| 40K | 417 ± 442 |
| Uranium–radium series | |
| 234mPa | 149 881 ± 97 150 |
| 210Bi | 2 762 ± 2 310 |
| 234Th | 446 ± 395 |
| 214Bi | 4 670 ± 2 762 |
| 210Pb | 286 ± 228 |
| 226Ra | 41 ± 30 |
| Thorium series | |
| 228Ac | 382 ± 239 |
| 212Bi | 960 ± 566 |
| 212Pb | 92 ± 44 |
| 208Tl | 15 ± 5 |
| Uranium–actinium series | |
| 235U | 5 ± 3 |