
Fig. 1.
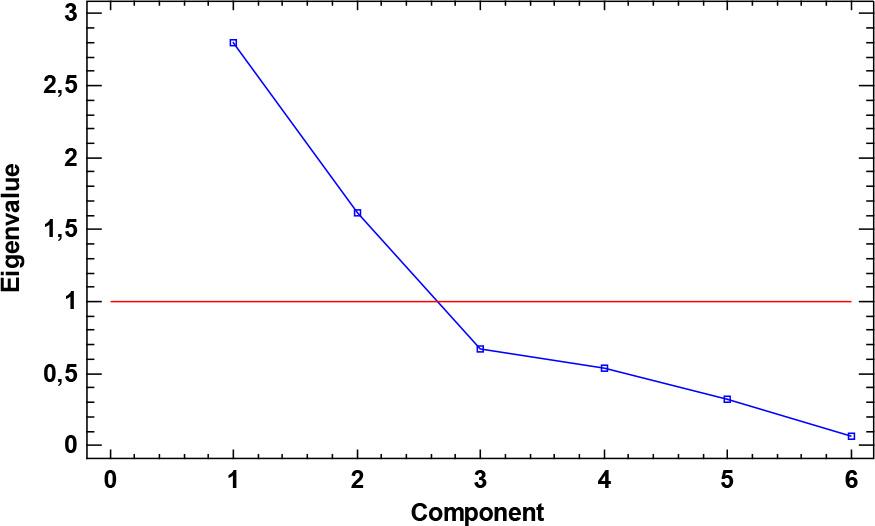
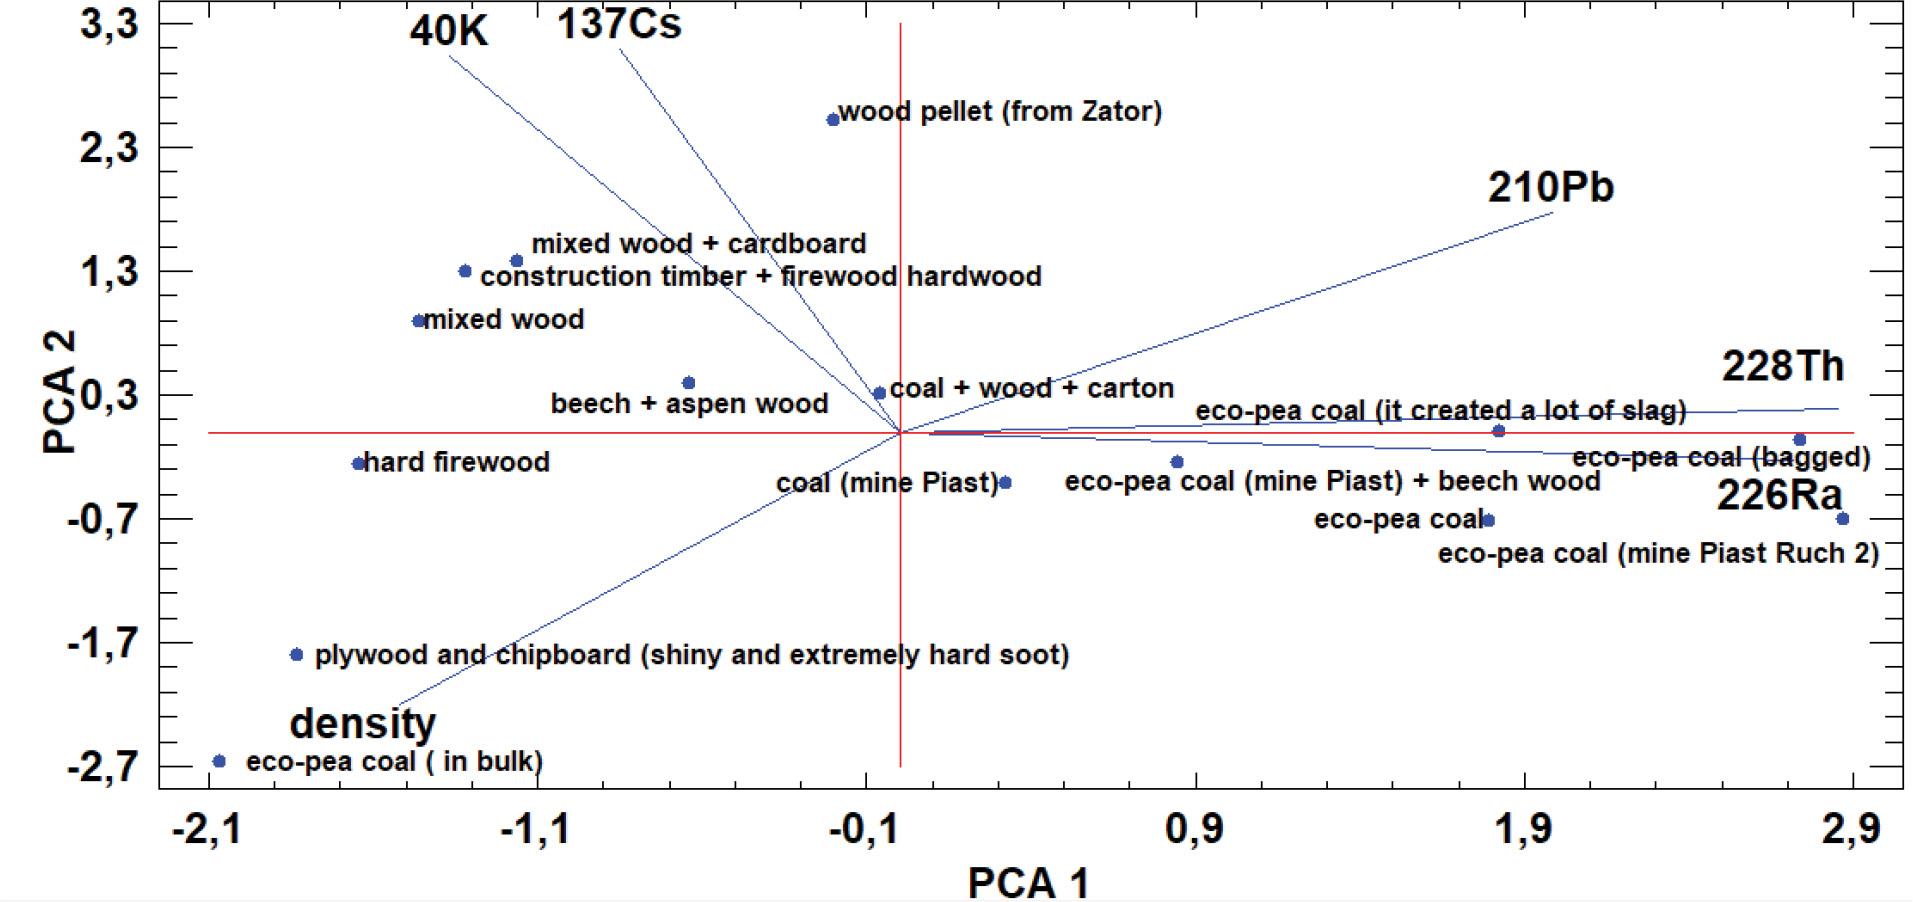
Fig. 2.
Results of the spectrometric measurements with uncertainty
| No. | Density (G·cm−3) | 137Cs (Bq·kg−1) | 40K (Bq·kg−1) | 228Th (Bq·kg−1) | 226Ra (Bq·kg−1) | 210Pb (Bq·kg−1) |
|---|---|---|---|---|---|---|
| 1 | 0.53 | 14.33 ± 0.52 | 671 ± 24 | MDA | 15.6 ± 2.6 | 411.9 ± 5.8 |
| 3 | 0.30 | 5.12 ± 0.76 | 323 ± 39 | 15.8 ± 7.5 | 17.9 ± 4.6 | 467.3 ± 9.5 |
| 4 | 1.32 | MDA | LLD | MDA | 15.2 ± 1.6 | 111.0 ± 15.0 |
| 5 | 0.40 | 16.30 ± 1.10 | LLD | 30.6 ± 9.3 | 35.6 ± 4.7 | 395.0 ± 44.0 |
| 7 | 0.76 | MDA | MDA | MDA | MDA | 52.0 ± 16.0 |
| 8 | 0.30 | 3.42 ± 0.68 | 72 ± 35 | 17.4 ± 9.8 | 26.8 ± 4.5 | 376.6 ± 8.3 |
| 9 | 0.54 | 18.75 ± 0.59 | 180 ± 22 | MDA | MDA | 225.7 ± 5.3 |
| 10 | 0.48 | 68.12 ± 0.96 | 400 ± 26 | 20.9 ± 6.5 | 30.4 ± 3.1 | 649.9 ± 7.7 |
| 12 | 0.68 | MDA | 122 ± 17 | 36.5 ± 6.0 | 32.8 ± 2.3 | 1098.7 ± 7.3 |
| 13 | 0.16 | MDA | MDA | 36.0 ± 19.0 | 74.1 ± 8.9 | 663.0 ± 16.0 |
| 14 | 0.48 | LLD | LLD | 47.5 ± 8.6 | 83.9 ± 3.3 | 576.0 ± 7.4 |
| 15 | 0.47 | MDA | 93 ± 22 | 41.3 ± 8.1 | 61.9 ± 3.1 | 392.5 ± 5.8 |
| 17 | 0.56 | 28.86 ± 0.64 | 650 ± 24 | 10.9 ± 8.5 | 12.6 ± 2.6 | 402.0 ± 6.0 |
| 20 | 0.48 | 22.50 ± 0.56 | 372 ± 23 | 15.6 ± 6.2 | 26.9 ± 2.9 | 248.6 ± 5.1 |
| 22 | 0.48 | 17.17 ± 0.64 | 797 ± 28 | 11.2 ± 7.9 | 14.8 ± 3.0 | 428.2 ± 6.9 |
Detailed description of the fuels used on the basis of user testimony
| Furnace no. | Description and additional information |
|---|---|
| 1 | Mixed wood |
| 3 | Coal + wood + carton |
| 4 | Eco-pea coal (in bulk) |
| 5 | Eco-pea coal (mine “Piast”) + beech wood |
| 7 | Plywood and chipboard (shiny and extremely |
| hard soot) | |
| 8 | Coal (mine “Piast”) |
| 9 | Hard firewood |
| 10 | Wood pellet (from “Zator”) |
| 12 | Eco-pea coal (it created a lot of slag) |
| 13 | Eco-pea coal (bagged) |
| 14 | Eco-pea coal (mine “Piast Ruch 2”) |
| 15 | Eco-pea coal |
| 17 | Construction timber + firewood hardwood |
| 20 | Beech + aspen wood |
| 22 | Mixed wood + cardboard |
Basic statistical parameters of the obtained results and the value of minimum detectable activity (MDA)
| Minimum | Maximum | Average | Standard deviation | |
|---|---|---|---|---|
| Density (g·cm−3) | 0.16 | 1.32 | 0.53 | 0.11 |
| 137Cs (Bq·kg−1) | MDA (<1.5) | 68.1 | 13.6 | 1.6 |
| 40K (Bq·kg−1) | MDA (<23.7) | 796.7 | 260.6 | 103 |
| 228Th (Bq·kg−1) | MDA (<0.88) | 47.5 | 20.2 | 9.5 |
| 226Ra (Bq·kg−1) | MDA (<1.3) | 83.9 | 30.7 | 6.9 |
| 210Pb (Bq·kg−1) | MDA (<5.4) | 1098.7 | 433.2 | 6.4 |
Eigenvalues and percentage of the variance described in principal component analysis
| Component no. | Eigenvalue | Percent of variance | Cumulative percentage |
|---|---|---|---|
| 1 | 2.79 | 46.58 | 46.58 |
| 2 | 1.61 | 26.96 | 73.54 |
| 3 | 0.66 | 11.11 | 84.65 |
| 4 | 0.53 | 8.91 | 93.56 |
| 5 | 0.32 | 5.40 | 98.97 |
| 6 | 0.06 | 1.02 | 100.00 |