
Table 1.
he chemical contents (mol%) of glass samples used in this study [15]
| Sample code | Bi2O3 | ZnO | B2O3 | SiO2 | Density (g/cm3) |
|---|---|---|---|---|---|
| S1 | 10 | 40 | 20 | 30 | 4.59 |
| S2 | 20 | 30 | 20 | 30 | 4.97 |
| S3 | 30 | 20 | 20 | 30 | 5.87 |
| S4 | 40 | 10 | 20 | 30 | 6.20 |
| S5 | 45 | 5 | 20 | 30 | 6.31 |
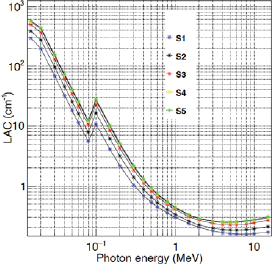
Fig. 1.
Linear attenuation coefficient of glass samples S1, S2, S3, S4, and S5.
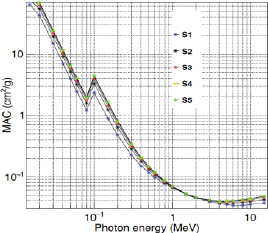
Fig. 2.
Mass attenuation coefficient of glass samples S1, S2, S3, S4, and S5.
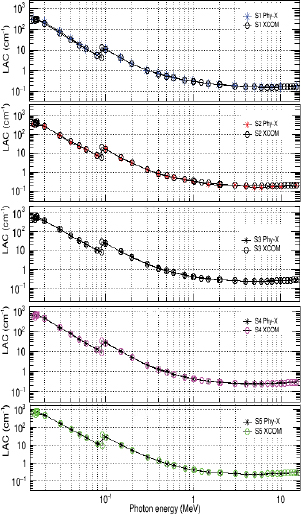
Fig. 3.
Comparison of LAC from Phy-X/PSD and XCOM for S1, S2, S3, S4, and S5.
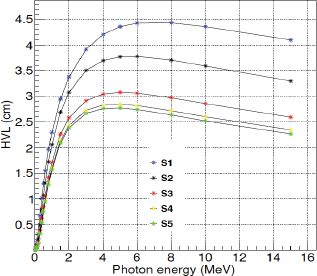
Fig. 4.
Half-value layer of glass samples S1, S2, S3, S4, and S5.
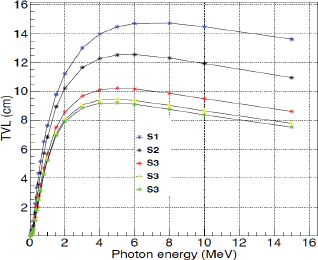
Fig. 5.
Tenth-value layer of glass samples S1, S2, S3, S4, and S5.
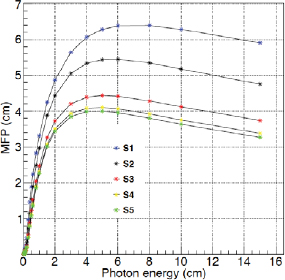
Fig. 6.
Mean-free path of glass samples S1, S2, S3, S4, and S5.
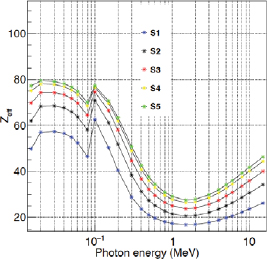
Fig. 7.
Effective atomic number of glass samples S1, S2, S3, S4, and S5.
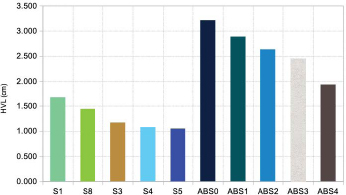
Fig. 8.
Comparison of the half-value layer with literature at 0.662 MeV.
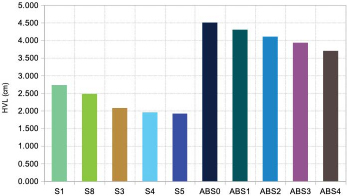
Fig. 9.
Comparison of the half-value layer with literature at 1.332 MeV.
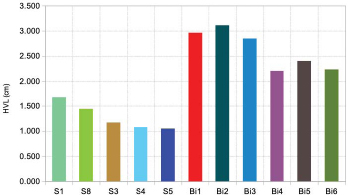
Fig. 10.
Second comparison of the half-value layer with literature at 0.662 MeV.