
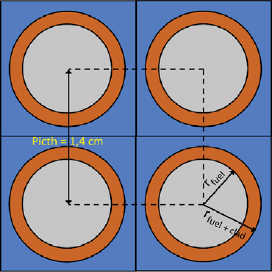
Fig. 1.
Fuel cell design.
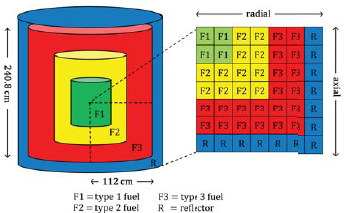
Fig. 2.
Small long-life PWR core design.
Table 1.
Design parameters of small long-life PWR
| Parameters | Specification |
|---|---|
| Thermal power reactors | 300, 400, 500 MWth |
| Fuel | (Th-233U)O2, (Th-233U)C, (Th-233U)N |
| Cladding structure | Zircaloy-4 and ZIRLO |
| Coolant | H2O |
| Reflector | Stainless steel and H2O |
| Geometry of fuel cell | Square cell |
| Percentage enrichment of 233U | 3–9% |
| Smear density | 85% |
| Fuel volume fraction | 60% |
| Cladding density | 6.5 g/cm3 |
| Cladding thickness | 0.057 cm |
| Coolant density | 0.72 g/cm3 |
| Pin pitch | 1.4 cm |
| Diameter of active core | 224.0 cm |
| Height of active core | 240.8 cm |
Table 2.
The neutron energy group used in the calculation
| Spectrum type | Group | Energy range (eV) | |
|---|---|---|---|
| Upper | Lower | ||
| Fast neutron | 1 | 1.000 × 10⁷ | 1.855 × 100 |
| Thermal neutron | 2 | 1.855 × 100 | 8.764 × 10⁻¹ |
| 3 | 8.764 × 10⁻¹ | 4.139 × 10⁻¹ | |
| 4 | 4.139 × 10⁻¹ | 2.770 × 10⁻¹ | |
| 5 | 2.770 × 10⁻¹ | 1.674 × 10⁻¹ | |
| 6 | 1.674 × 10⁻¹ | 8.529 × 10⁻² | |
| 7 | 8.529 × 10⁻² | 3.060 × 10⁻² | |
| 8 | 3.060 × 10⁻² | 1.000× 10⁻⁵ | |
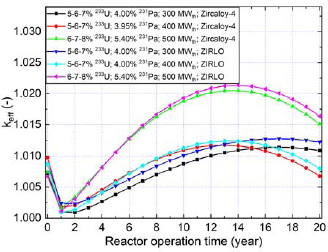
Fig. 3.
The effective multiplication factor (keff) for small long-life PWR with (Th-233U)O2 fuel.
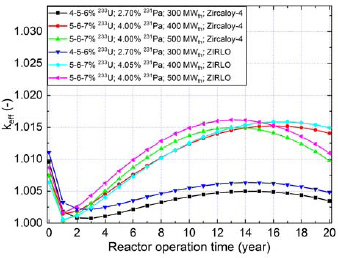
Fig. 4.
The effective multiplication factor (keff) for small long-life PWR with (Th-233U)C fuel.
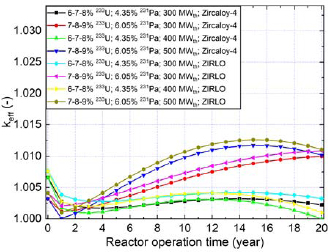
Fig. 5.
The effective multiplication factor (keff) for small long-life PWR with (Th-233U)N fuel.
Table 3.
Excess reactivity for all types of fuel with the best level of criticality
| Fuel | %233U | %231Pa | Cladding | Power (MWth) | Excess reactivity (% dk/k) | ||
|---|---|---|---|---|---|---|---|
| BOC | EOC | Maximum | |||||
| (Th-233U)O2 | 5–6–7 | 4.00 | Zircaloy-4 | 300 | 0.72 | 1.08 | 1.13 |
| (Th-233U)O2 | 5–6–7 | 3.95 | Zircaloy-4 | 400 | 0.96 | 0.80 | 1.16 |
| (Th-233U)O2 | 5–6–7 | 4.00 | ZIRLO | 300 | 0.86 | 1.21 | 1.26 |
| (Th-233U)O2 | 5–6–7 | 4.00 | ZIRLO | 400 | 0.86 | 0.92 | 1.23 |
| (Th-233U)C | 4–5–6 | 2.70 | Zircaloy-4 | 300 | 0.95 | 0.40 | 0.95 |
| (Th-233U)C | 4–5–6 | 2.70 | ZIRLO | 300 | 1.09 | 0.53 | 1.09 |
| (Th-233U)N | 6–7–8 | 4.35 | Zircaloy-4 | 300 | 0.65 | 0.22 | 0.65 |
| (Th-233U)N | 6–7–8 | 4.35 | Zircaloy-4 | 400 | 0.65 | 0.01 | 0.65 |
| (Th-233U)N | 7–8–9 | 6.05 | Zircaloy-4 | 300 | 0.32 | 0.99 | 0.99 |
| (Th-233U)N | 6–7–8 | 4.35 | ZIRLO | 300 | 0.76 | 0.32 | 0.76 |
| (Th-233U)N | 6–7–8 | 4.35 | ZIRLO | 400 | 0.76 | 0.10 | 0.76 |
| (Th-233U)N | 7–8–9 | 6.05 | ZIRLO | 300 | 0.41 | 1.08 | 1.08 |
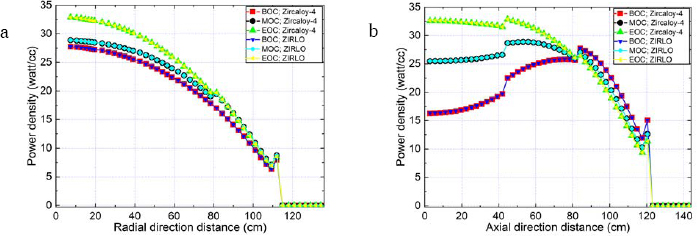
Fig. 6.
Power density distribution for (Th-233U)O2 fuel at 5-6-7%233U, 4.00% 231Pa, and 300 MWth. (a) Radial direction, (b) axial direction (1 mesh = 2.80 cm).
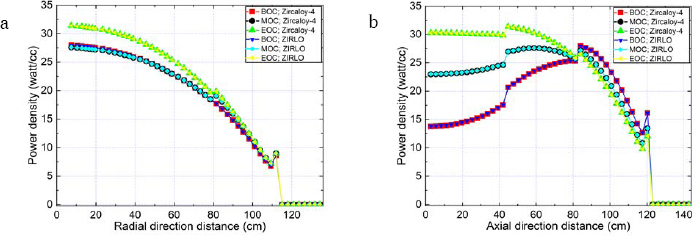
Fig. 7.
Power density distribution for (Th-233U)C fuel at 4-5-6% 233U, 2.70% 231Pa, and 300 MWth. (a) Radial direction, (b) axial direction (1 mesh = 2.80 cm).
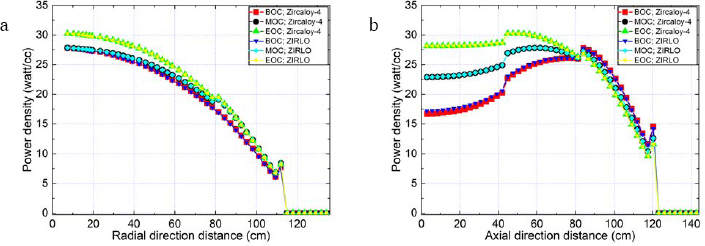
Fig. 8.
Power density distribution for (Th-233U)N fuel at 6–7–8% 233U, 4.35%231Pa, and 300 MWth. (a) Radial direction, (b) axial direction (1 mesh = 2.80 cm).
Table 4.
The peak power density (watt/cc) for all types of fuel with the best level of criticality
| Fuel | %233U | %231Pa | Cladding | Power (MWth) | BOC | MOC | EOC | |||
|---|---|---|---|---|---|---|---|---|---|---|
| Radial | Axial | Radial | Axial | Radial | Axial | |||||
| (Th-233U)O2 | 5–6–7 | 4.00 | Zircaloy-4 | 300 | 27.75 | 27.75 | 28.87 | 28.87 | 32.86 | 32.58 |
| (Th-233U)O2 | 5–6–7 | 4.00 | ZIRLO | 300 | 27.75 | 27.75 | 28.88 | 28.88 | 32.88 | 32.61 |
| (Th-233U)C | 4–5–6 | 2.70 | Zircaloy-4 | 300 | 27.97 | 27.97 | 27.59 | 27.59 | 31.39 | 31.39 |
| (Th-233U)C | 4–5–6 | 2.70 | ZIRLO | 300 | 27.96 | 27.96 | 27.60 | 27.60 | 31.40 | 31.40 |
| (Th-233U)N | 6–7–8 | 4.35 | Zircaloy-4 | 300 | 27.82 | 27.82 | 27.82 | 27.82 | 30.27 | 30.27 |
| (Th-233U)N | 6–7–8 | 4.35 | ZIRLO | 300 | 27.74 | 27.74 | 27.83 | 27.83 | 30.24 | 30.24 |
Table 5.
Power peaking factor for all types of fuel with the best level of criticality
| Fuel | %233U | %231Pa | Cladding | Power (MWth) | BOC | MOC | EOC | |||
|---|---|---|---|---|---|---|---|---|---|---|
| Radial | Axial | Radial | Axial | Radial | Axial | |||||
| (Th-233U)O2 | 5–6–7 | 4.00 | Zircaloy-4 | 300 | 1.644 | 1.323 | 1.573 | 1.185 | 1.698 | 1. 223 |
| (Th-233U)O2 | 5–6–7 | 3.95 | Zircaloy-4 | 400 | 1.645 | 1.321 | 1.586 | 1.195 | 1.662 | 1.277 |
| (Th-233U)O2 | 6–7–8 | 5.40 | Zircaloy-4 | 500 | 1.669 | 1.271 | 1.648 | 1.211 | 1.732 | 1.319 |
| (Th-233U)O2 | 5–6–7 | 4.00 | ZIRLO | 300 | 1.645 | 1.322 | 1.574 | 1.185 | 1.698 | 1. 223 |
| (Th-233U)O2 | 5–6–7 | 4.00 | ZIRLO | 400 | 1.645 | 1.322 | 1.587 | 1.196 | 1.665 | 1.279 |
| (Th-233U)O2 | 6–7–8 | 5.45 | ZIRLO | 500 | 1.669 | 1.272 | 1.649 | 1.211 | 1.734 | 1.320 |
| (Th-233U)C | 4–5–6 | 2.70 | Zircaloy-4 | 300 | 1.631 | 1.334 | 1.551 | 1.182 | 1.638 | 1.208 |
| (Th-233U)C | 5–6–7 | 4.00 | Zircaloy-4 | 400 | 1.631 | 1.333 | 1.586 | 1.184 | 1.587 | 1.235 |
| (Th-233U)C | 5–6–7 | 4.00 | Zircaloy-4 | 500 | 1.631 | 1.333 | 1.588 | 1.195 | 1.667 | 1.283 |
| (Th-233U)C | 4–5–6 | 2.70 | ZIRLO | 300 | 1.631 | 1.333 | 1.552 | 1.182 | 1.638 | 1.208 |
| (Th-233U)C | 5–6–7 | 4.05 | ZIRLO | 400 | 1.631 | 1.333 | 1.587 | 1.184 | 1.589 | 1.236 |
| (Th-233U)C | 5–6–7 | 4.00 | ZIRLO | 500 | 1.632 | 1.332 | 1.589 | 1.195 | 1.667 | 1.283 |
| (Th-233U)N | 6–7–8 | 4.35 | Zircaloy 4 | 300 | 1.649 | 1.311 | 1.580 | 1.185 | 1.657 | 1.211 |
| (Th-233U)N | 6–7–8 | 4.35 | Zircaloy 4 | 400 | 1.649 | 1.311 | 1.602 | 1.188 | 1.573 | 1.224 |
| (Th-233U)N | 7–8–9 | 6.05 | Zircaloy 4 | 500 | 1.667 | 1.274 | 1.599 | 1.190 | 1.589 | 1.231 |
| (Th-233U)N | 6–7–8 | 4.35 | ZIRLO | 300 | 1.650 | 1.311 | 1.580 | 1.185 | 1.658 | 1.211 |
| (Th-233U)N | 6–7–8 | 4.35 | ZIRLO | 400 | 1.650 | 1.311 | 1.602 | 1.188 | 1.575 | 1. 225 |
| (Th-233U)N | 7–8–9 | 6.05 | ZIRLO | 500 | 1.667 | 1.273 | 1.600 | 1.191 | 1.590 | 1.232 |
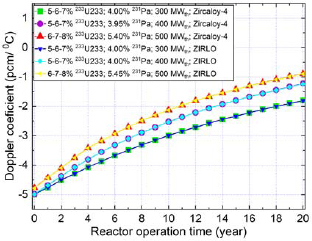
Fig. 9.
Doppler coefficient for the (Th-233U)O2 fuel with the best criticality at 300 MWth, 400 MWth, and 500 MWth with zircaloy-4 and ZIRLO cladding.
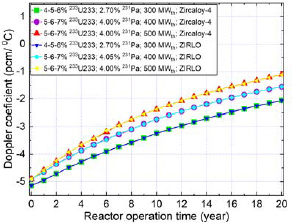
Fig. 10.
Doppler coefficient for the (Th-233U)C fuel with the best criticality at 300 MWth, 400 MWth, and 500 MWth with zircaloy-4 and ZIRLO cladding.
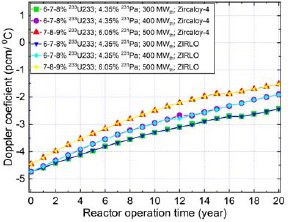
Fig. 11.
Doppler coefficient for the (Th-233U)N fuel with the best criticality at 300 MWth, 400 MWth, and 500 MWth with zircaloy-4 and ZIRLO cladding.
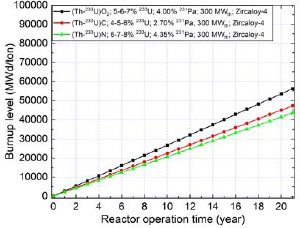
Fig. 12.
Burnup level of (Th-233U)O2, (Th-233U)C, and (Th-233U)N at 300 MWth power.
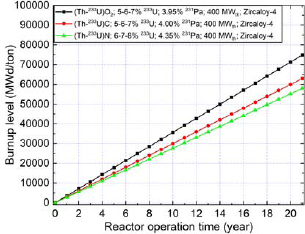
Fig. 13.
Burnup level of (Th-233U)O2, (Th-233U)C, and (Th-233U)N at 400 MWth power.
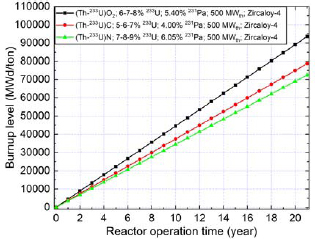
Fig. 14.
Burnup level of (Th-233U)O2, (Th-233U)C, and (Th-233U)N at 500 MWth power.