
Fig. 1.
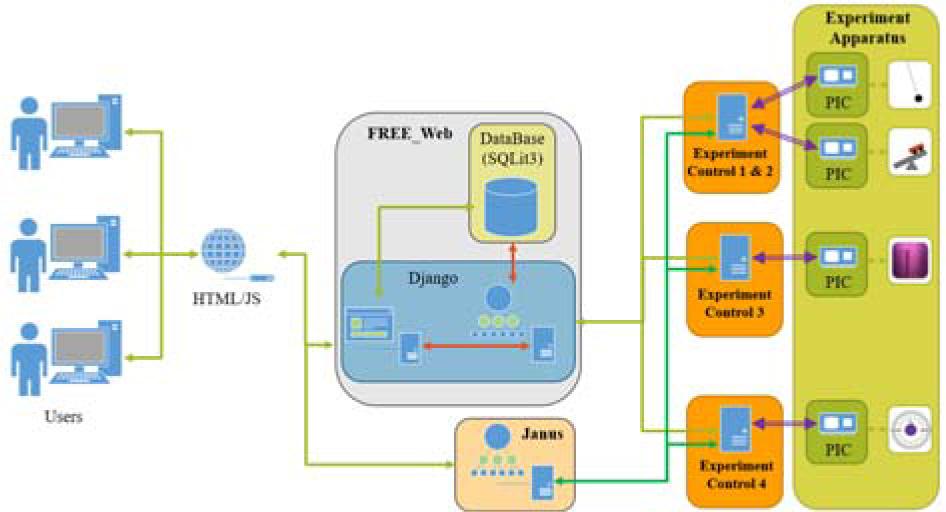
Fig. 2.
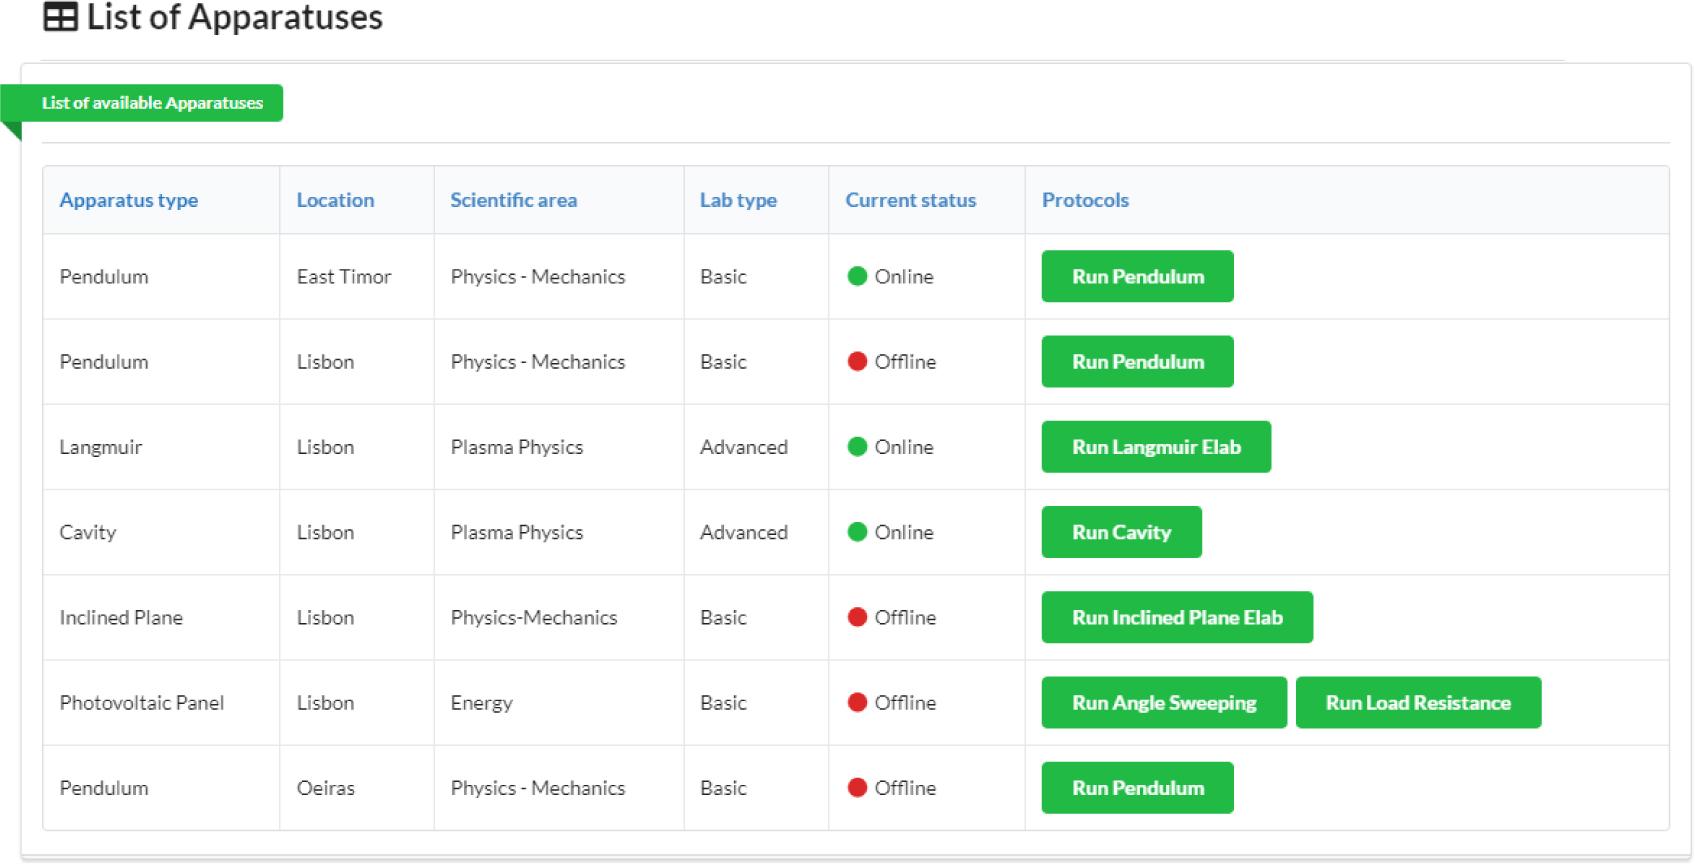
Fig. 3.
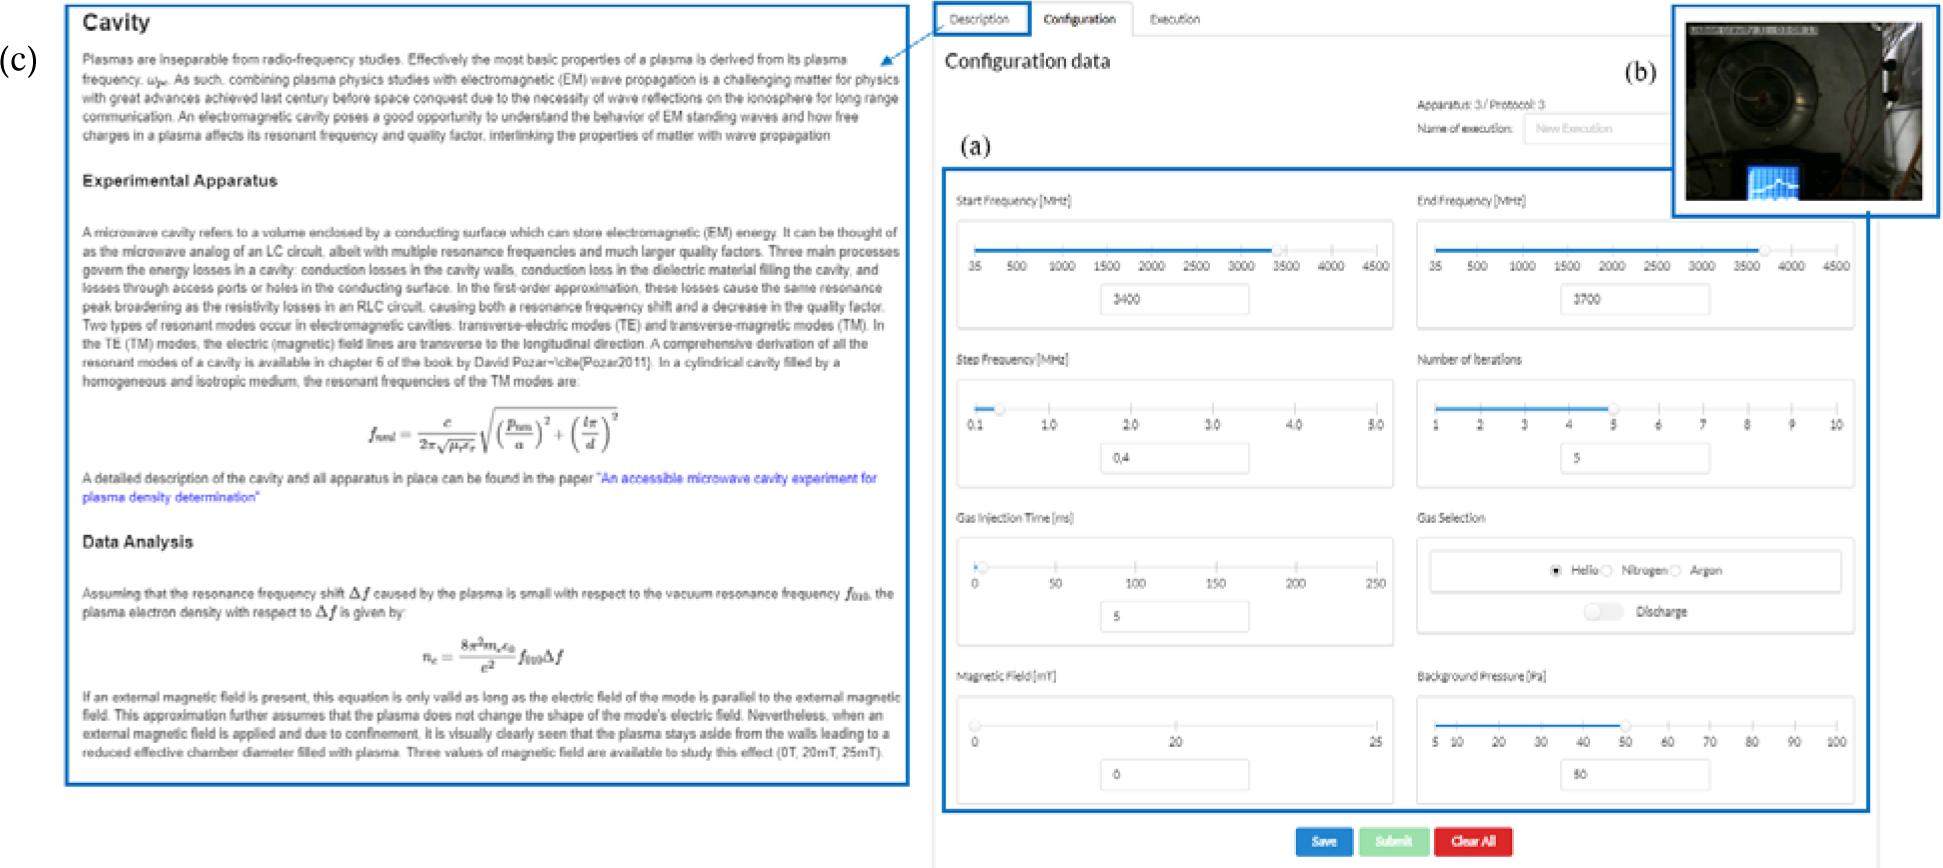
Fig. 4.
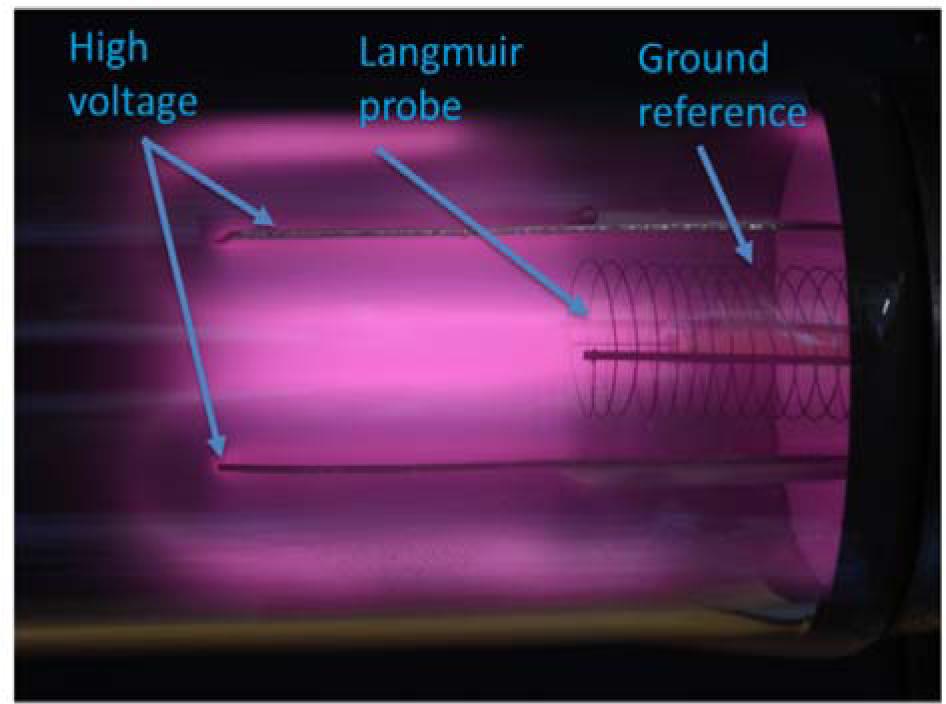
Fig. 5.
Fig. 6.
Fig. 7.
Fig. 8.
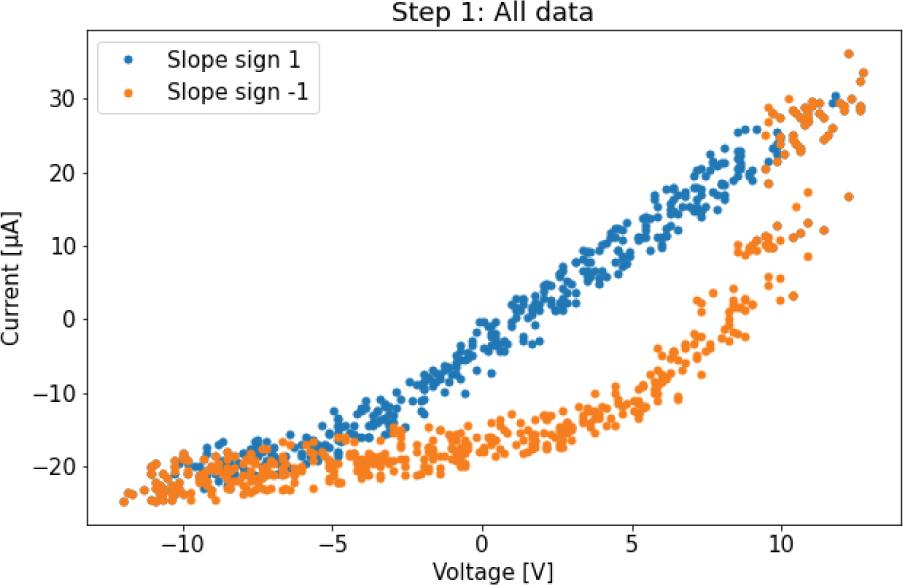
Fig. 9.
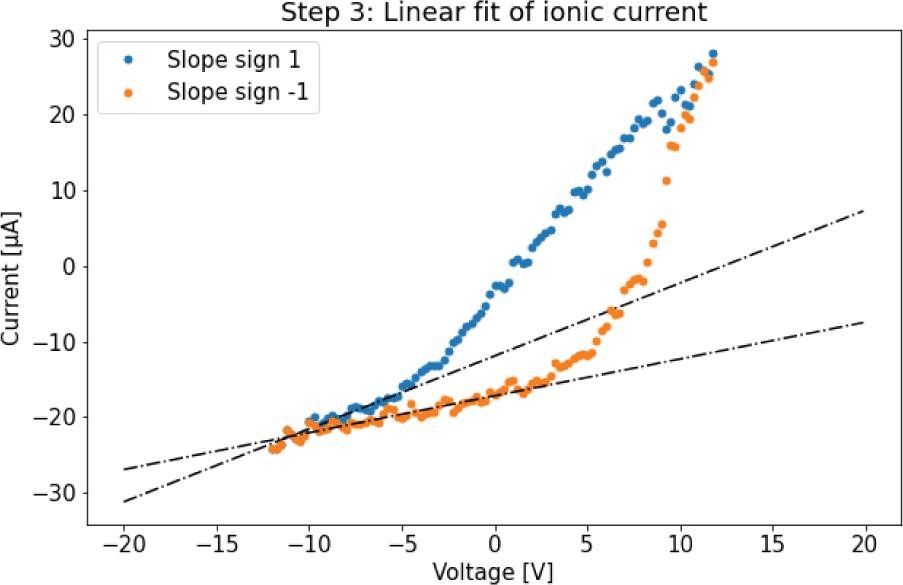
Fig. 10.
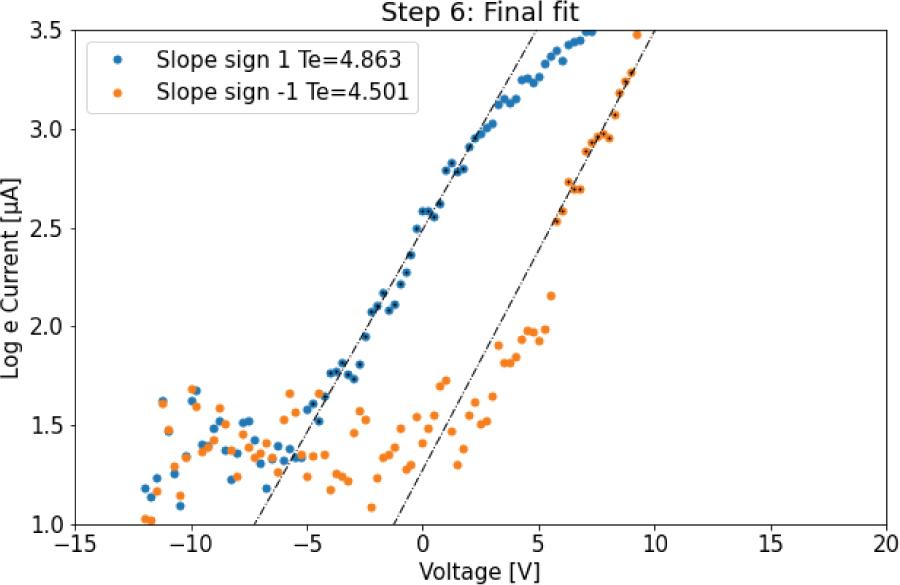
Fig. 11.
Fig. 12.
Fig. 13.
Fig. 14.
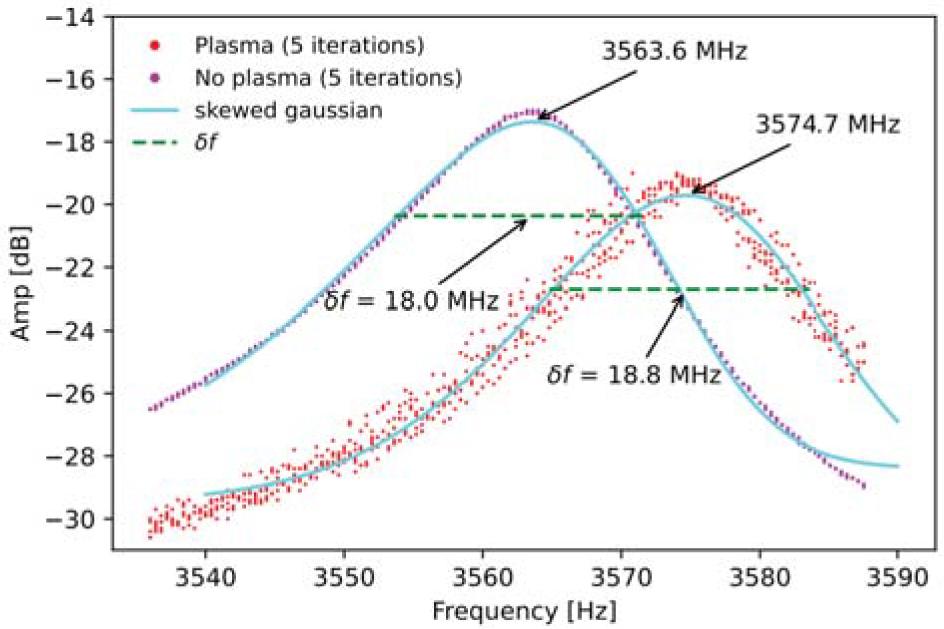
Fig. 15.
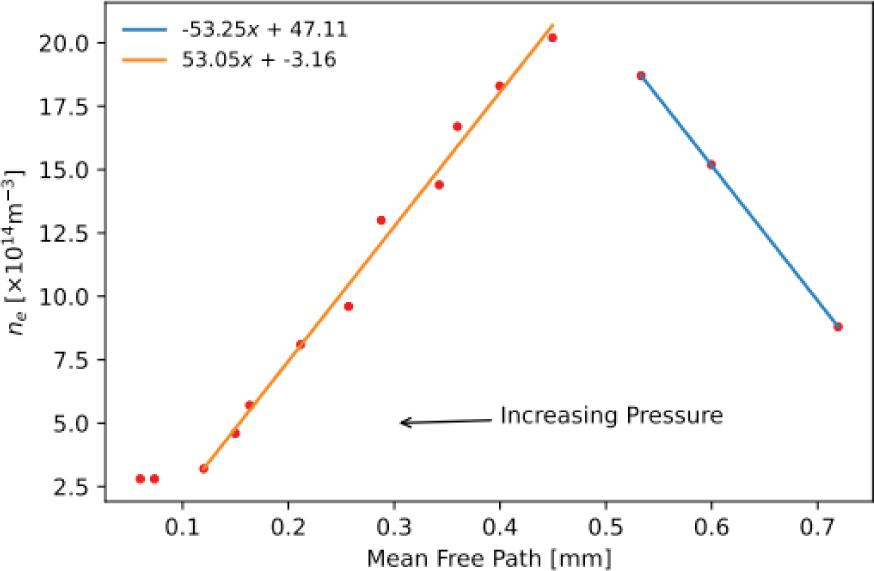
Results of multiple executions with diffrent neutral gas (Ar) pressures and the resultants frequency shift measured
| Pressure injection (Pa) | f | Δf | ne |
|---|---|---|---|
| 8 | 3563.6 | – | – |
| 10 | 3573.6 | 10.0 | 8.8 |
| 12 | 3580.8 | 17.2 | 15.2 |
| 13 | 3584.8 | 21.2 | 18.7 |
| 16 | 3586.4 | 22.8 | 20.2 |
| 18 | 3584.4 | 20.8 | 18.3 |
| 20 | 3582.5 | 18.9 | 16.7 |
| 21 | 3580.0 | 16.4 | 14.4 |
| 25 | 3578.4 | 14.8 | 13.1 |
| 28 | 3574.5 | 10.9 | 9.6 |
| 34 | 3572.8 | 9.2 | 8.1 |
| 44 | 3570.0 | 6.4 | 5.7 |
| 48 | 3568.8 | 5.2 | 4.6 |
| 60 | 3567.2 | 3.6 | 3.2 |
| 98 | 3566.8 | 3.2 | 2.8 |
| 120 | 3566.8 | 3.2 | 2.8 |
Results of multiple executions with different neutral gas pressure (Ar) and results for the ion saturation current, and the respective calculation of the speed of sound and the density
| Pressure (Pa) | Te (eV) | Cs (m/s) | n (×1015 m−3) | |
|---|---|---|---|---|
| 64 | −15.2 | 4.8 | 3405 | 8.9 |
| 100 | −14.2 | 6.3 | 3901 | 7.2 |
| 150 | −12.7 | 5.7 | 3711 | 6.8 |
Parameters obtained after the fitting shown in Fig_ 9, the ion saturation current
| Slope | α(1/V) | Vf (V) | |
|---|---|---|---|
| 1 | 0.96 | 12.38 | −17.2 |
| −1 | 0.49 | 35.33 | −17.6 |