
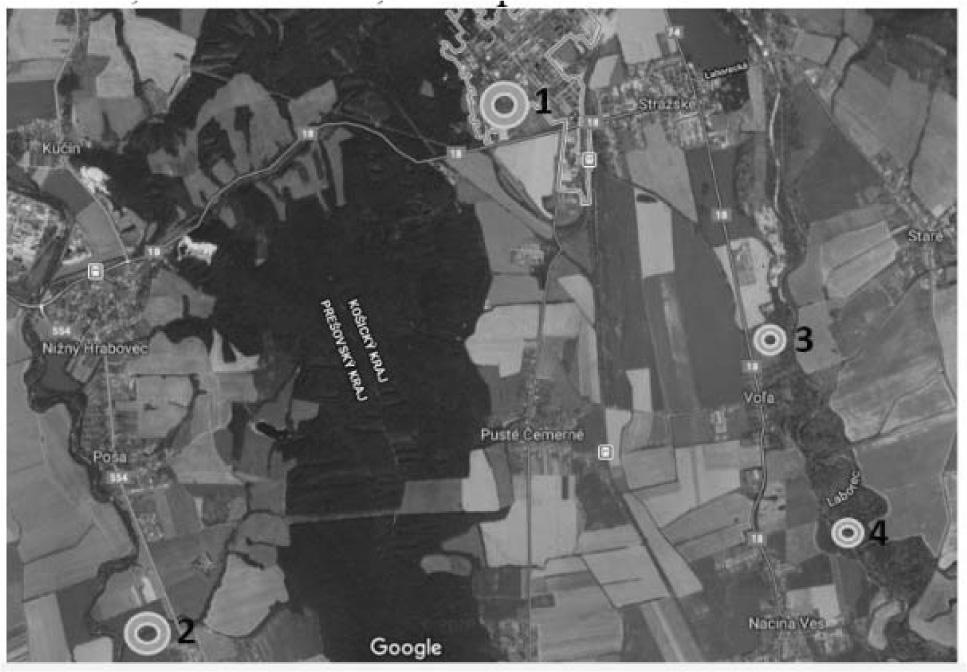
Fig. 1
Positions of current main sources of environmental load of PCBs in Eastern Slovakia.

Fig. 2
Chemical structures of selected PCB congeners.
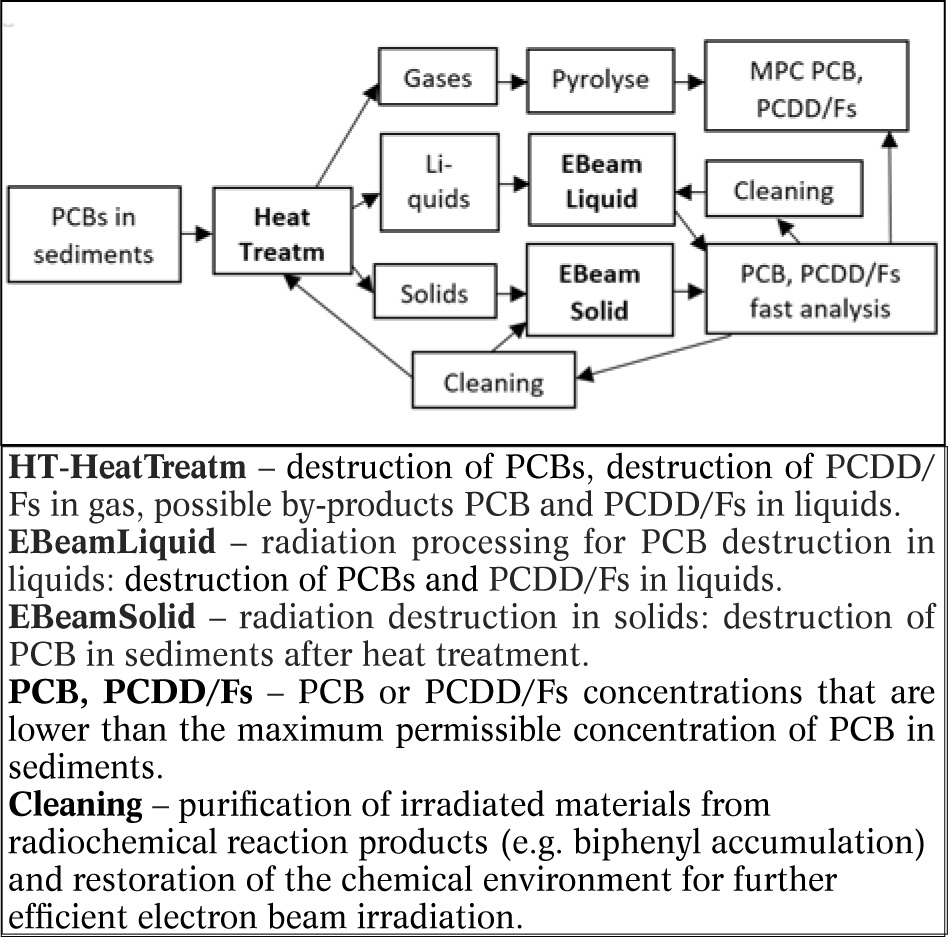
Fig. 3
Block diagram of the design of optimization of interconnection of HT methods with radiation treatment method in their complementary interaction.
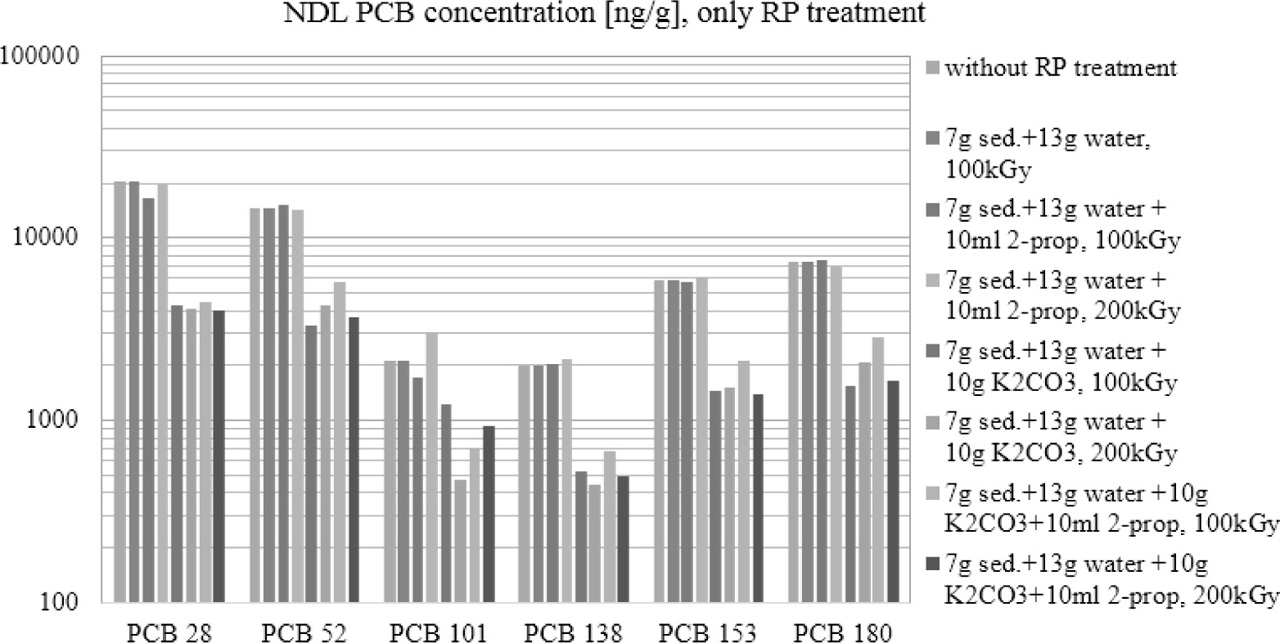
Fig. 4
Concentrations of NDL-PCBs in samples of sediments treated with RP.
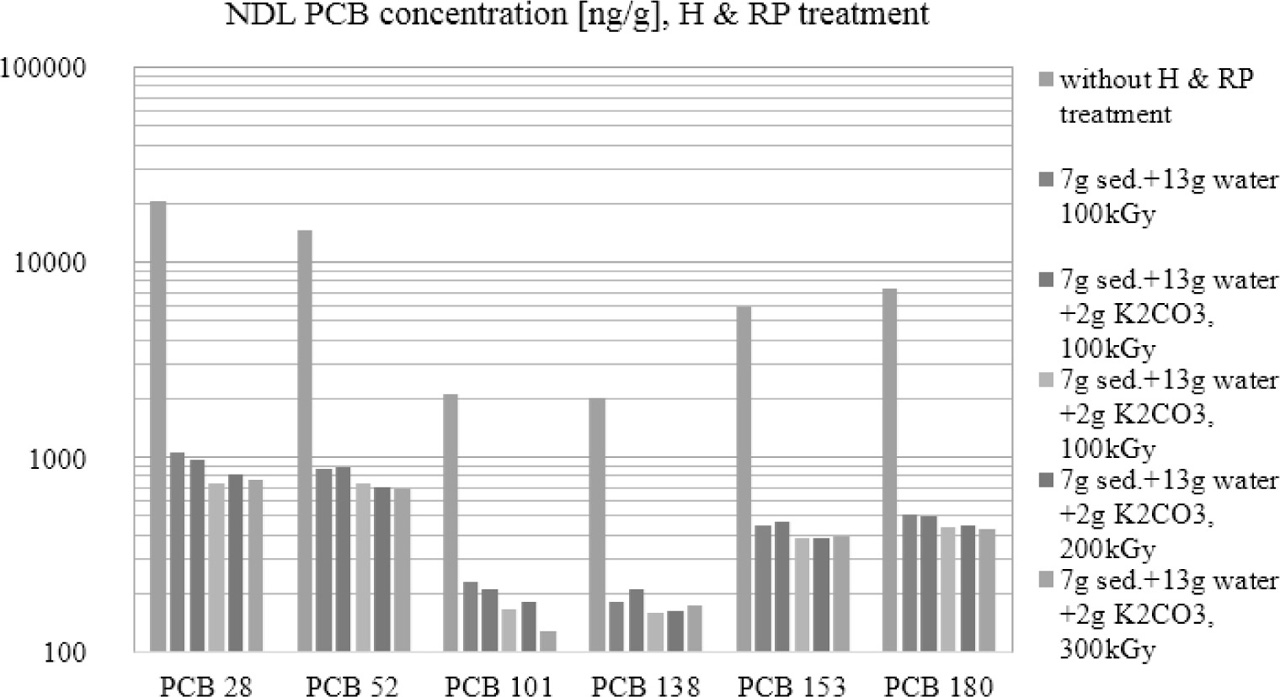
Fig. 5
Comparison of NDL-PCB concentrations in untreated sediment samples with RP-treated samples following HT.
Table 1
NDL-PCB concentration (ng/g) in sediments