
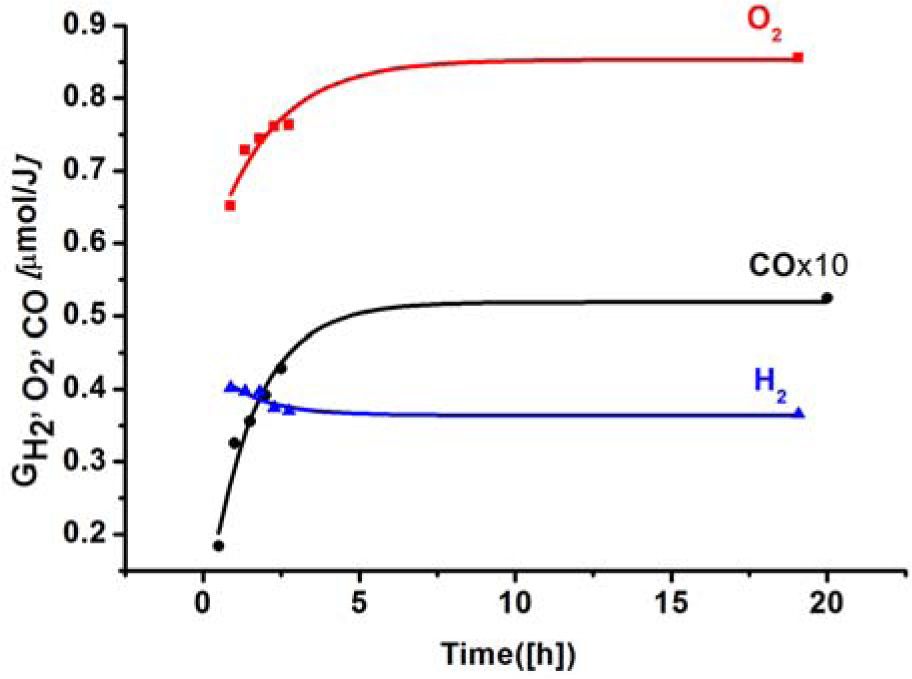
Fig. 1
Radiation yields of H2, O2, and CO in the function post-irradiation time (PP) [7].
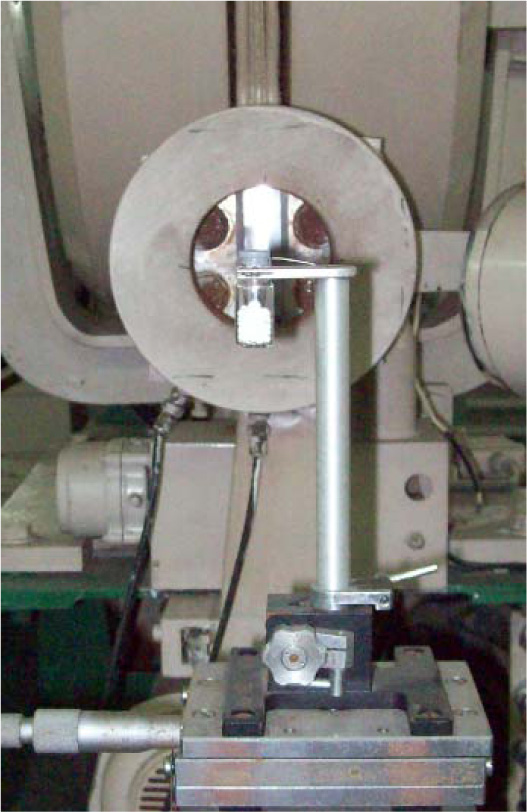
Fig. 2
LAE 13/9 electron accelerator in the setting for direct beam irradiation. Bottle with a PP sample on the background of the accelerator window.
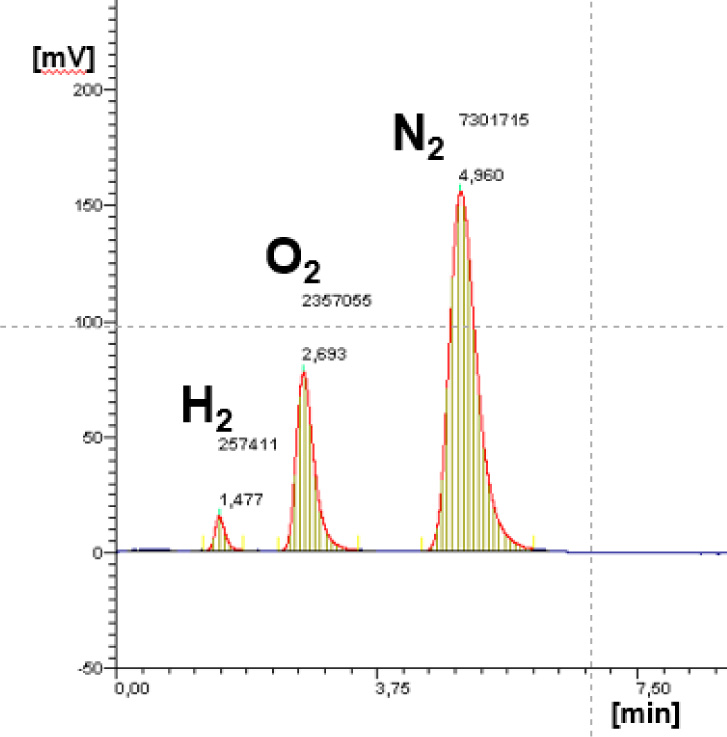
Fig. 3
Sample chromatogram of PP radiolysis products. The figure shows the retention times and the area under the peaks in relative units next to the peaks.
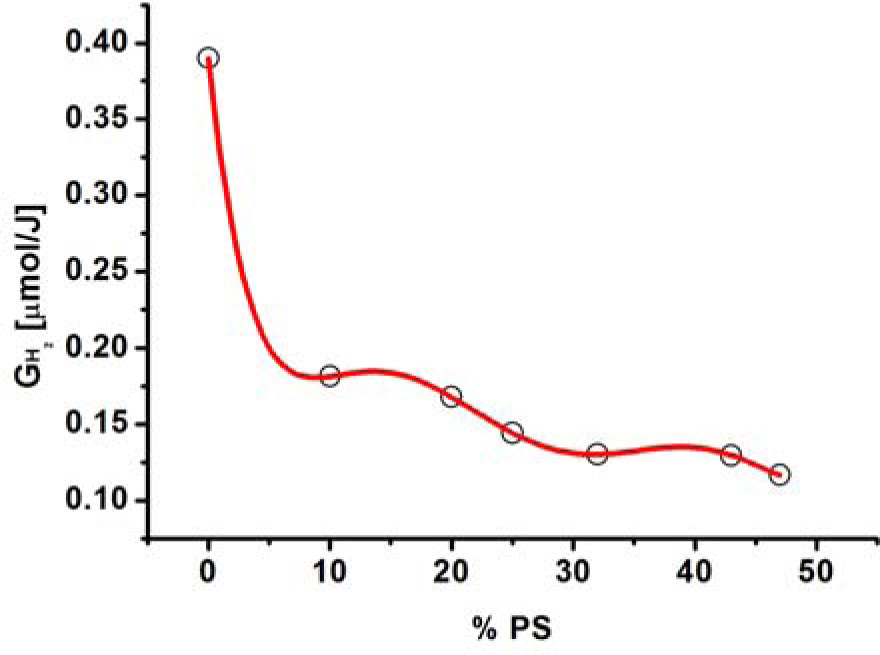
Fig. 4
Dependence of the radiation efficiency of hydrogen evolution on the PS content in the PP/PS blend “B”.
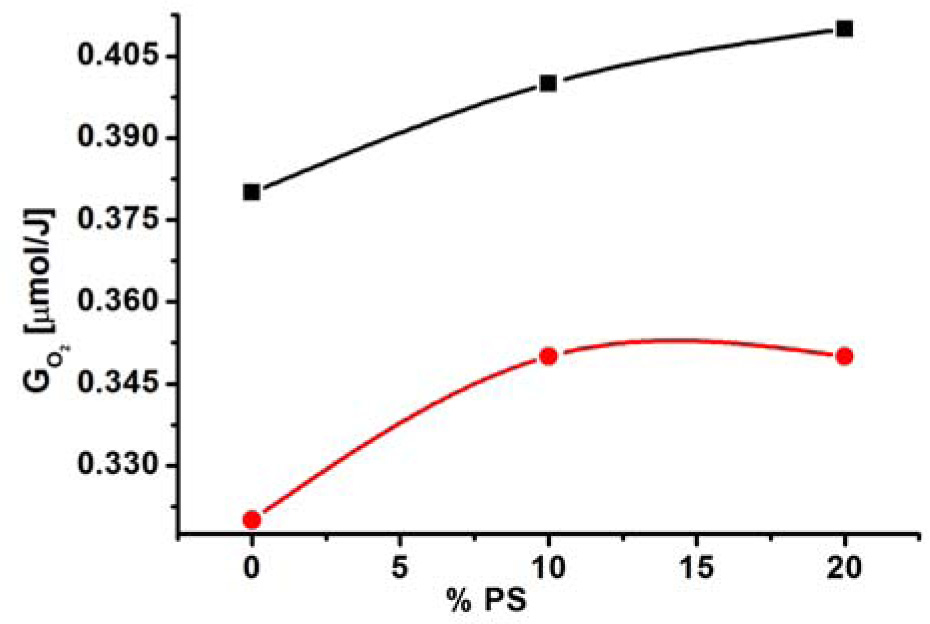
Fig. 5
Dependence of the radiation efficiency of oxygen absorption on the content of PS in the PP/PS blend “B.” Irradiation was carried out at room temperature  and liquid nitrogen
  .
.
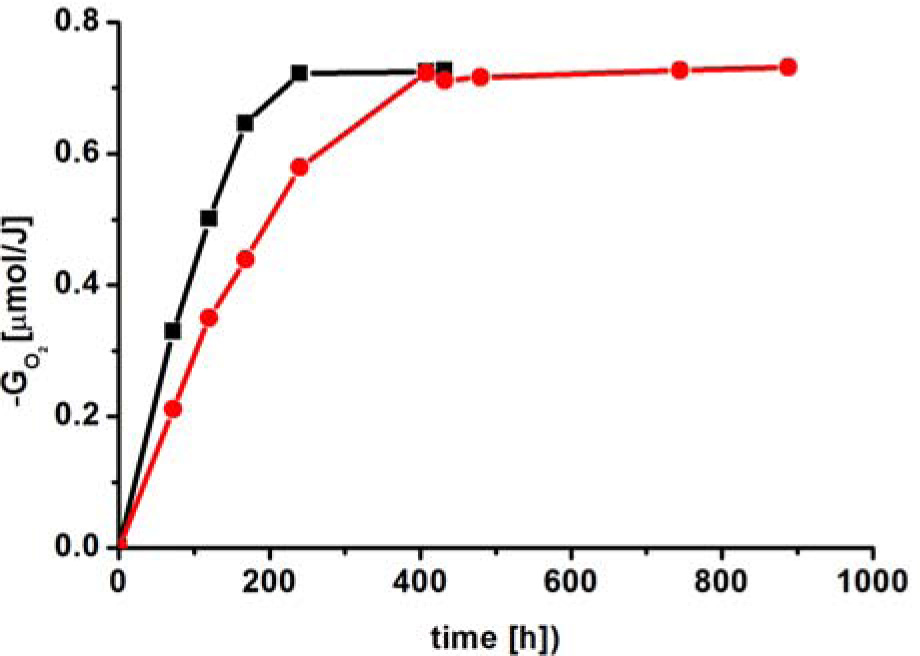
Fig. 6
Yields of post-radiation oxidation of PP, irradiated at room temperature and liquid nitrogen temperature ( −196°C,
  +22°C). Dose 28 kGy.
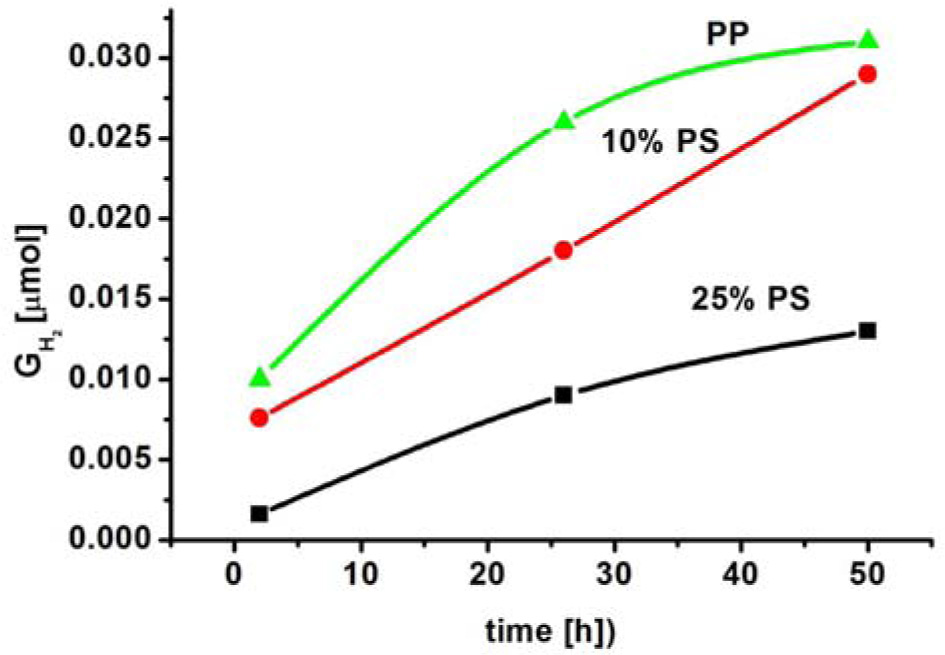
Fig. 7
Time dependence of the post-radiation efficiency of hydrogen evolution.
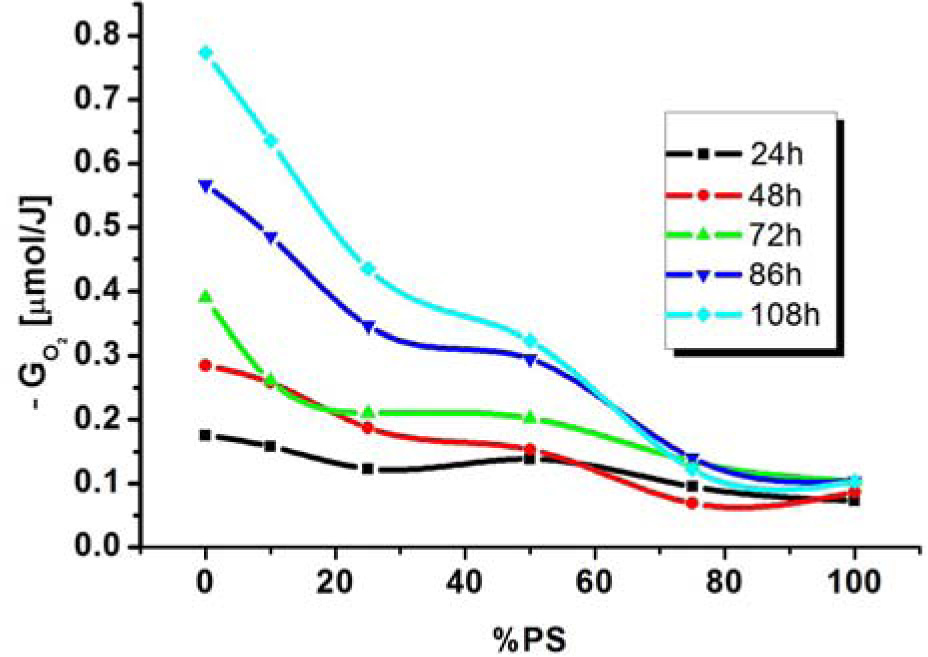
Fig. 8
Radiation performance of oxygen absorption by PP and PP/PS (“A”) compositions during irradiation and after irradiation. The bottle was not opened after irradiation. Dose 10 kGy.
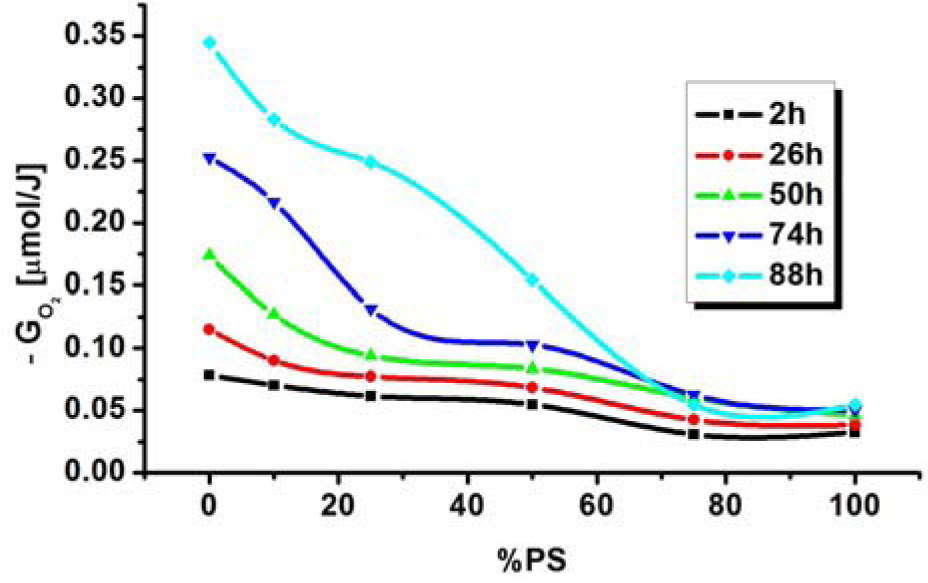
Fig. 9
Oxygen absorption efficiency in post-radiation processes (“A”). The irradiated bottles were opened and closed again after heating. Dose 10 kGy.
Table 1
Yields (G) of gaseous products in radiolysis of PP powder soaked with solutions of aromatic compounds. Analyses were made after irradiation (0.5 h) and after 24 hours (24 h)
| Addition | GH2 | GO2 | GCO (μmol/J) | GO2 | GCO |
|---|---|---|---|---|---|
| 0.5 h | 24 h | ||||
| PP | 0.377 | −0.558 | 0.033 | −0.609 | 0.100 |
| Anthracene | 0.299 | −0.521 | 0.030 | −0.608 | 0.063 |
| Fluoranthene | 0.274 | −0.492 | 0.026 | −0.584 | 0.059 |
| Acenaphthene | 0.263 | −0.529 | 0.005 | −0.610 | 0.017 |
| Pyrene | 0.215 | −0.525 | 0.015 | −0.603 | 0.051 |
| Naphthalene | 0.270 | −0.431 | 0.012 | −0.565 | 0.023 |
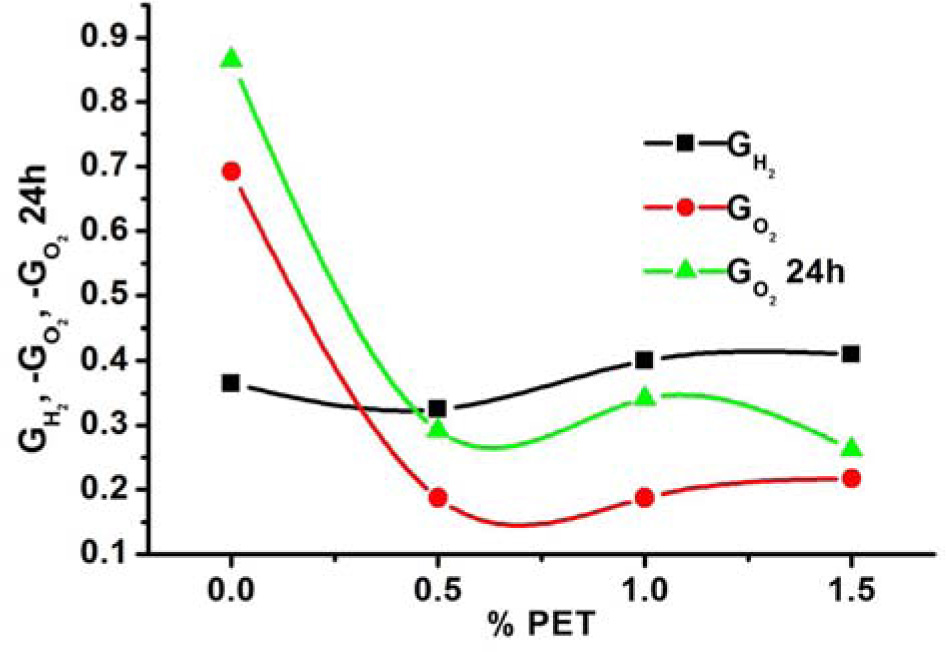
Fig. 10
Relationships of radiation efficiency of gas products as a function of PET content (analyses carried out after irradiation and after 24 h).