Fig. 1
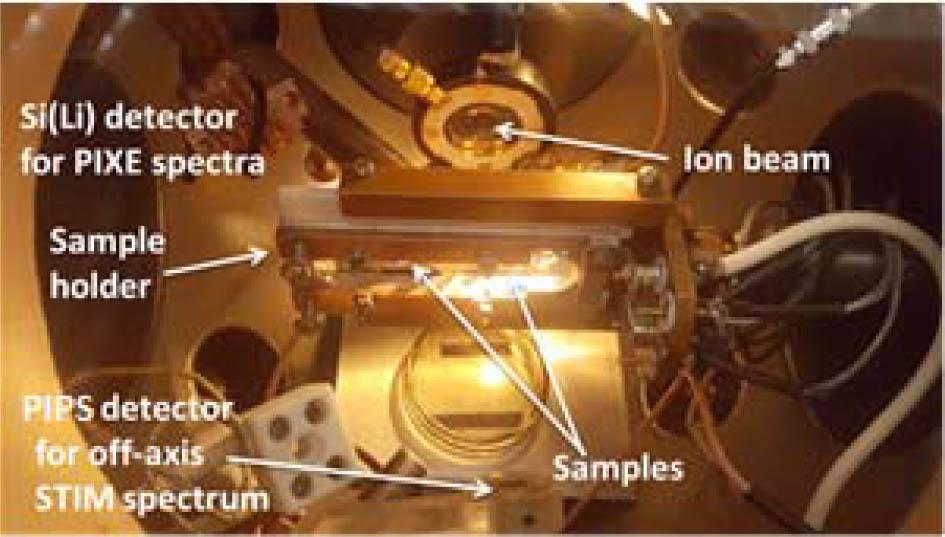
Fig. 2
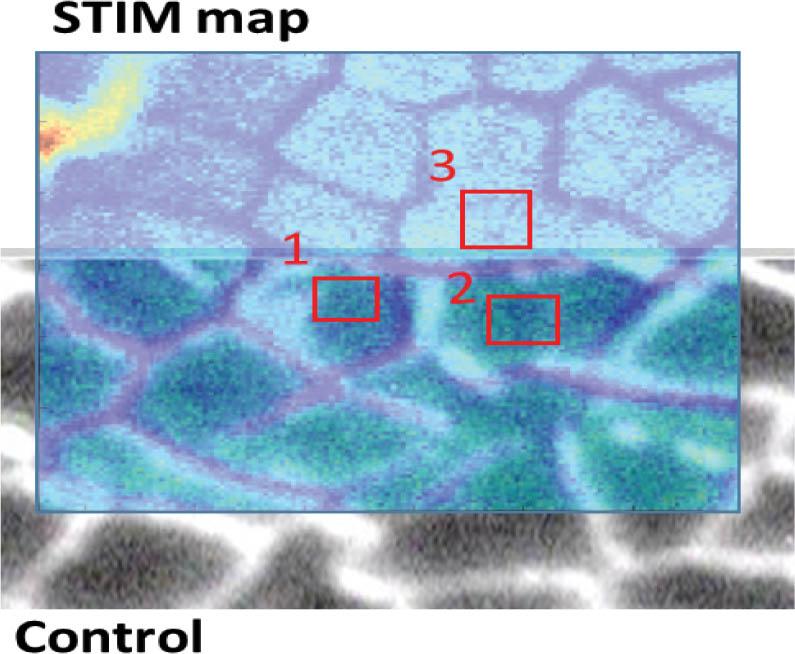
Fig. 3
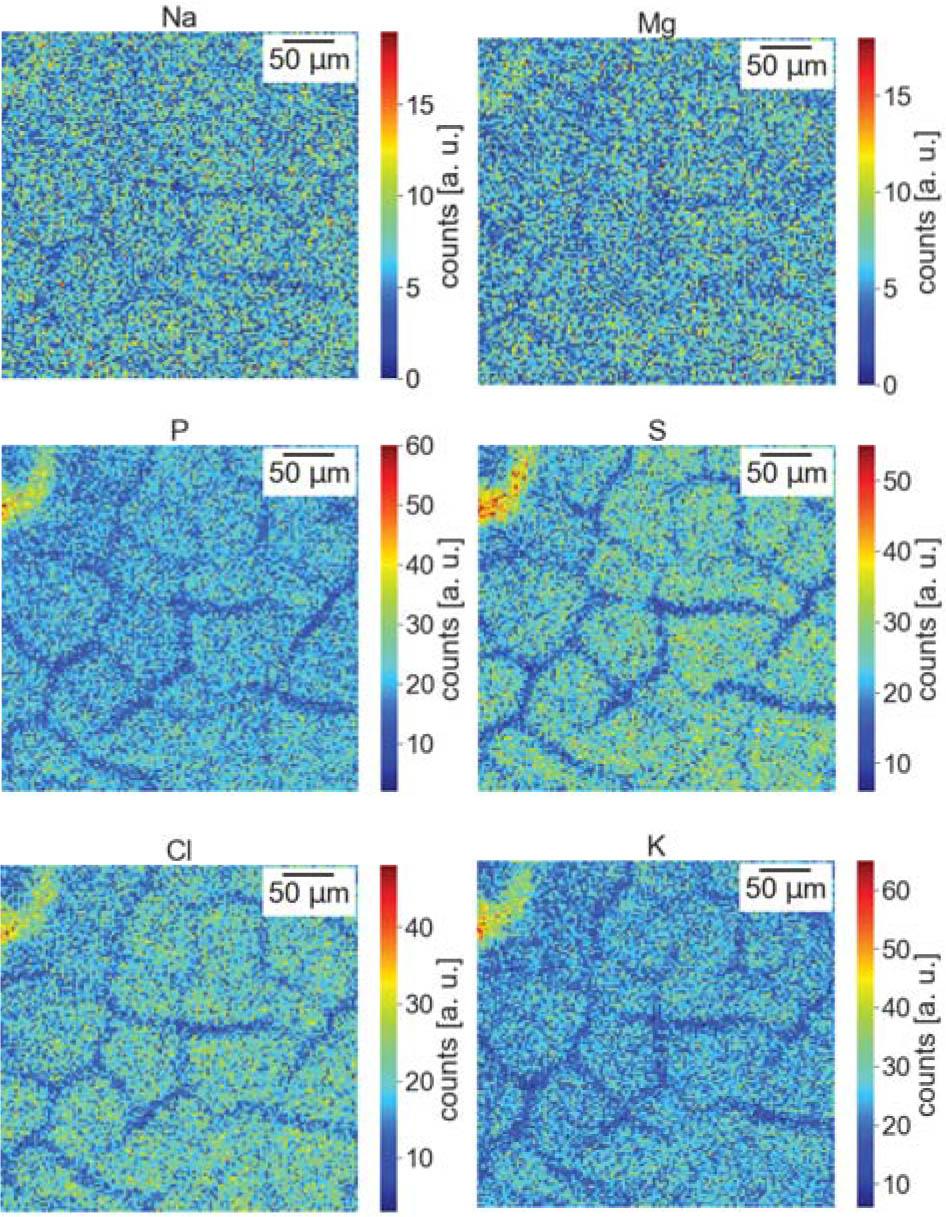
Fig. 4
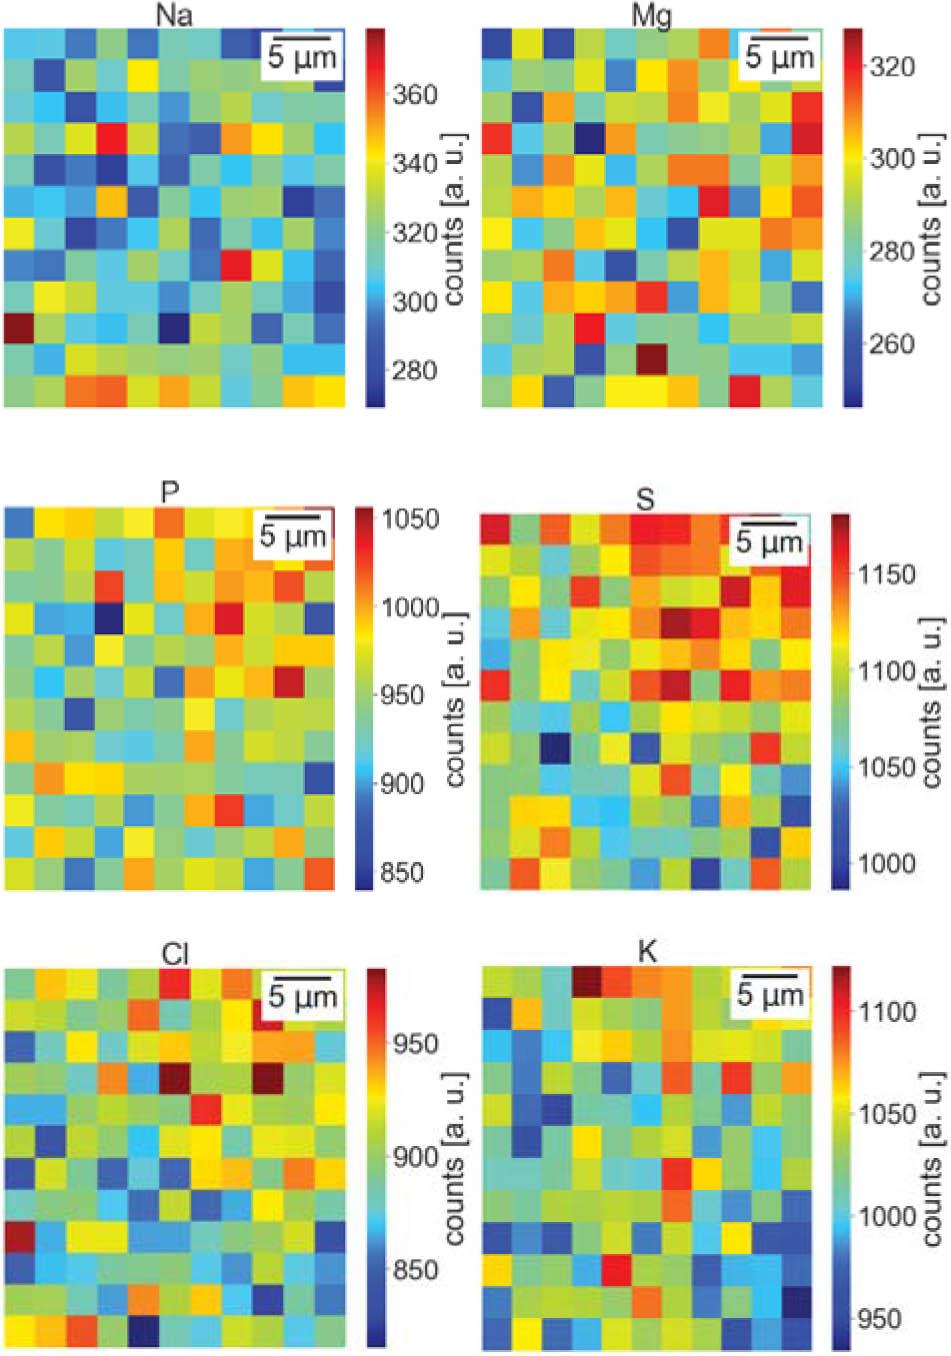
Fig. 5
Fig. 6
Fig. 7
Fig. 8
Fig. 9
Partial Wilks’ lambda values
| Partial Wilks’ lambda | ||||||||
|---|---|---|---|---|---|---|---|---|
| K | S | Na | Cl | P | Mg | Zn | Fe | Br |
| 0.24 | 0.70 | 0.95 | 0.59 | 0.65 | 0.93 | 0.99 | 0.99 | 0.99 |

| Partial Wilks’ lambda | ||||||||
|---|---|---|---|---|---|---|---|---|
| K | S | Na | Cl | P | Mg | Zn | Fe | Br |
| 0.24 | 0.70 | 0.95 | 0.59 | 0.65 | 0.93 | 0.99 | 0.99 | 0.99 |
© 2021 Patrycja Śliż-Szpytma, Marek Lankosz, Joanna Dudała, Dariusz Adamek, Edyta Radwanska, Borys Kwinta, Milko Jakšić, Iva Božičević Mihalić, Georgios Provatas, published by Institute of Nuclear Chemistry and Technology
This work is licensed under the Creative Commons Attribution-NonCommercial-NoDerivatives 4.0 License.