

Fig. 1
The ESS linac schema.
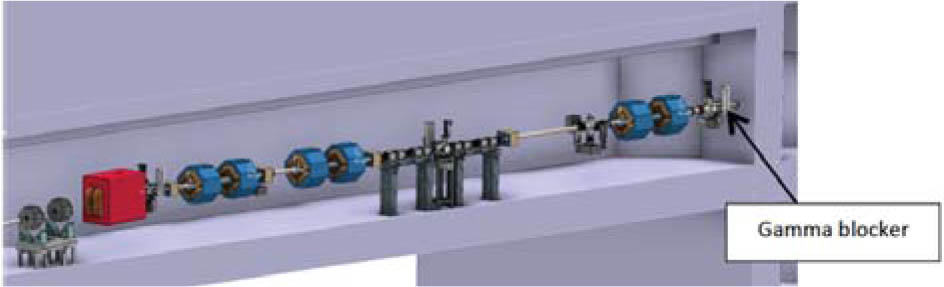
Fig. 2
Schema of the A2T section of the HEBT area.
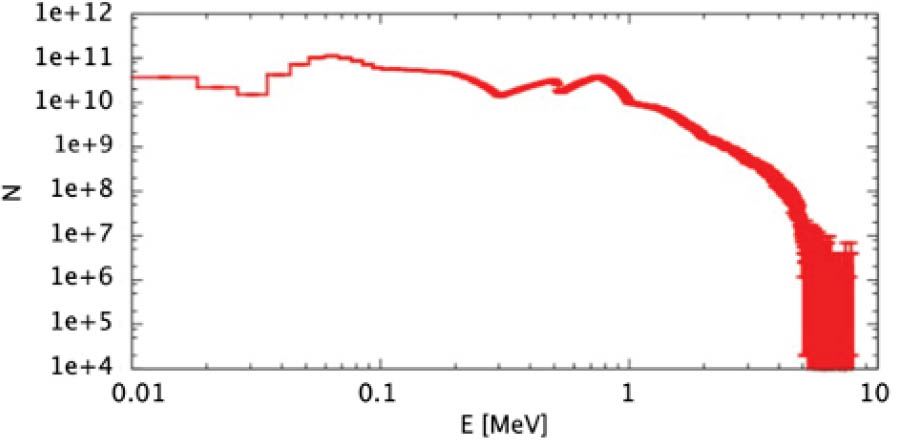
Fig. 3
Implemented gamma radiation spectrum from the external target wheel surface – results of simulations in the FLUKA software.
Table 1
Proton beam parameters used in the simulation
| Beam properties | |
|---|---|
| Energy (GeV) | 2.00 |
| Power (MW) | 5.00 |
| Pulse current (mA) | 62.50 |
| Average current (mA) | 2.50 |
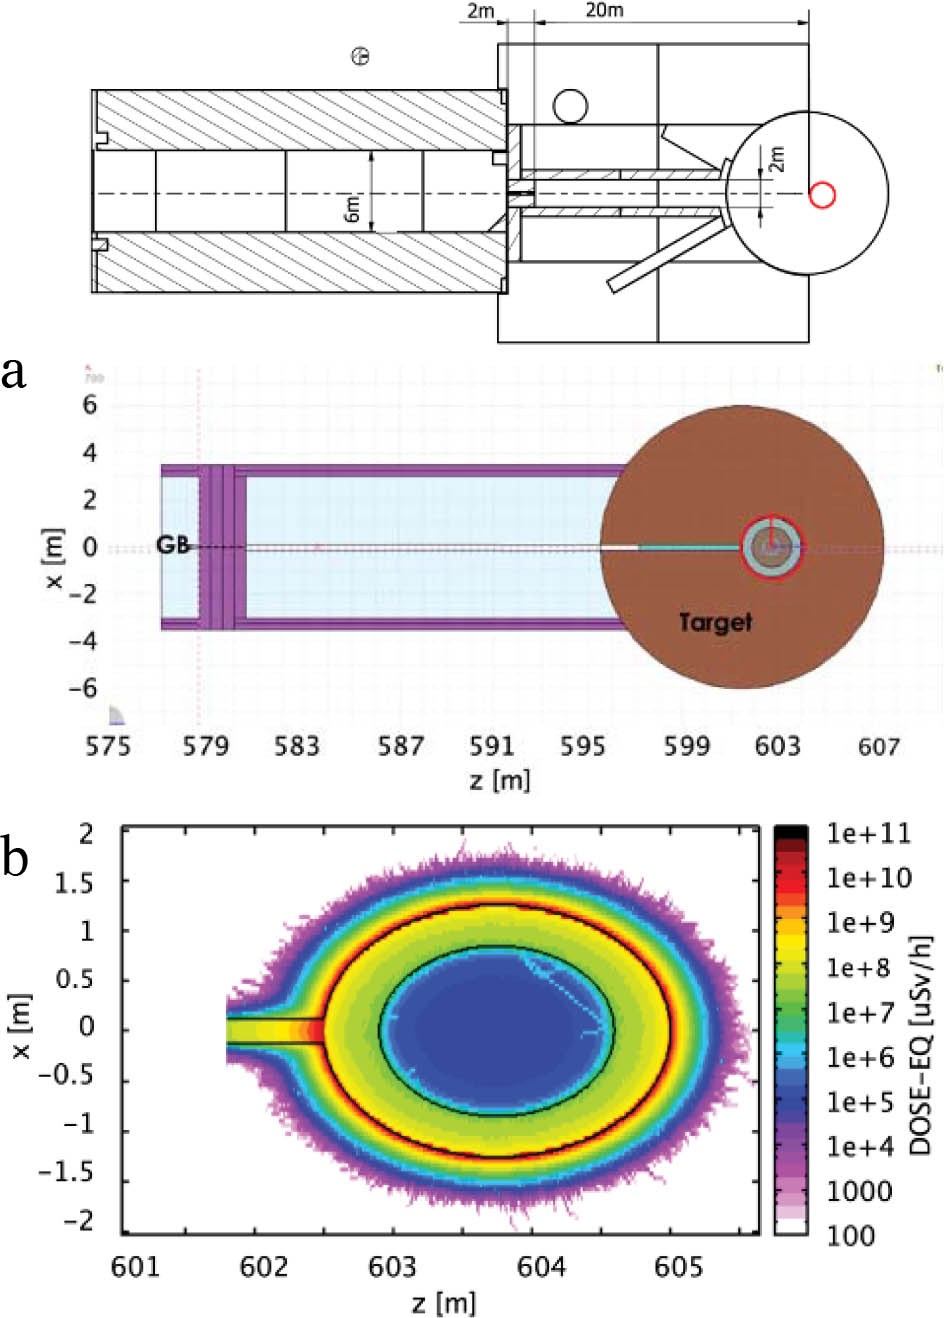
Fig. 4
(a) Schematic view of the target area. Isotropic gamma source was implemented on the external surface of the target wheel (red line). (b) Dose rates obtained after the implementation of the gamma source. The origin of the z-axis starts at the proton source of the linac.
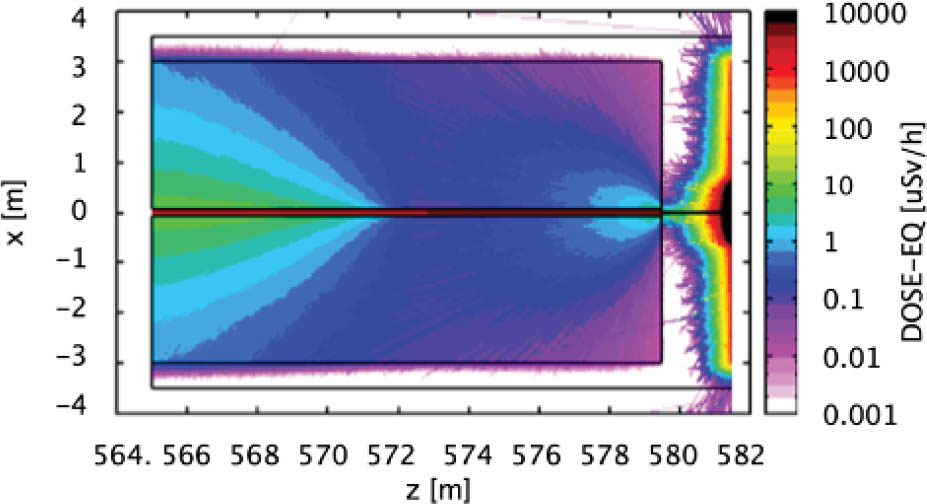
Fig. 5
Residual dose rates after five years of continuous irradiation, and no cooling time. The origin of the z-axis starts at the proton source of the linac.
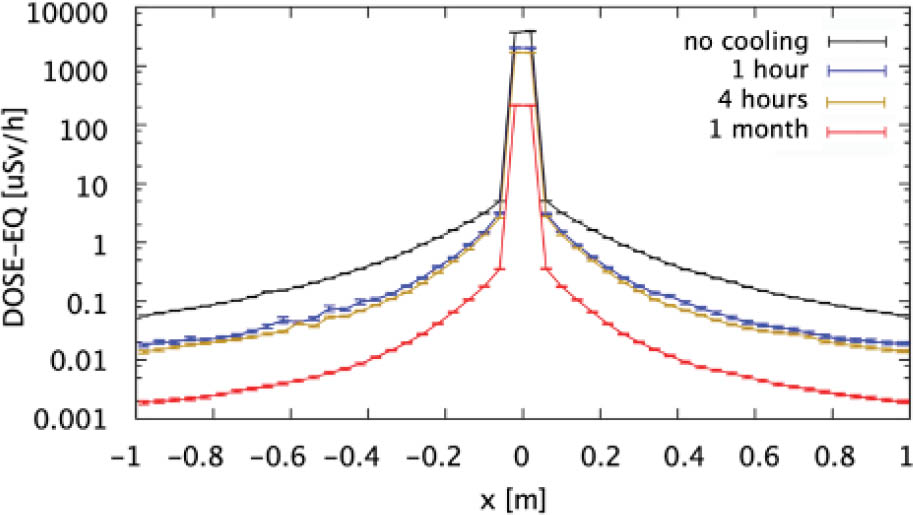
Fig. 6
Gamma radiation dose rate vs. distance from the beam pipe. Projection on X-axis (transverse to the beam axis) at z = 579.5 m, for different cooldown times.
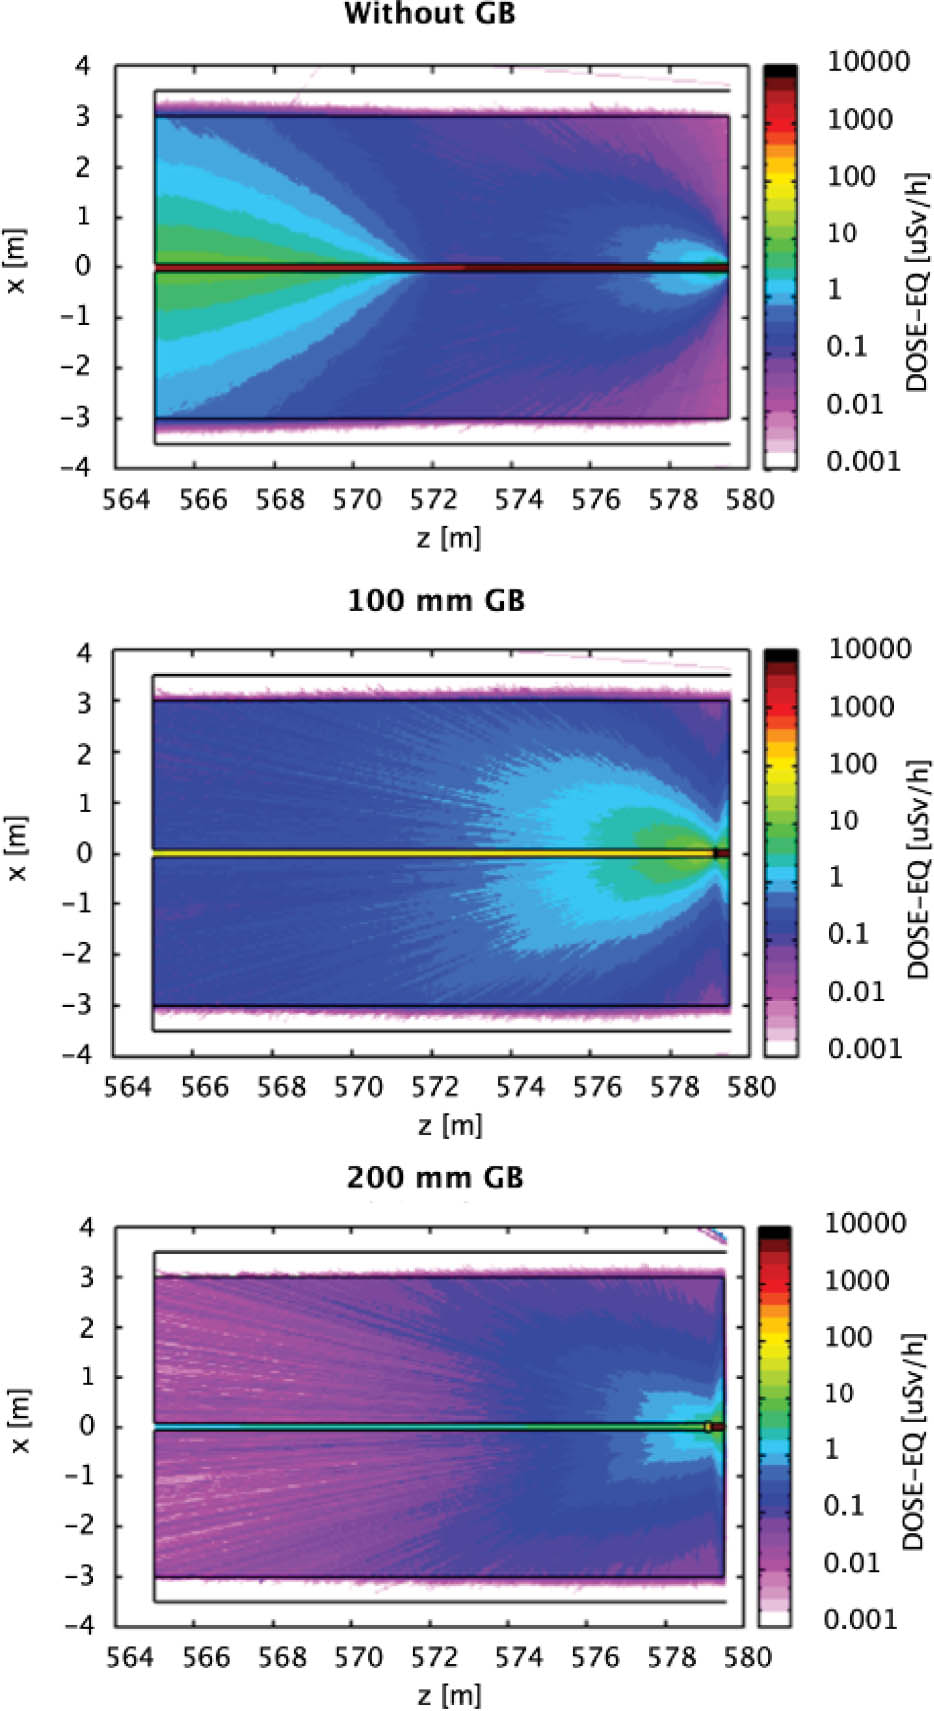
Fig. 7
Dose rate after five years of exposure and no cooling time, for different GB thicknesses.
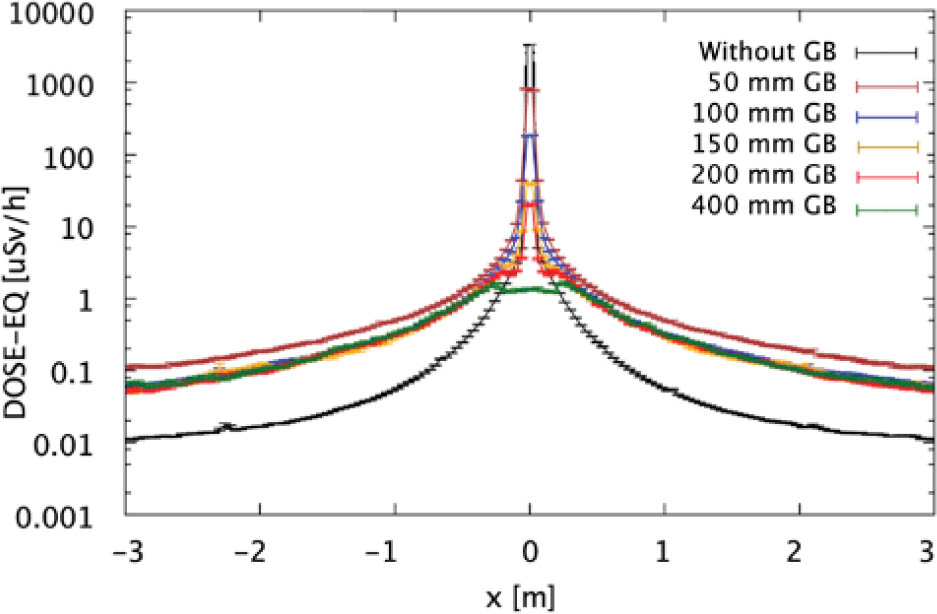
Fig. 8
Residual dose rate vs. distance from the beam pipe. Projection on X-axis at z = 579.5 m after five years of exposure and no cooling time, for different GB thicknesses.
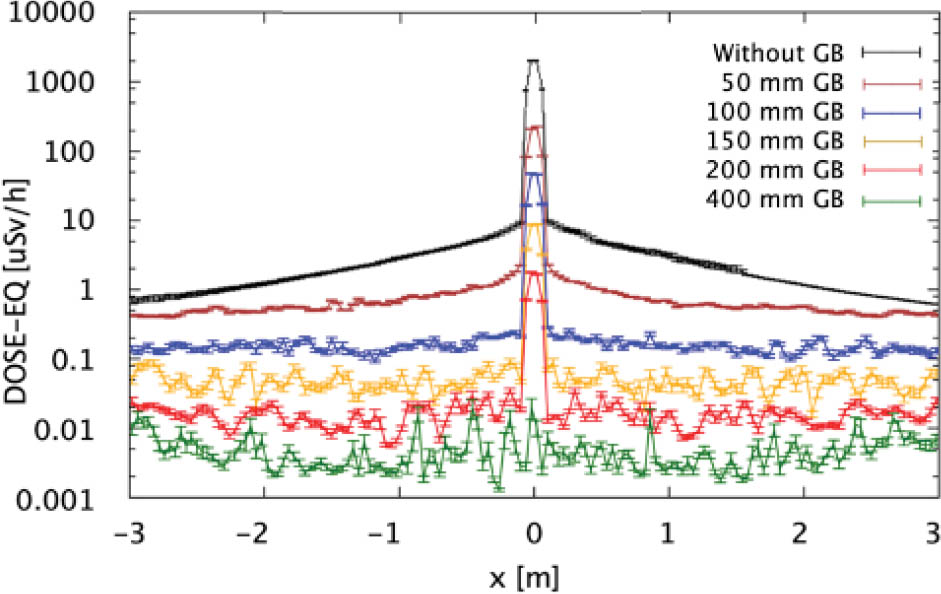
Fig. 9
Residual dose rate vs. distance from the beam pipe. Projection in X-axis at z = 565 m, after five years of exposure and no cooling time for different GB thicknesses.
Table 2
Dose rates inside the beam pipe, after five years of exposure and various cooling times, for different GB thicknesses
| GB thickness (mm) | Dose rate after five years of exposure (μSv/h) | |||
|---|---|---|---|---|
| No cooling | 1 hour cooling | 4 hours cooling | 1 month cooling | |
| 0 | 3800 ± 152 | 2060 ± 103 | 1700 ± 68 | 230 ± 9.2 |
| 50 | 850 ± 32 | 460 ± 14.8 | 370 ± 11 | 58 ± 2.8 |
| 100 | 180 ± 7.2 | 92 ± 3.4 | 72 ± 2.8 | 9 ± 0.36 |
| 150 | 40 ± 1.6 | 21 ± 0.84 | 18 ± 0.72 | 2.2 ± 0.09 |
| 200 | 14 ± 0.5 | 6 ± 0.24 | 5 ± 0.2 | 0.8 ± 0.03 |
| 400 | 1.150 ± 0.046 | 0.850 ± 0.034 | 0.54 ± 0.02 | 0.200 ± 0.008 |
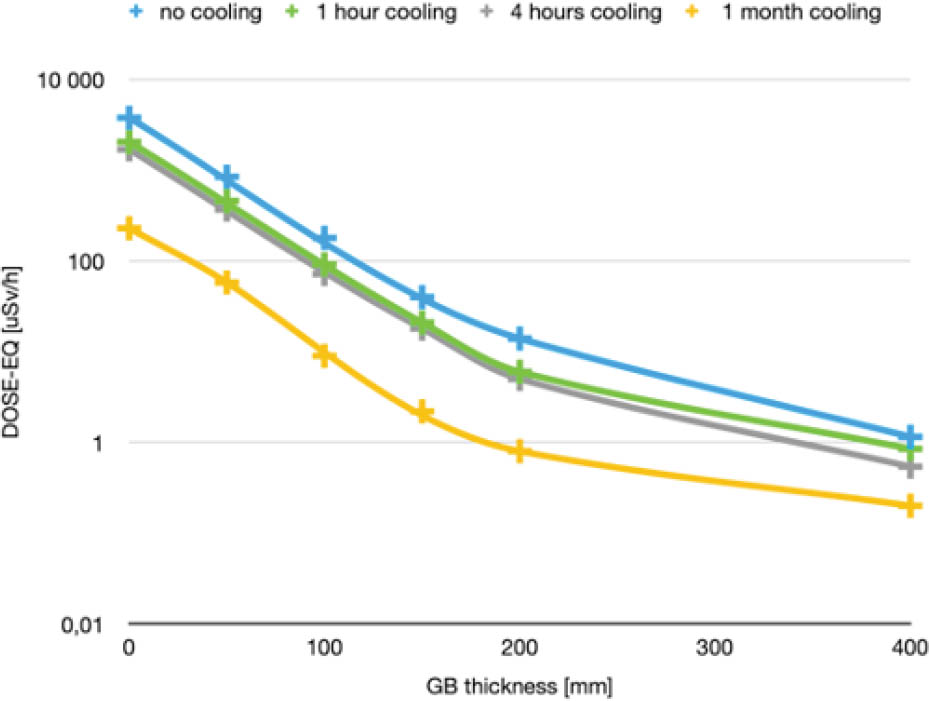
Fig. 10
Residual dose rate inside the beam pipe as a function of GB thickness, after five years of exposure, for various cooling times.