
Fig. 1
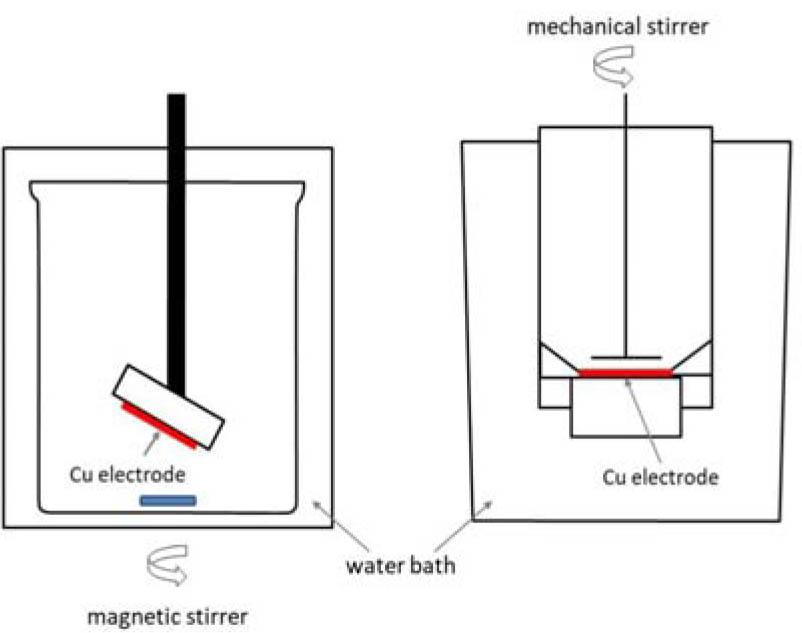
Fig. 2
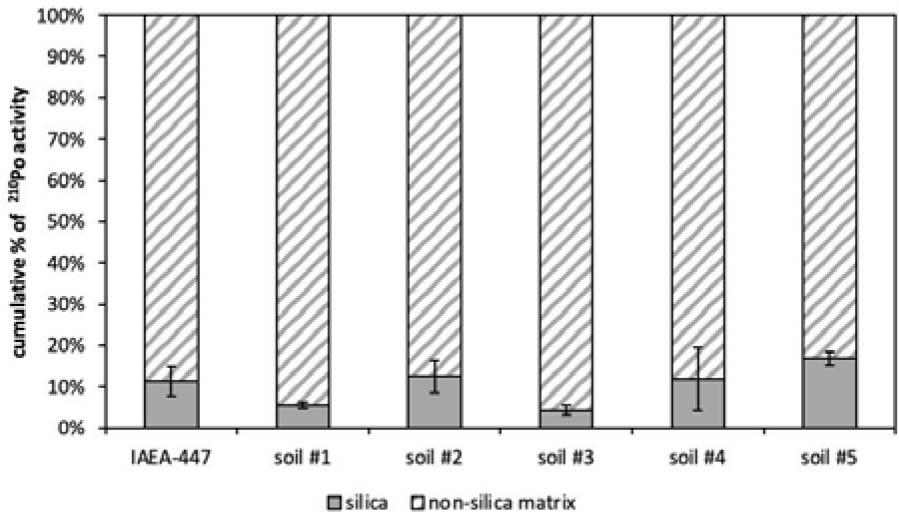
Fig. 3
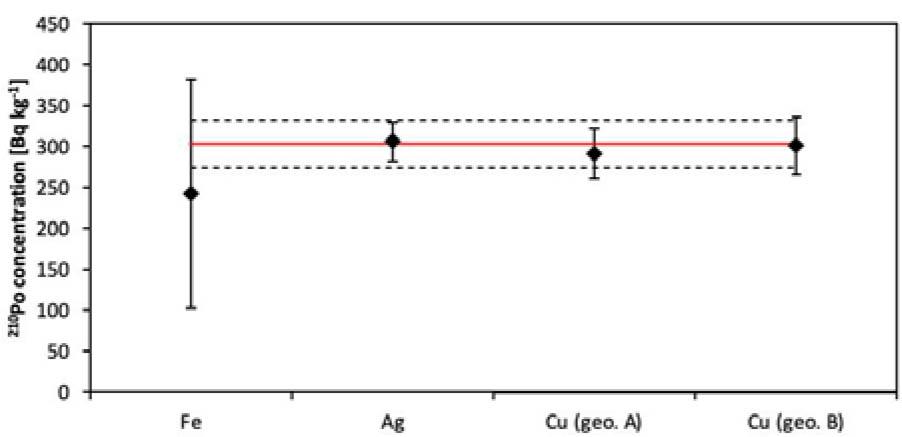
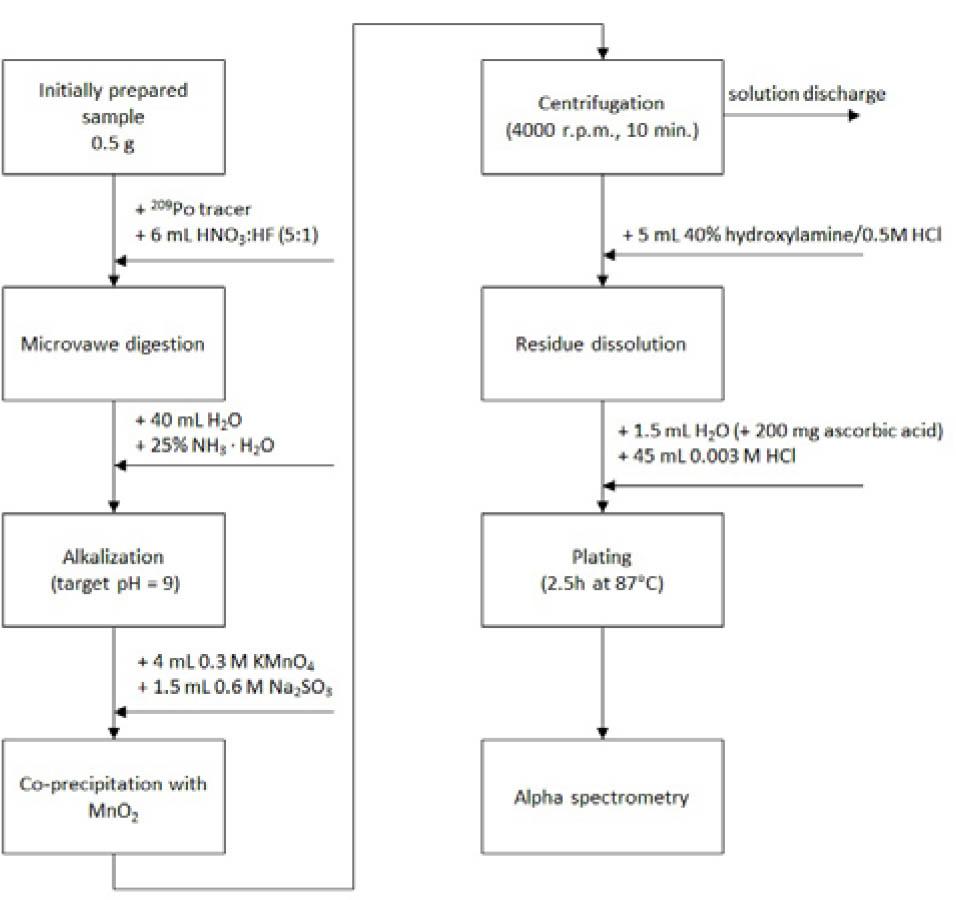
Fig. 4
Validation parameters of samples from plating optimization experiment, calculations performed for expanded uncertainty (k = 2)
| Electrode | 210Po (Bq·kg−1) | Z-score | U-score |
|---|---|---|---|
| Fe | 240 ± 140 | −2.11 | −0.90 |
| Ag | 306 ± 24 | 0.07 | 0.11 |
| Cu (geom. A) | 291 ± 31 | −0.61 | −0.61 |
| Cu (geom. B) | 301 ± 35 | −0.10 | −0.13 |
Activity concentration of 210Po in soil samples
| Sample | 210Po activity (Bq·kg−1) | Type of fertilizer |
|---|---|---|
| Soil 1 | 68.9 ± 7.7 | nitrogen |
| Soil 2 | 195 ± 12 | phosphate |
| Soil 3 | 12.1 ± 1.8 | nitrogen |
| Soil 4 | 15.3 ± 2.6 | nitrogen |