
Figure 1:

Figure 2:

Figure 3:

Figure 4:
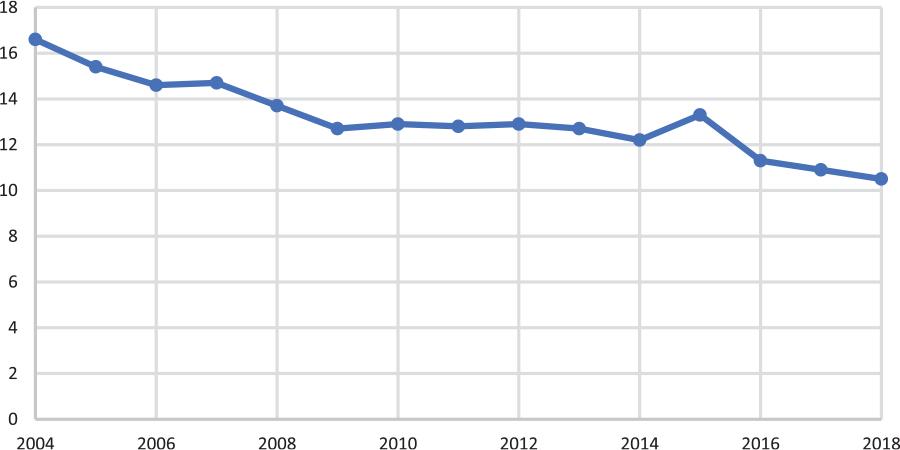
Figure 5:
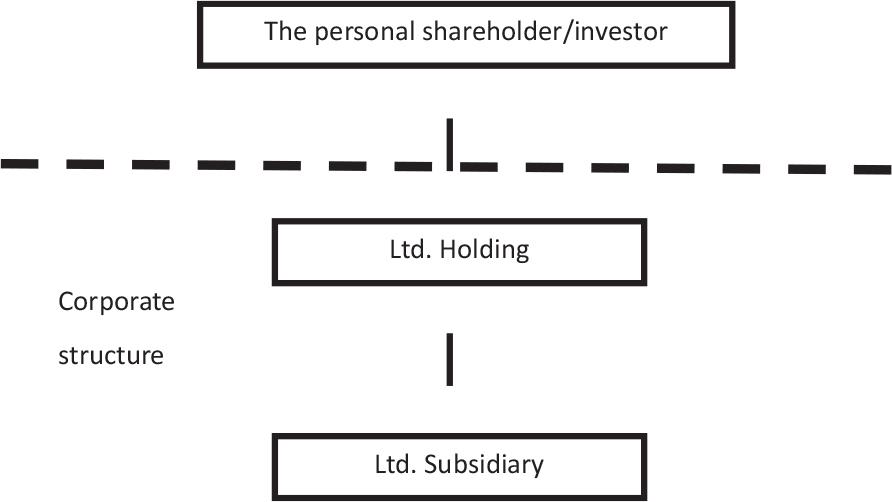
Ltd_ Holding (NOK)
| Dividends from subsidiary | 86.9 | |
| Corporate tax (0% on dividends) | 0% | 0 |
| Surplus after tax | 86.9 | |
| Dividend to personal shareholder | –8.3 | |
| Retained earnings | 78.6 |
Annual tax rates (percent)
| Calendar year | Average effective tax rate (AETR) | Headline corporate tax | Headline dividend tax | Headline wealth tax | Equity wealth rebate |
|---|---|---|---|---|---|
| 2004 | 16.6 | 28 | 0 | 1.1* | 0 |
| 2005 | 15.4 | 28 | 0 | 1.1* | 35 |
| 2006 | 14.6 | 28 | 28 | 1.1* | 20 |
| 2007 | 14.7 | 28 | 28 | 1.1* | 15 |
| 2008 | 13.7 | 28 | 28 | 1.1* | 0 |
| 2009 | 12.7 | 28 | 28 | 1.1 | 0 |
| 2010 | 12.9 | 28 | 28 | 1.1 | 0 |
| 2011 | 12.8 | 28 | 28 | 1.1 | 0 |
| 2012 | 12.9 | 28 | 28 | 1.1 | 0 |
| 2013 | 12.7 | 28 | 28 | 1.1 | 0 |
| 2014 | 12.2 | 27 | 27 | 1.0 | 0 |
| 2015 | 13.3 | 27 | 27 | 0.85 | 0 |
| 2016 | 11.3 | 25 | 28.75 | 0.85 | 0 |
| 2017 | 10.9 | 24 | 29.76 | 0.85 | 10 |
| 2018 | 10.5 | 23 | 30.59 | 0.85 | 20 |
| Average | 13.1 | 27.1 | 24.5 | 1.0 | 6.7 |
Investor (NOK)
| Dividends from Ltd. Holding | 8.3 |
| Dividend tax (NOK 8.3 · 24.5%) | –2.0 |
| Wealth tax | –6.3 |
| Net | 0 |
Ltd_ Subsidiary (NOK)
| Taxable profit | 100.0 | |
| Corporate tax (rate 13.1%) | 100 · 13.1% | –13.1 |
| Surplus after tax | 86.9 | |
| Dividend payout to Holding | –86.9 | |
| Retained earnings | 0 |