

TABLE 1
Party representatives in the study
| Party | 2010 | 2014 | 2018 | 2022 |
|---|---|---|---|---|
| Centre | Lena Forsman (Campaign Manager) | Michael Arthursson (Party Secretary) | Michael Arthursson (Party Secretary) | Michael Arthursson (Party Secretary) |
| Christian Democrats | Lennart Sjögren (Party Secretary) | Acko Ankarberg Johansson (Party Secretary) | Acko Ankarberg Johansson (Party Secretary) | Peter Kullgren (Party Secretary) |
| Liberal | Erik Ullenhag (Party Secretary) | Anders Andrén (Communications Manager) | Maria Arnholm (Party Secretary) | Gustav Georgson (Deputy Party Secretary) |
| Green | Agneta Börjesson (Party Secretary) | Anders Wallner (Party Secretary) | Amanda Lind (Party Secretary) | Katrin Wissing (Party Secretary) |
| Moderate | Pär Henriksson (Communications Manager) | Per Nilssona (Communications Manager) | Per Rosencrantz (Communications Manager) | Martin Borgs (Deputy Party Secretary) |
| Social Democrats | Ibrahim Baylan (Party Secretary) | Nina Wadensjö (Communications Manager) | John Zanchi (Campaign Manager) | Axel Björneke (Campaign Manager) |
| Sweden Democratsb | – | Björn Söder (Party Secretary) | Richard Jomshof (Party Secretary) | Richard Jomshof (Party Secretary) |
| Left | Anki Ahlsten (Party Secretary) | Aron Etzler (Party Secretary) | Aron Etzler (Party Secretary) | Hanna Gedin (Deputy Party Secretary) |
TABLE 2
The importance of communication channels, 2010–2022
| Type of channel | Channel | 2010 | 2014 | 2018 | 2022 | Mean | Δ 2010–2022a |
|---|---|---|---|---|---|---|---|
| Digital media | 0.28b | 0.26 | 1.31 | 0.91 | 0.69 | 0.63 | |
| Websites | 0.32 | 0.76 | 0.02 | 0.28 | 0.34 | −0.04 | |
| YouTube | −0.06 | 0.26 | 0.02 | 0.53 | 0.19 | 0.59 | |
| n.a.c | −0.74 | 0.45 | 0.78 | 0.16 | 1.52 | ||
| Blogs | 0.44 | −0.99 | −0.12 | −0.84 | −0.38 | −1.28 | |
| 0.28b | 0.26 | −0.98 | −1.09 | −0.38 | −1.37 | ||
| SMS/MMS | −0.68 | – | −0.69 | −0.47 | −0.61 | 0.21 | |
| −1.18 | – | −1.41 | −0.97 | −1.19 | 0.21 | ||
| Other | TV political shows | 0.82 | 1.01 | 1.02 | 0.91 | 0.94 | 0.09 |
| TV news | 0.82 | 1.01 | 0.88 | 1.03 | 0.93 | 0.21 | |
| Radio news | 0.82 | 0.51 | 0.31 | 0.91 | 0.64 | 0.09 | |
| Newspapers | 0.69 | 0.88 | 0.17 | 0.16 | 0.47 | −0.53 | |
| Local newspapers | 0.57 | 0.51 | 0.42 | 0.03 | 0.38 | −0.54 | |
| Tabloids | 0.19 | 0.76 | 0.31 | −0.34 | 0.23 | −0.53 | |
| Election posters | −0.56 | 0.26 | −0.26 | 0.28 | −0.07 | 0.84 | |
| Direct marketing | −0.63 | 0.13 | 0.45 | −0.34 | −0.10 | 0.29 | |
| Election cabins | −0.31 | −0.24 | −0.26 | −0.59 | −0.35 | −0.28 | |
| Door-to-door canvassing | −0.43 | −1.24 | −0.41 | 0.16 | −0.48 | 0.59 | |
| TV entertainment | −0.68 | −1.74 | −0.69 | −0.59 | −0.93 | 0.09 | |
| Magazines | −0.68 | −1.62 | −0.69 | −0.72 | −0.93 | −0.04 |
Comments: Communication channels are ordered in decreasing order after their mean value.
a The last column denotes the change in importance from 2010 to 2022. In the cases where there is no data for 2010, we instead compare with the first instance of data in our dataset.
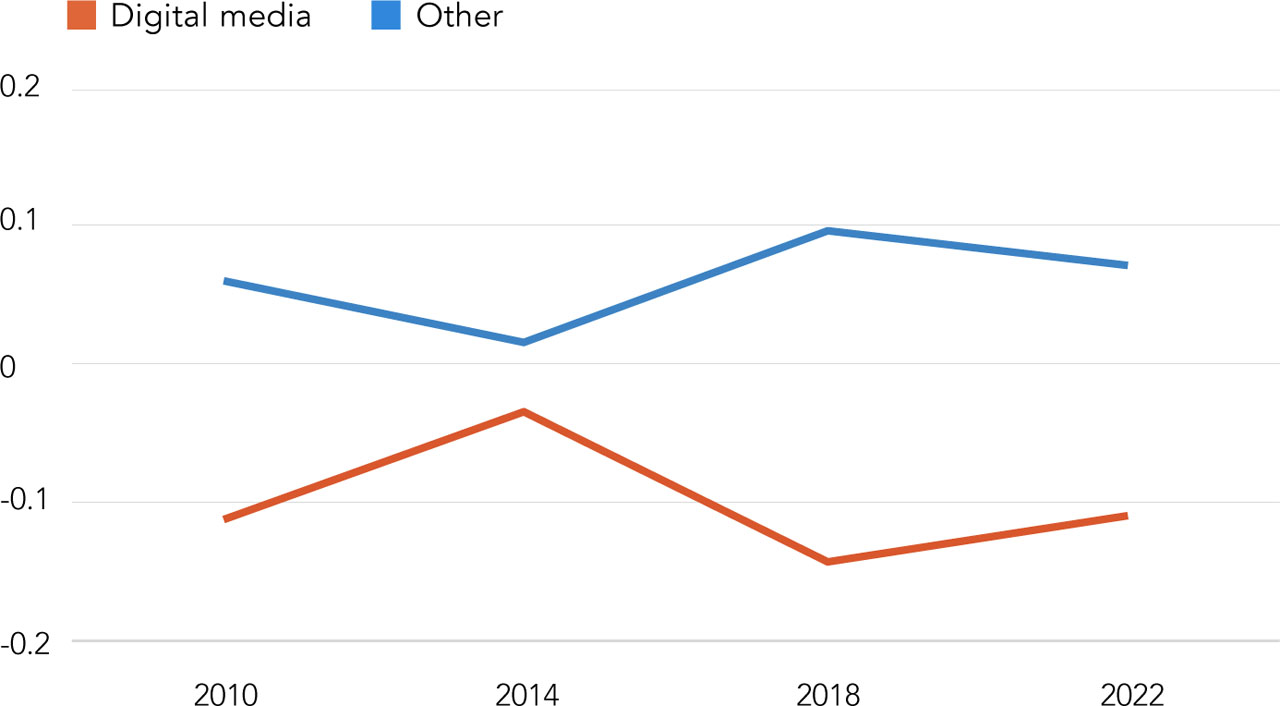
FIGURE 1
The importance of digital communication channels in comparison with other communication channels, 2010–2022
Comments: The graph shows a comparison of the mean scores of the digital communication channels with the mean scores of the other communication channels in the survey. Positive values should be interpreted as above average importance. For a complete list of the channels included in digital media and other respectively, see Table 2.