

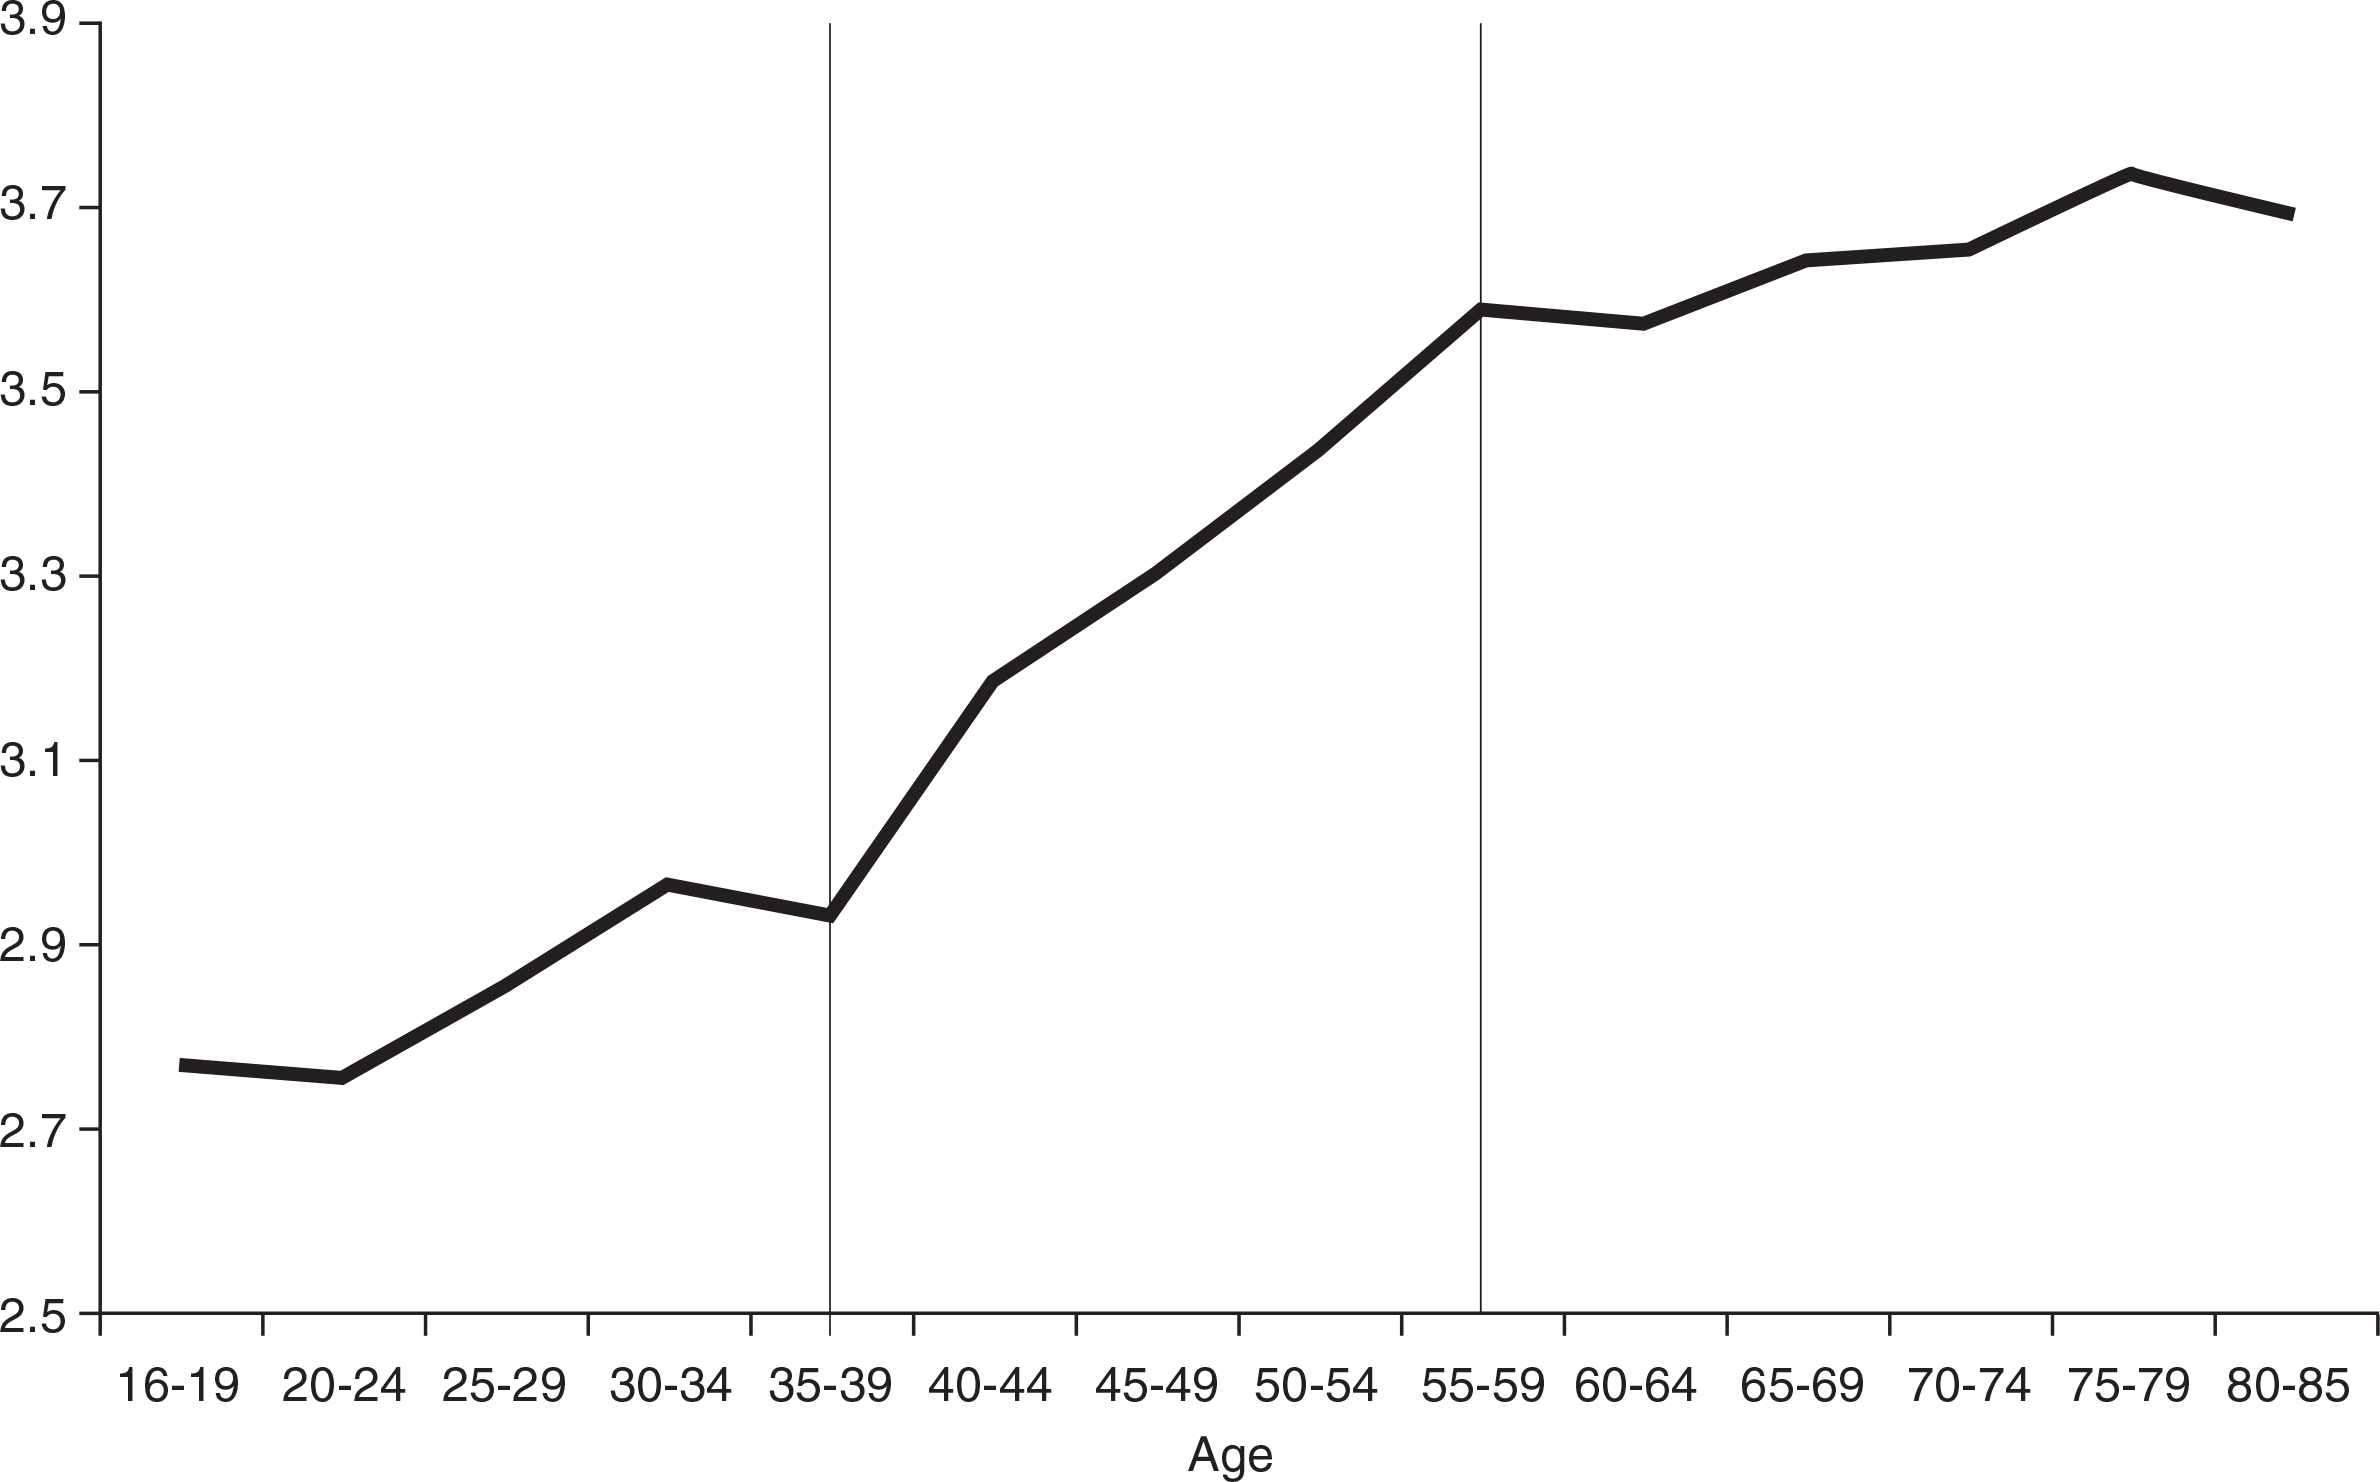
Figure 1
Digital media morality by age groups (mean score)
Comments: The dependent variable is a composite index of seven questions regarding different aspects of media morality and digital media use. The items were posed as proposals, where the respondents were requested to agree or disagree with four alternatives (1=agree totally, 2=partly, 3=hardly, 4=not at all). Thus, higher scores indicate more disapproving attitudes than lower scores. Age was measured by using the year of birth that the respondent provided, and missing data were completed by information from the register data in the sample frame. The independent variable was merged into groups of five-year intervals.
Source: The National SOM-Survey 2014.
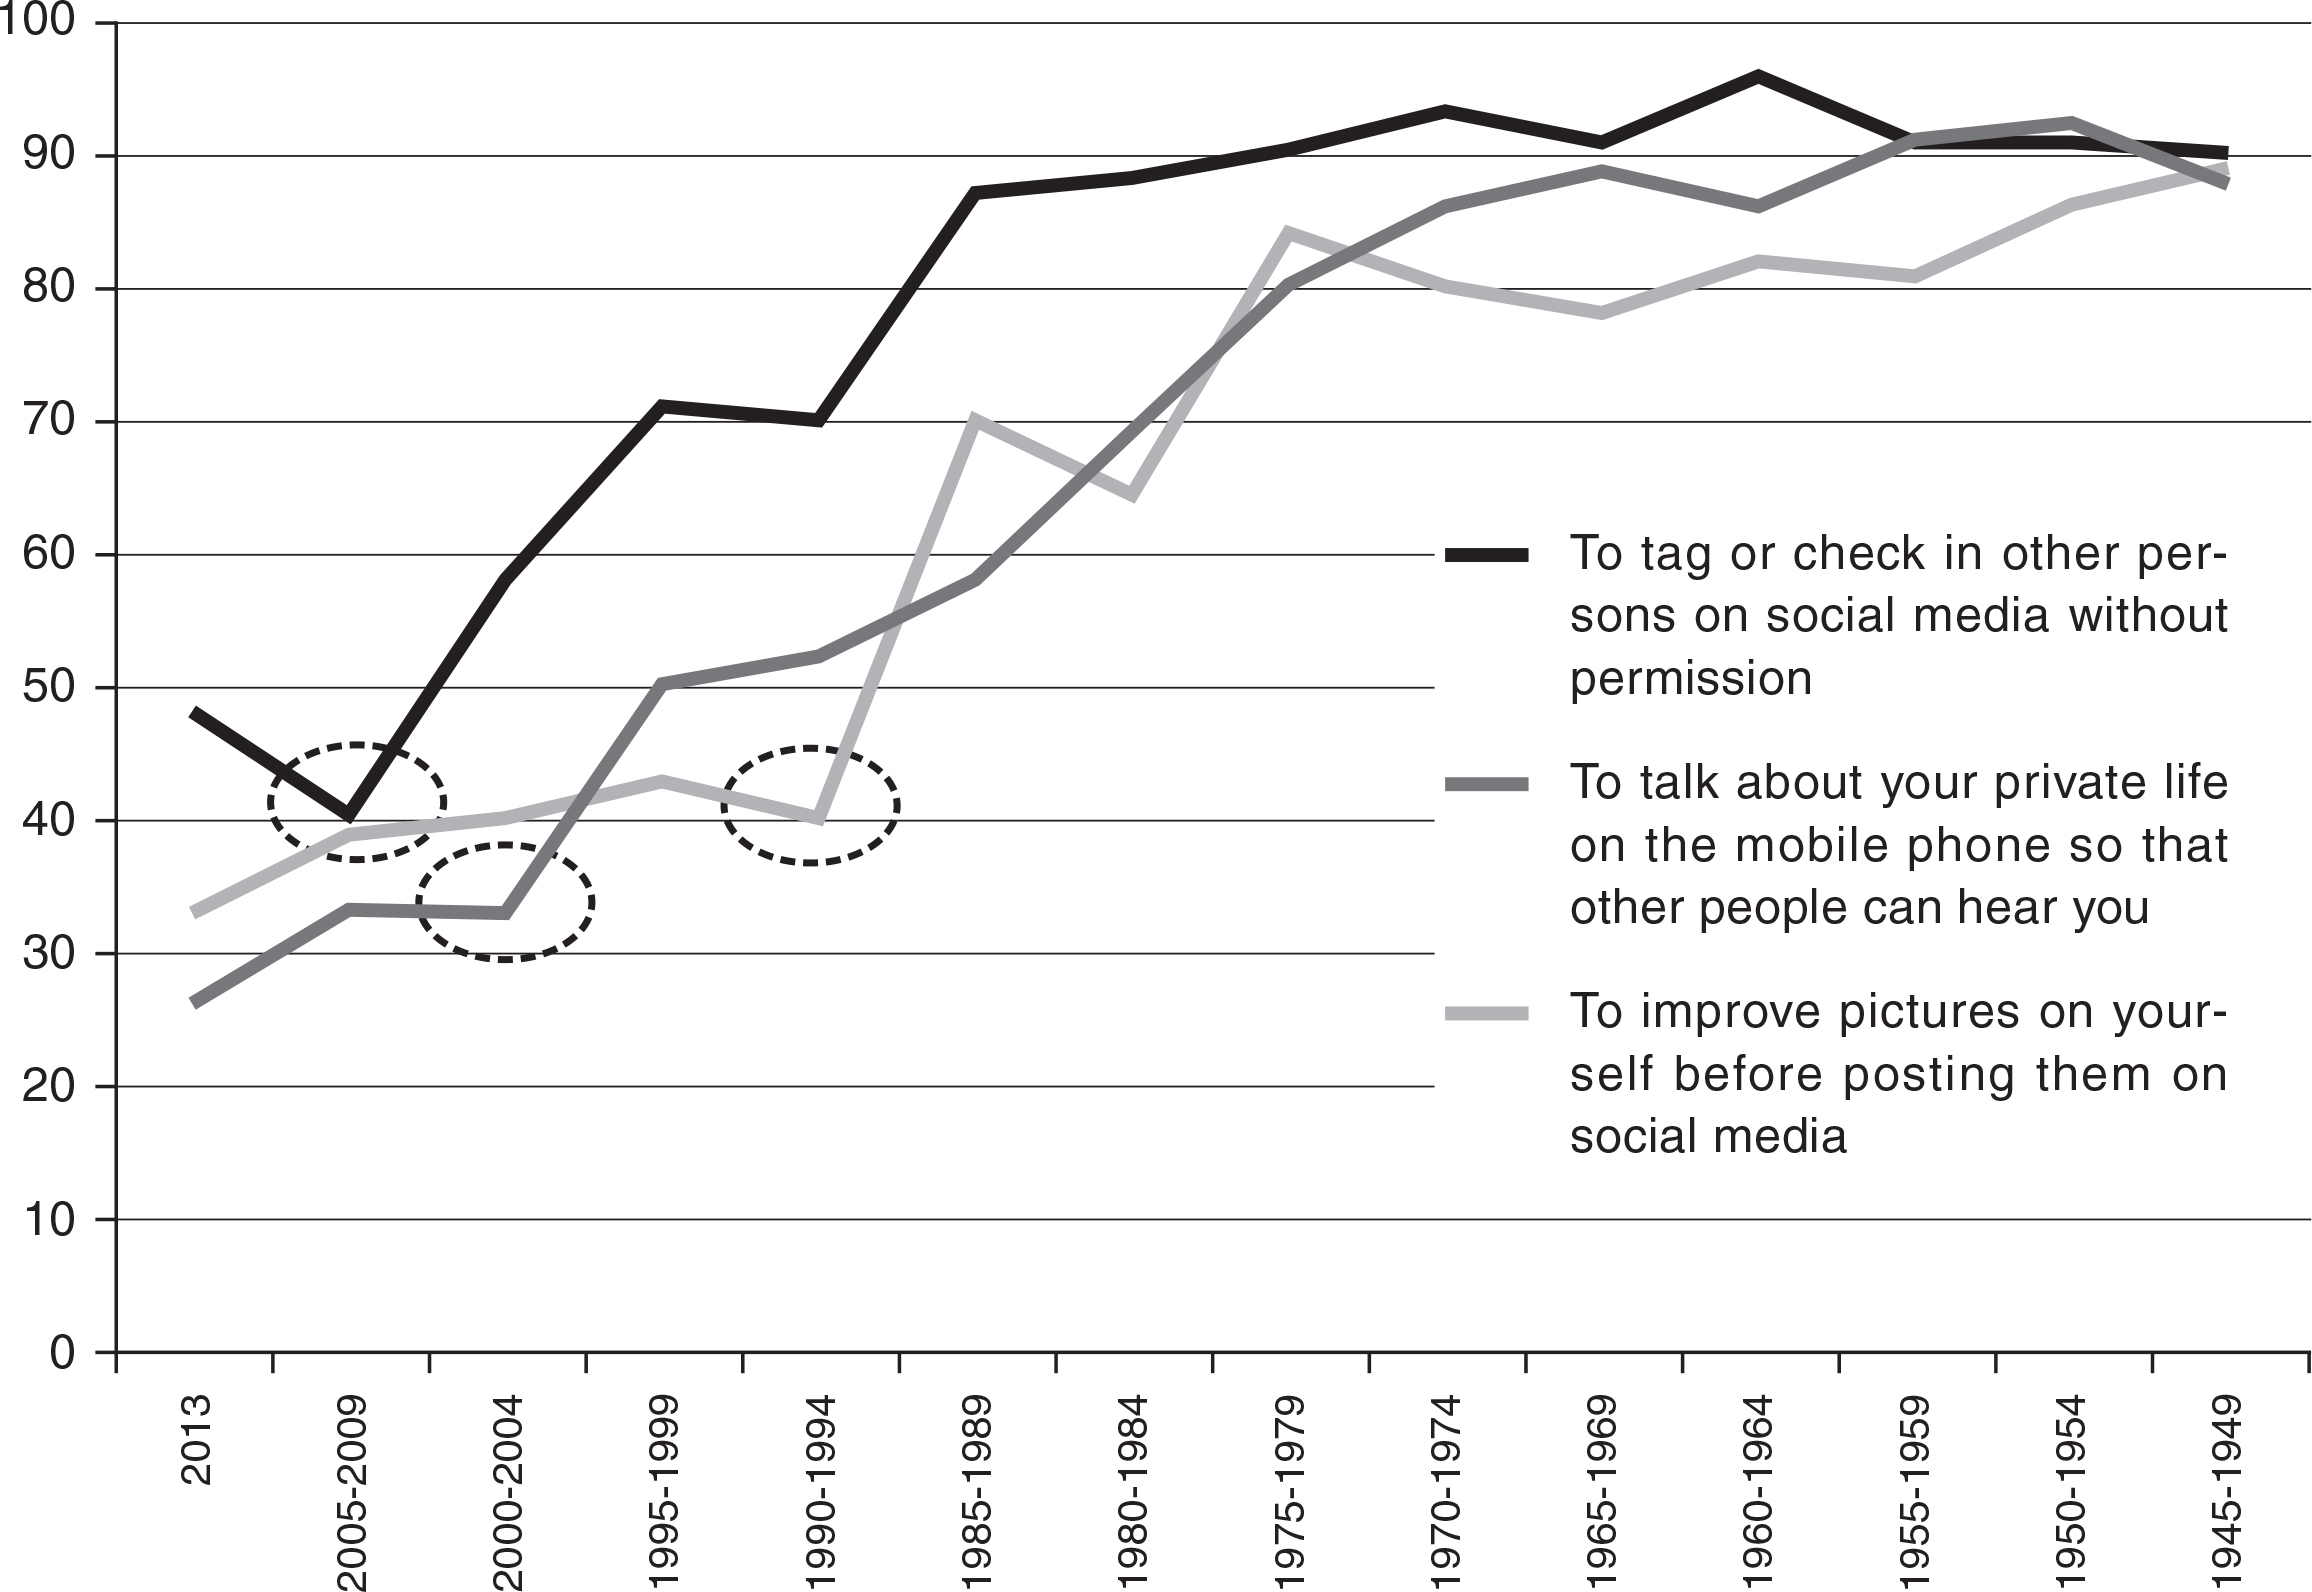
Figure 2
Media morality related to age cohorts. Share of respondents who disagree (per cent)
Comments: The independent variable is the year when members of the age cohort entered their formative years (i.e. reached the age of 15). The wording of the questions for the dependent variables was: “To what extent would you consider the following behaviour to be acceptable:” “To tag or check in other persons on social media without permission”; “to talk about your private life on the mobile phone so that other people can hear you” and “to improve pictures of yourself before posting them on social media”. The items were posed as proposals, where the respondents were requested to agree or disagree with four alternatives (agree totally=1, partly=2, hardly=3, not at all=4). In the analysis, the four alternatives were merged into two categories (agree/disagree).
Source: The National SOM-Survey 2014.
Table 1
Social media use on the mobile phone (per cent)
| Entering formative years | <4 times each day | >4 times each day | Sum | N |
|---|---|---|---|---|
| 2010–2013 | 74 | 26 | 100 | 57 |
| 2005–2009 | 68 | 32 | 100 | 89 |
| 2000–2004 | 46 | 54 | 100 | 94 |
| 1995–1999 | 53 | 47 | 100 | 113 |
| 1990–1994 | 46 | 54 | 100 | 111 |
| 1985–1989 | 29 | 71 | 100 | 122 |
| 1980–1984 | 31 | 69 | 100 | 143 |
| 1975–1979 | 15 | 85 | 100 | 143 |
| 1970–1974 | 7 | 93 | 100 | 140 |
| 1965–1969 | 7 | 93 | 100 | 166 |
| 1960–1964 | 6 | 94 | 100 | 220 |
| 1955–1959 | 2 | 98 | 100 | 146 |
| 1950–1954 | 0 | 100 | 100 | 97 |
| 1945–1949 | 0 | 100 | 100 | 64 |
[i] Source: The National SOM-Survey 2014.