
FIGURE 1
FIGURE 2
FIGURE 3
FIGURE 4
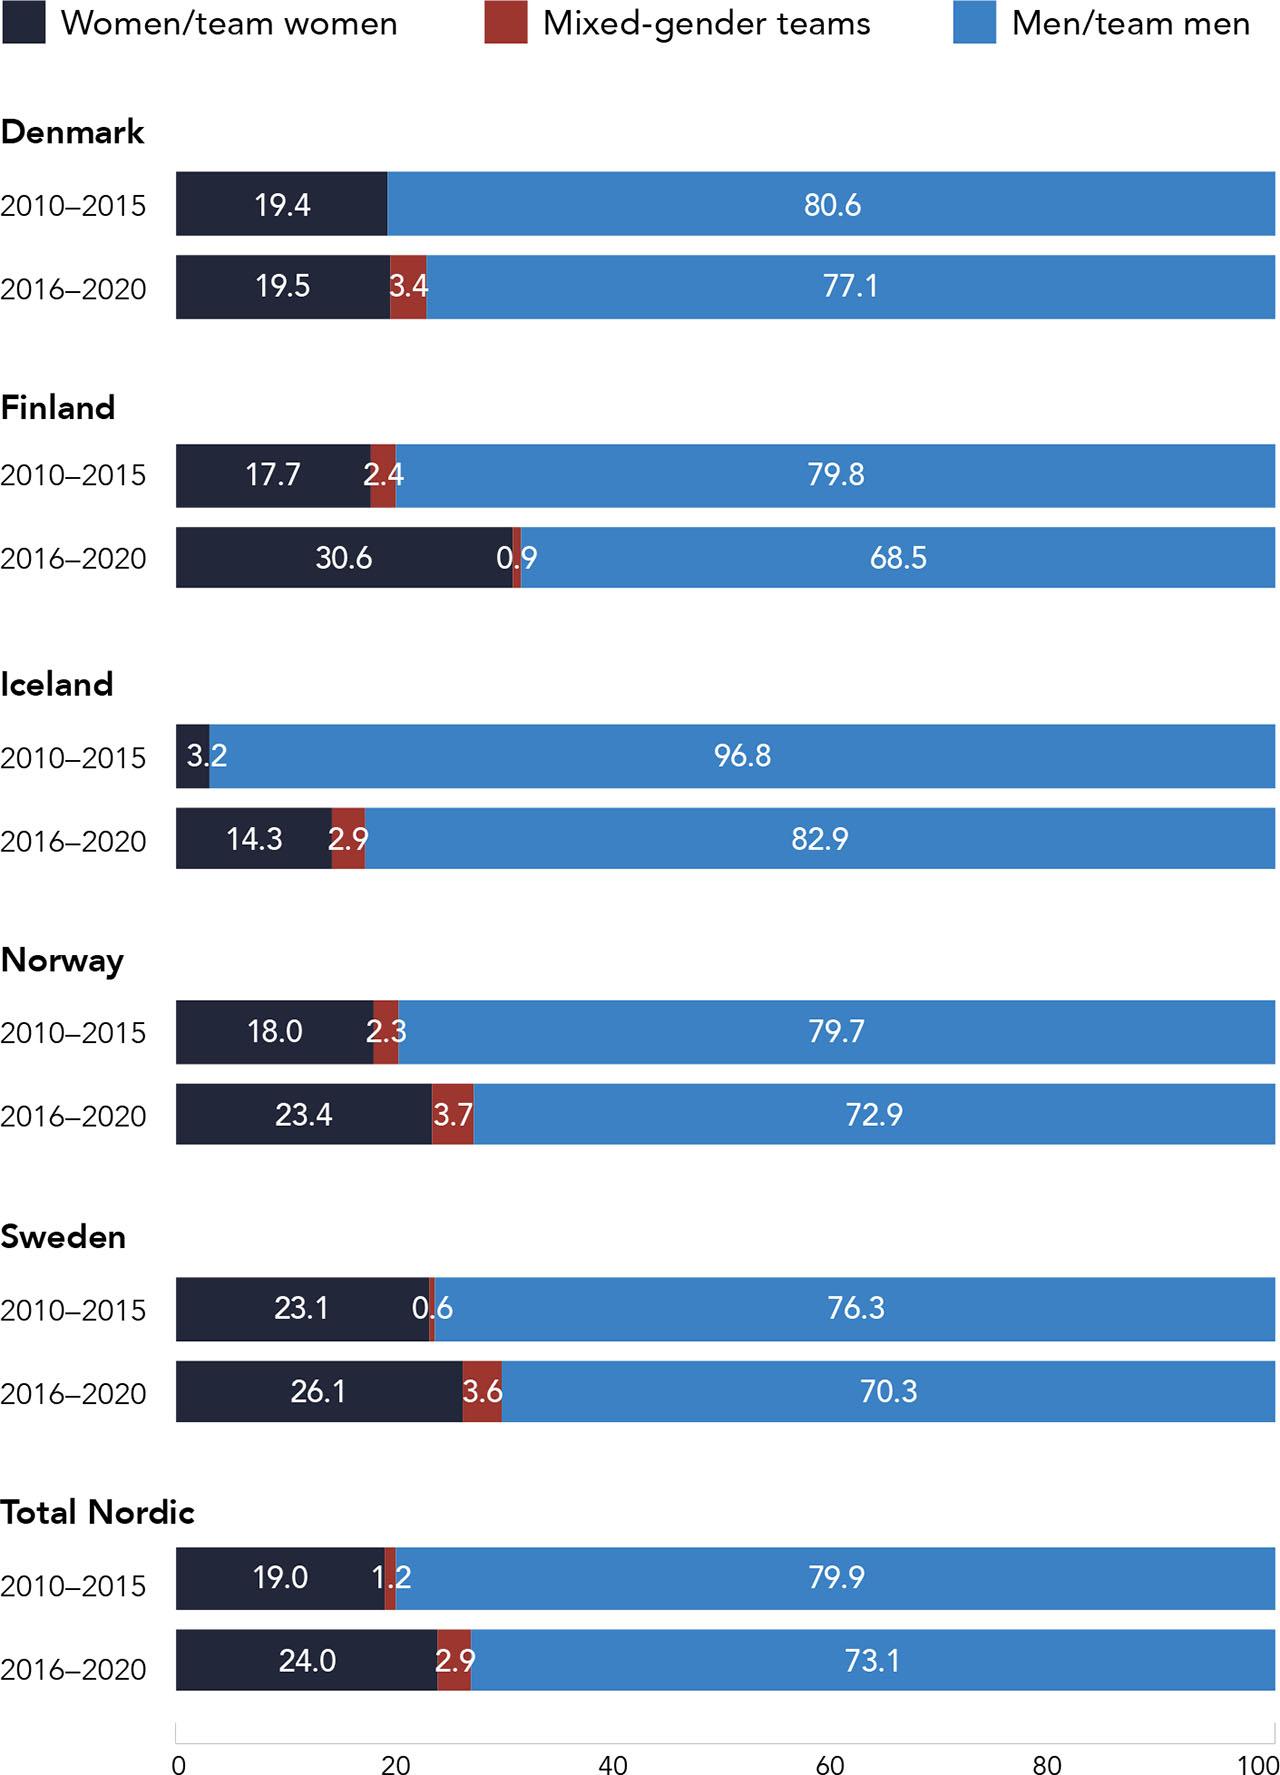
FIGURE 5
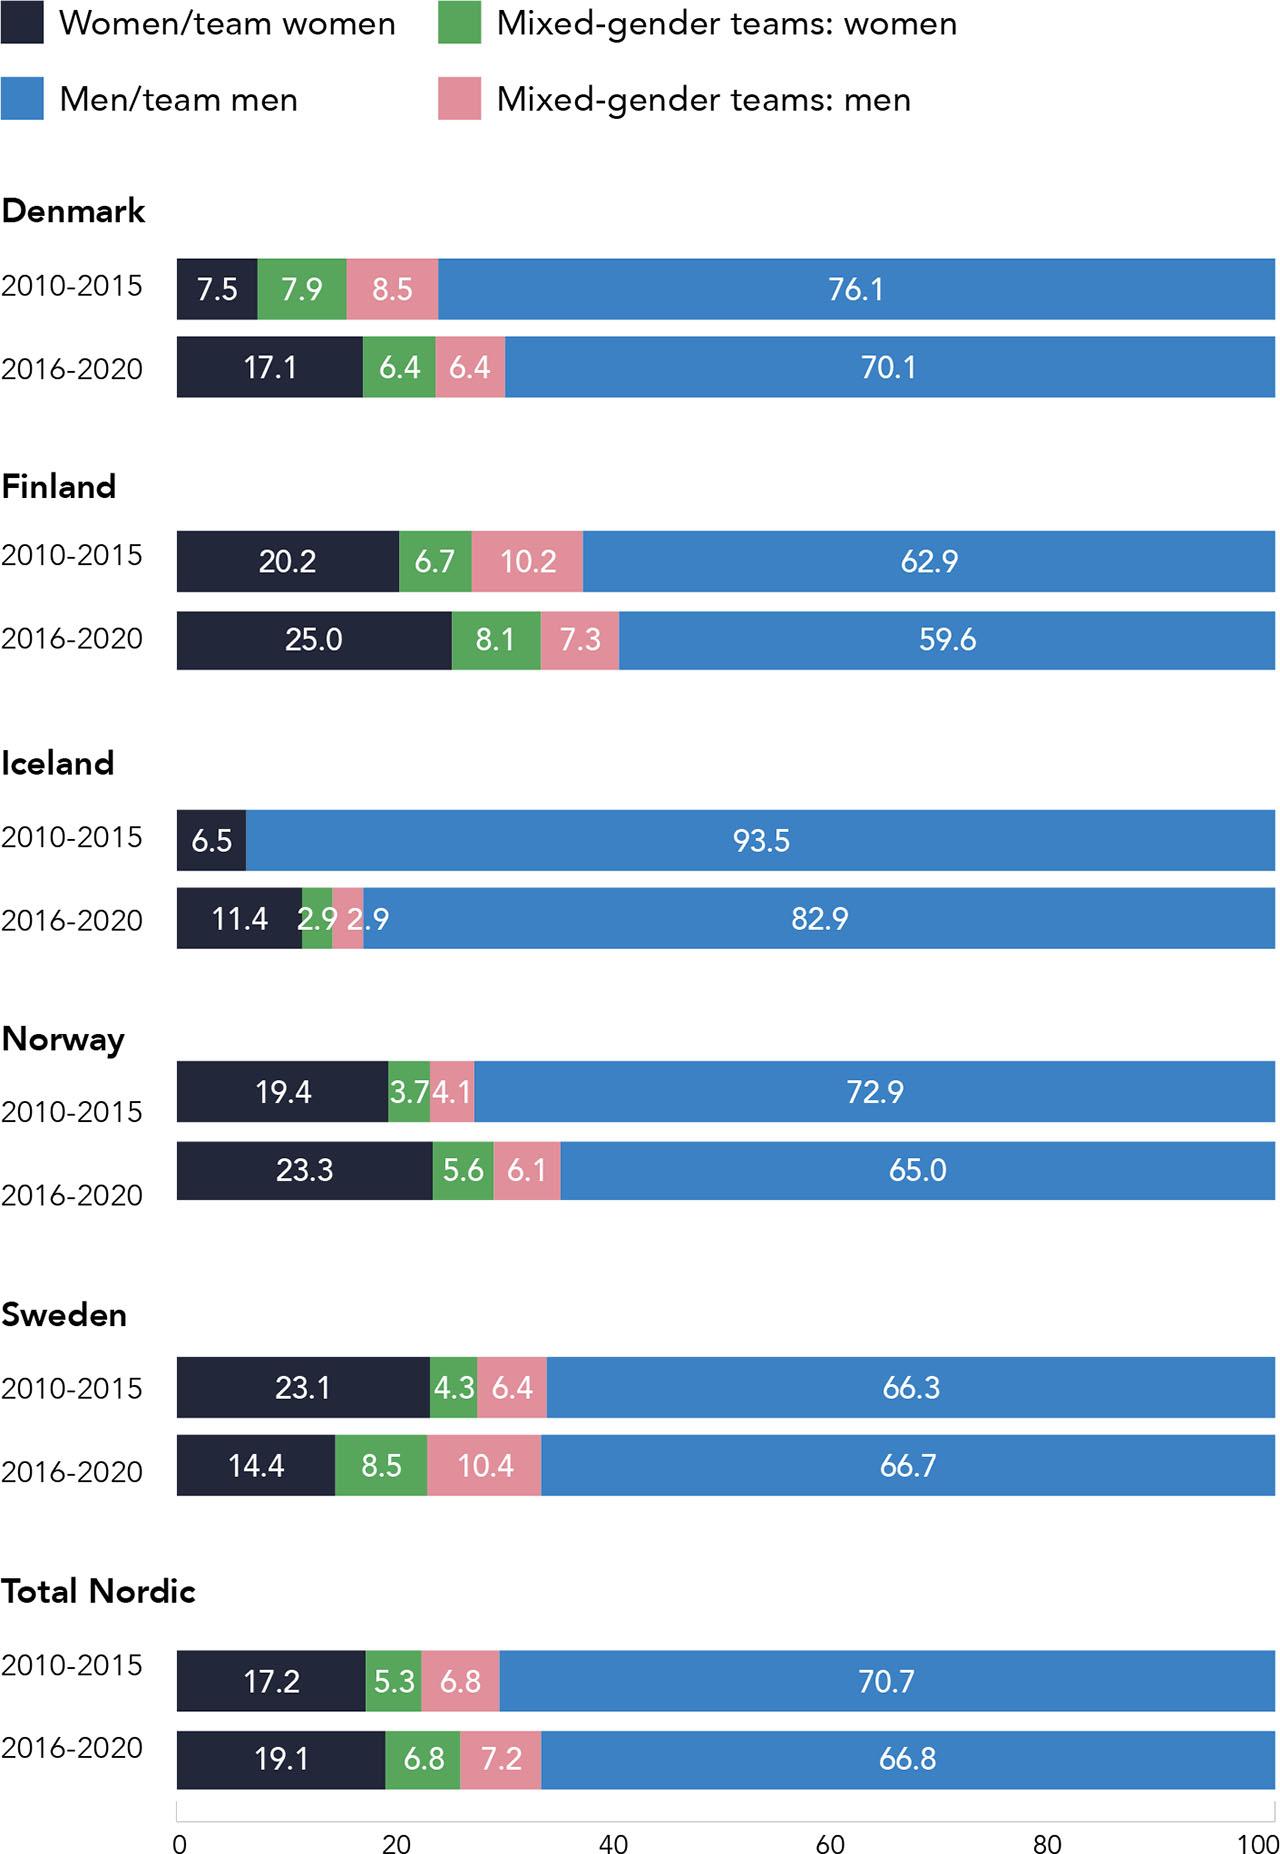
FIGURE 6
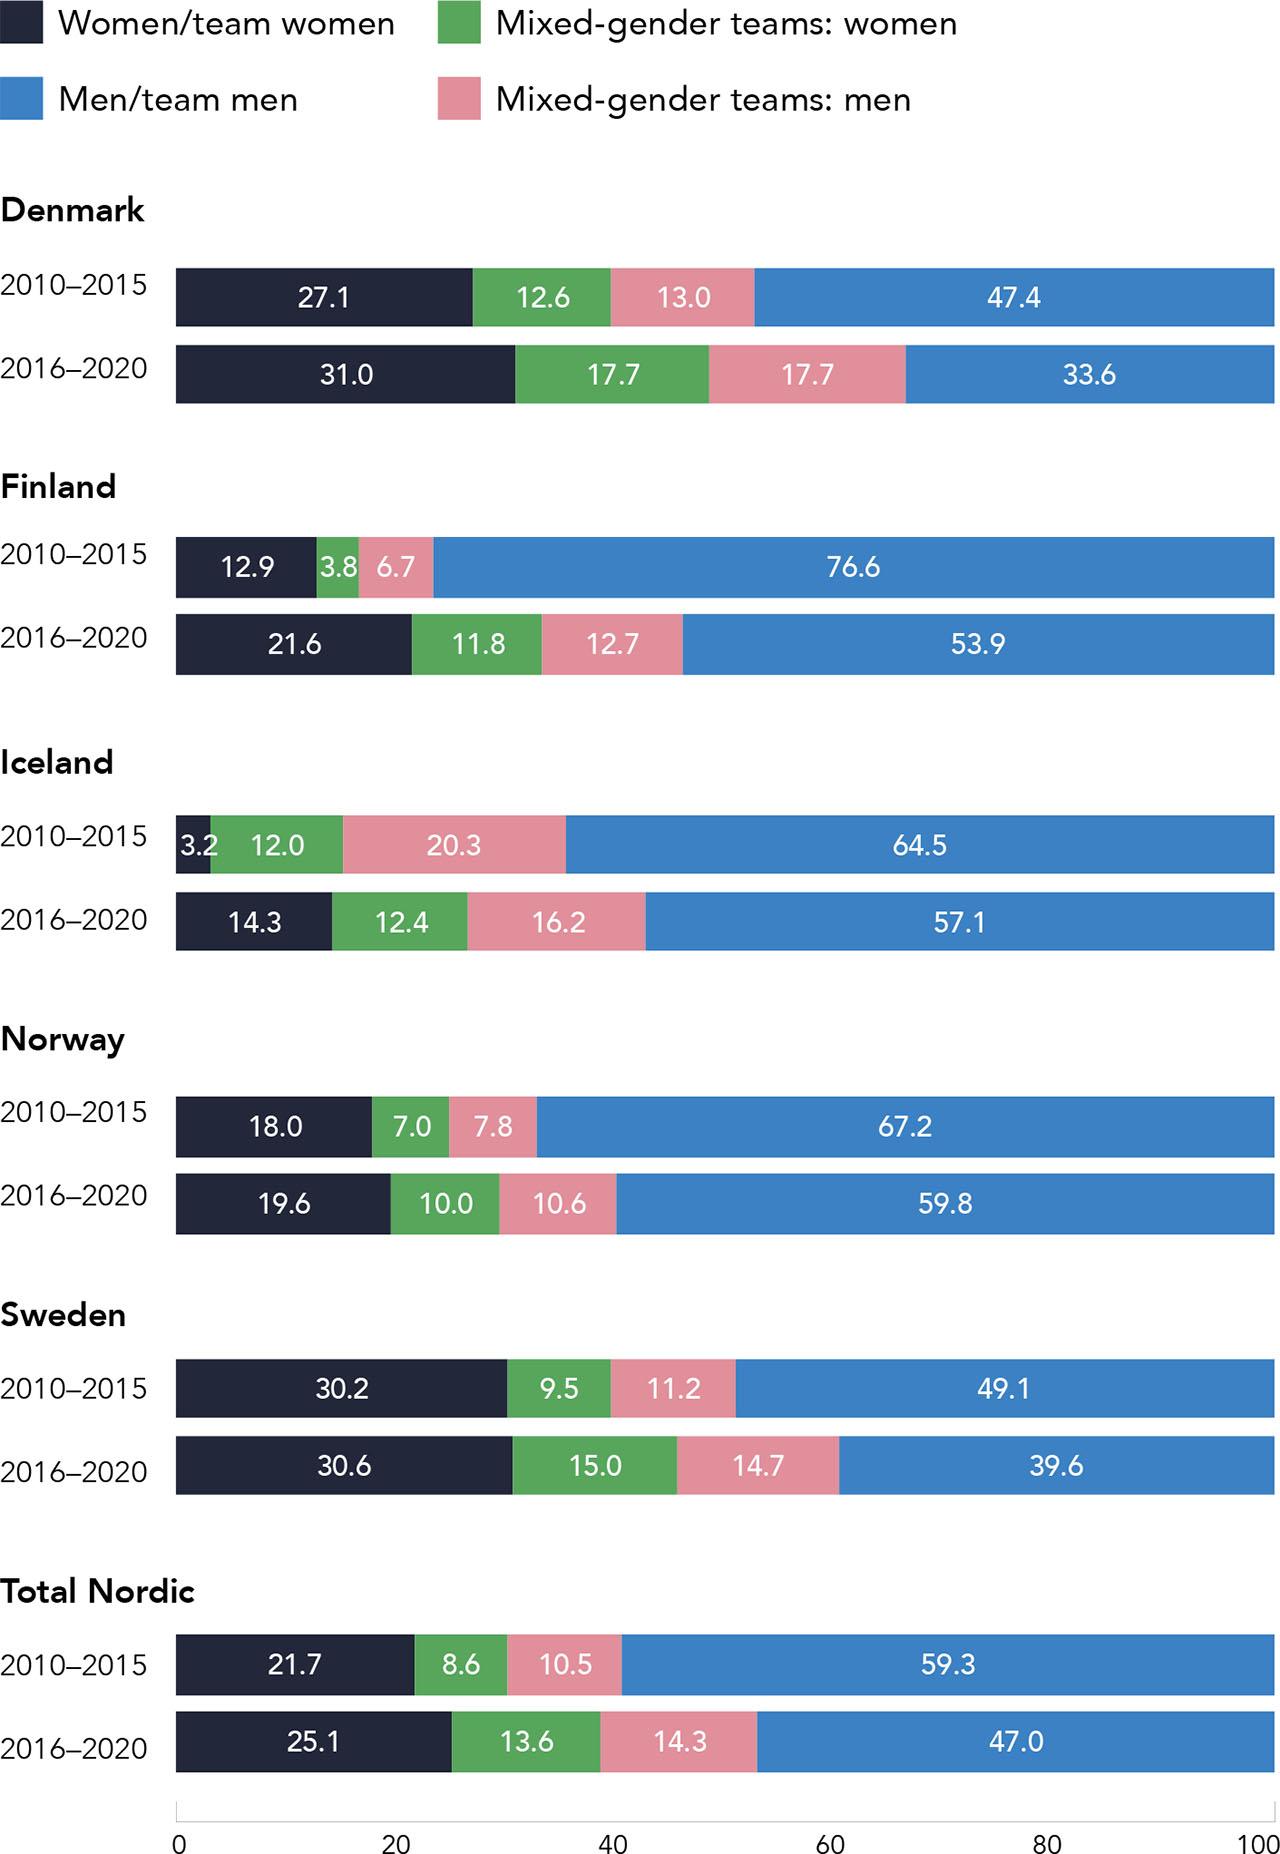
FIGURE A1
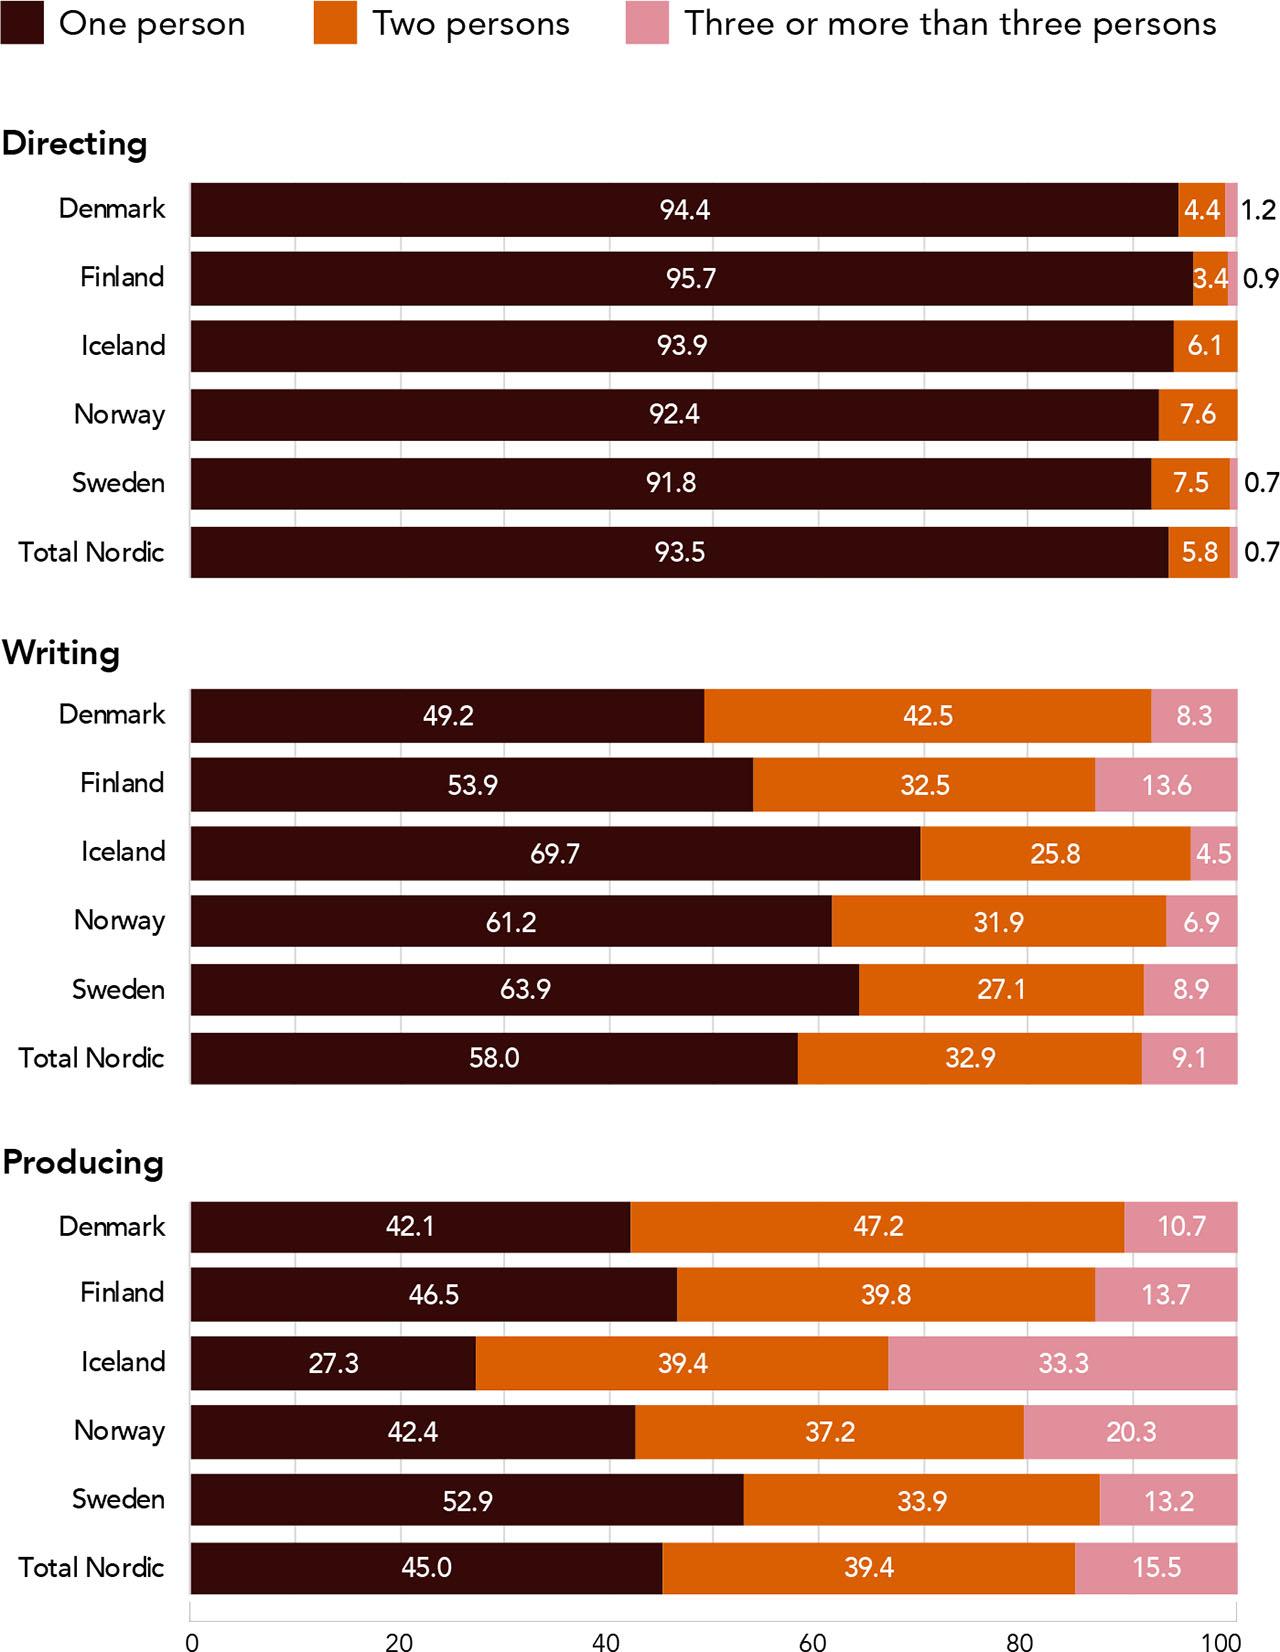
FIGURE A2
FIGURE A3
Variables to trace numerical representation of women and men in key creative positions
| Directing | Writing | Producing | |
|---|---|---|---|
| Film A | M | W W | M M W |
| Gender of positions | Man | Team women | Mixed-gender team |
| Share of men in each key creative position (%) | 100 | 0 | 66.7 |
| At least 50% of each key creative position is held by women | 0 | 1 | 0 |
Regression models per dependent variable and country
| Country | Dependent variable | Independent variables | |
|---|---|---|---|
| Model 1 | Denmark | At least 50% of directing positions held by women |
|
| Finland | |||
| Iceland | |||
| Norway | |||
| Sweden | |||
| Model 2 | Denmark | At least 50% of writing positions held by women |
|
| Finland | |||
| Iceland | |||
| Norway | |||
| Sweden | |||
| Model 3 | Denmark | At least 50% of producing positions held by women |
|
| Finland | |||
| Iceland | |||
| Norway | |||
| Sweden |
Logistic regression analyses
| Dependent variable | Country | Macro-level factors | Film-level factors | |||
|---|---|---|---|---|---|---|
| proportion of women in senior and middle management positions | proportion of seats held by women in national parliaments | Co-production (binary) | Size team (metric) | Share of producing positions held by men | ||
| At least 50% of directing positions held by women | Denmark | .994 | 1.051 | .869 | .948 | .991* |
| Finland | 1.003 | 1.009 | .847 | .643 | .986*** | |
| Iceland | .940 | .639 | 1.536 | 1.471 | .961** | |
| Norway | .883 | .901 | 1.020 | .892 | .983*** | |
| Sweden | 1.376* | .839 | 1.180 | .923 | .995 | |
| At least 50% of writing positions held by women | Denmark | 1.000 | .897 | .764 | .995 | .992* |
| Finland | 1.206* | 1.009 | 1.184 | 1.194 | .985*** | |
| Iceland | .939 | .788 | .992 | 1.356 | .970** | |
| Norway | .982 | .728 | .642 | .882 | .986*** | |
| Sweden | 1.138 | 1.007 | 1.805 | 1.070 | .989*** | |
| At least 50% of producing positions held by women | Denmark | 1.010 | 1.155 | 1.943* | .819 | – |
| Finland | 1.163 | .916 | .724 | .575 | – | |
| Iceland | 1.068 | .935 | 1.395 | .936 | – | |
| Norway | .957 | 1.330 | .822 | 1.047 | – | |
| Sweden | 1.030 | .986 | 1.623 | .829* | – | |
Frequency of gendered structure of key creative teams (per cent)
| Directing | Writing | Producing | |
| No women | 76.6 | 68.4 | 53.9 |
| One woman and multiple men | 0.3 | 2.9 | 5.1 |
| Gender parity | 1.8 | 9.3 | 15.5 |
| Multiple women and one man | 0.0 | 0.9 | 2.4 |
| Only women | 21.3 | 18.5 | 23.0 |