
Masonry structure is one of the oldest forms of construction in human architectural history. Globally, many aging buildings lack seismic design considerations (Figure 1) [1]. In addition to earthquakes, natural disasters such as floods and strong winds, as well as human damage such as fires and wars, cause significant damage to these ancient buildings. Therefore, identifying effective and practical strengthening methods for these structures has significant research value.
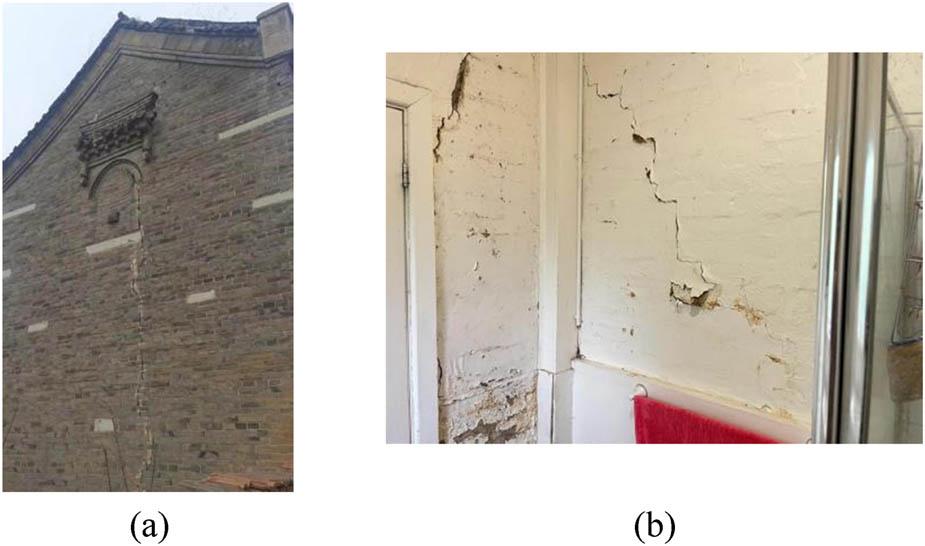
Typical damaged masonry structures. (a) Damage of masonry structure after long-term service. (b) Damage of masonry structure after earthquake.
Engineered cementitious composite (ECC) is an advanced fiber-reinforced cement-based composite material developed using fracture mechanics and micromechanics principles. It is produced by uniformly incorporating short, discontinuous fibers – typically in volumes not exceeding 2% – into a cement mortar matrix. ECC is known for its high tensile strength, substantial tensile deformation capacity, and excellent crack resistance [2]. In contrast, conventional concrete is limited by its relatively low tensile strength, which is considered its most significant drawback [3]. When applied to the strengthening of masonry structures, ECC can effectively control wall cracking and failure modes, enhance ductility and energy dissipation capacity, and reduce the resources needed for reconstruction. Therefore, ensuring effective integration of the ECC overlay with masonry walls is of great significance.
Several different retrofitting techniques for unreinforced masonry (URM) buildings have been proposed by the academic community over the past years; a summary is given in Figure 2 [4]. The first group of strengthening techniques relies on introducing additional tensile reinforcement to control crack initiation and restrict their excessive widening and propagation. A wide range of configurations has been investigated, employing different materials and application methods – from conventional steel meshes to advanced fiber-based textiles embedded within cementitious matrices, typically applied as surface overlays on existing masonry components. These approaches are generally directed at individual structural elements and are intended to enhance their behavior under cyclic loading, thereby significantly improving their crack resistance.
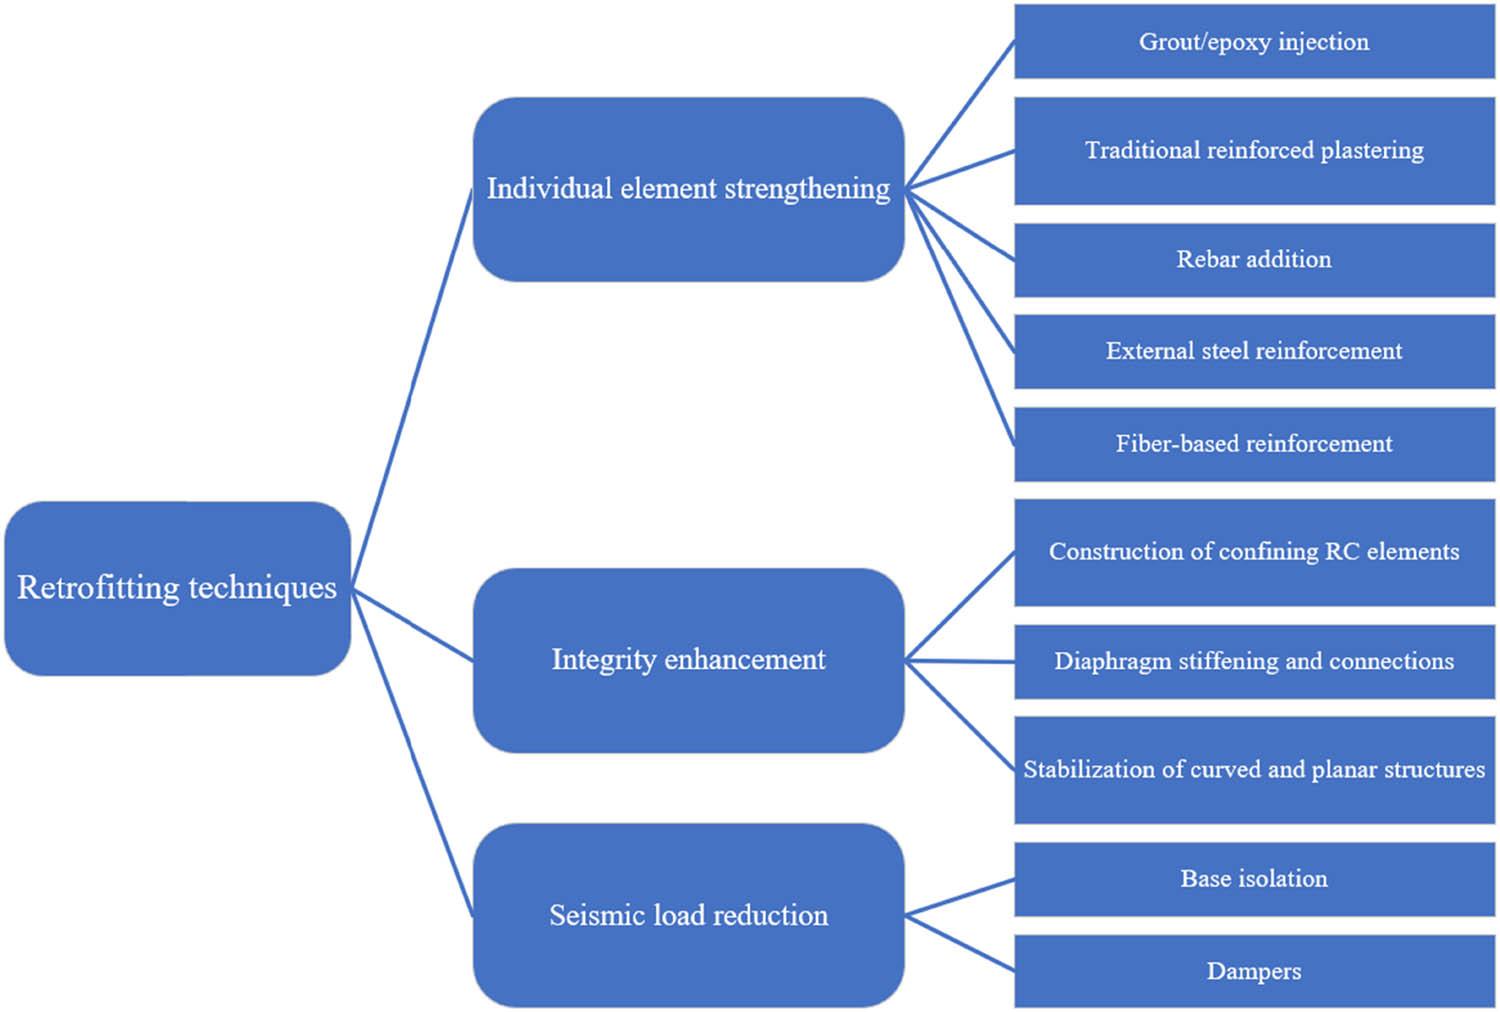
Retrofitting strategies for URM structures.
Recently, many researchers have conducted extensive experiments and studies on the structural performance of ECC overlays for masonry wall strengthening. Che et al. [5] conducted quasi-static loading tests to investigate the strengthening effects of ECC on masonry walls. The results indicate that ECC can significantly constrain the deformation of the inner brick wall and effectively improve its seismic performance. Deng and Yang [6] conducted seismic performance tests on brick walls strengthened with ECC overlays and found that the average energy dissipation capacity of ECC strengthened specimens was three times greater than that of unstrengthened specimens. The ductility was also substantially improved, and compared with traditional mortar overlays strengthen methods, ECC overlays were more convenient for practical application and wider adoption. Chen et al. [7] performed seismic performance tests on masonry structures reinforced with X-shaped ECC overlays. The results indicated that this method effectively enhanced seismic performance and improved structural stability to a certain extent. However, due to high construction precision requirements, its practical application may be limited despite its excellent performance potential. Guan et al. [8] investigated the performance of ECC overlays on existing concrete structures. The results demonstrated that ECC overlays could effectively improve the structural durability, crack control, and load-bearing capacity of strengthened specimens. Hung et al. [9] investigated the potential of various types of ferrocement, reinforced with high-strength steel meshes, to enhance the in-plane shear behavior of brick masonry walls. Results indicated that ECC overlays significantly enhanced post-cracking deformation capacity and ECC shotcrete led to the highest rupture shear strain and pseudo-ductility for the retrofitted wallette, reaching 0.83% and 17.2, respectively. Li et al. [10], building on previous experimental research, developed two distinct interface models for finite element analysis. Their findings demonstrated that increasing the stiffness or thickness of the ECC layer significantly enhances the interfacial bond capacity, highlighting the critical role of ECC layer properties in composite strengthening of concrete structures.
Considering the superior performance of ECC materials and the critical role of bonding performance between the masonry wall and overlay in determining strengthening effectiveness, this study proposes a novel strengthening method: the steel mesh-sprayed ECC overlay technique. Building on previous findings that highlight the bond between the substrate and overlay as a decisive factor, the proposed method embeds a steel mesh within the ECC layer and secures it to the masonry wall using tie bars. This configuration not only improves mechanical anchorage and interfacial bond performance but also ensures effective composite action between the wall and the ECC overlay under complex loading conditions.
Sprayed concrete, also known as shotcrete, is applied using a pressurized spray gun to project the concrete mixture onto the surface of a structure. By incorporating a quick-setting agent, the concrete rapidly sets and hardens, thereby providing effective structural protection. The resulting sprayed ECC exhibits characteristics such as high ductility, low shrinkage, and cost-effectiveness [11]. In this study, a comparative experiment was conducted using two masonry wall specimens subjected to low reversed cyclic loading tests to investigate the effects of this strengthening method on the energy dissipation capacity, ductility, and failure modes of masonry walls.
In this experiment, a 30 mm thick layer of ECC was adopted for masonry wall strengthening. Although conventional retrofitting practice typically employs ECC overlays of 10–20 mm, recent experimental and numerical investigations have demonstrated that increased thickness can markedly improve structural performance. Parametric studies revealed that ECC overlays of 30 mm provide significantly higher shear strength and lateral load capacity compared with 10–20 mm layers, owing to the improved crack distribution, enhanced confinement, and greater energy dissipation [12]. Cyclic loading tests further confirmed that thicker ECC layers not only increase peak strength but also enhance ductility and hysteretic behavior, resulting in superior seismic performance [13]. Moreover, a moderate increase in thickness improves construction reliability by reducing the risk of debonding or surface peeling, while also offering better protection for embedded reinforcement against environmental degradation [14]. Therefore, the use of a 30 mm enhanced ECC layer is justified as a balance between material utilization efficiency and the need for improved structural safety, durability, and seismic resilience. In this experiment, three masonry wall specimens were designed and fabricated. Two were strengthened on both sides with 30 mm overlays – one using steel mesh combined with ECC and the other using steel mesh with cement mortar – while the third specimen was left unstrengthened for comparison. The steel mesh consisted of 6 mm diameter bars arranged at 200 mm spacing. The strength grades of the brick and masonry mortar were Mu10 and M5.0, respectively. Detailed design parameters of the specimens are summarized in Table 1.
Design for specimens tested.
| Specimen | Strengthen method | Thickness of overlay (mm) | Steel mesh |
|---|---|---|---|
| S1 | Unstrengthen | — | — |
| S2 | Steel mesh-ECC layer (both double-sides) | 30 + 30 |
|
| S3 | Steel mesh-mortar layer (both double-sides) | 30 + 30 |
|
In this experiment, the height × length × thickness of masonry wall specimens was 1,018 × 1,305 × 240 mm. The cross-sectional dimensions of the top loading beam were 240 mm × 300 mm, and those of the foundation beam were 300 mm × 600 mm. The loading beam was reinforced with 10 mm diameter steel stirrups spaced at 200 mm, along with four 16 mm diameter steel longitudinal rebars. The foundation beam was reinforced with 10 mm diameter steel stirrups at 200 mm spacing, six 16 mm diameter steel longitudinal rebars, and two 12 mm diameter steel constructional rebars. The dimensions of the brick wall and strengthening details of the beams are shown in Figure 3.
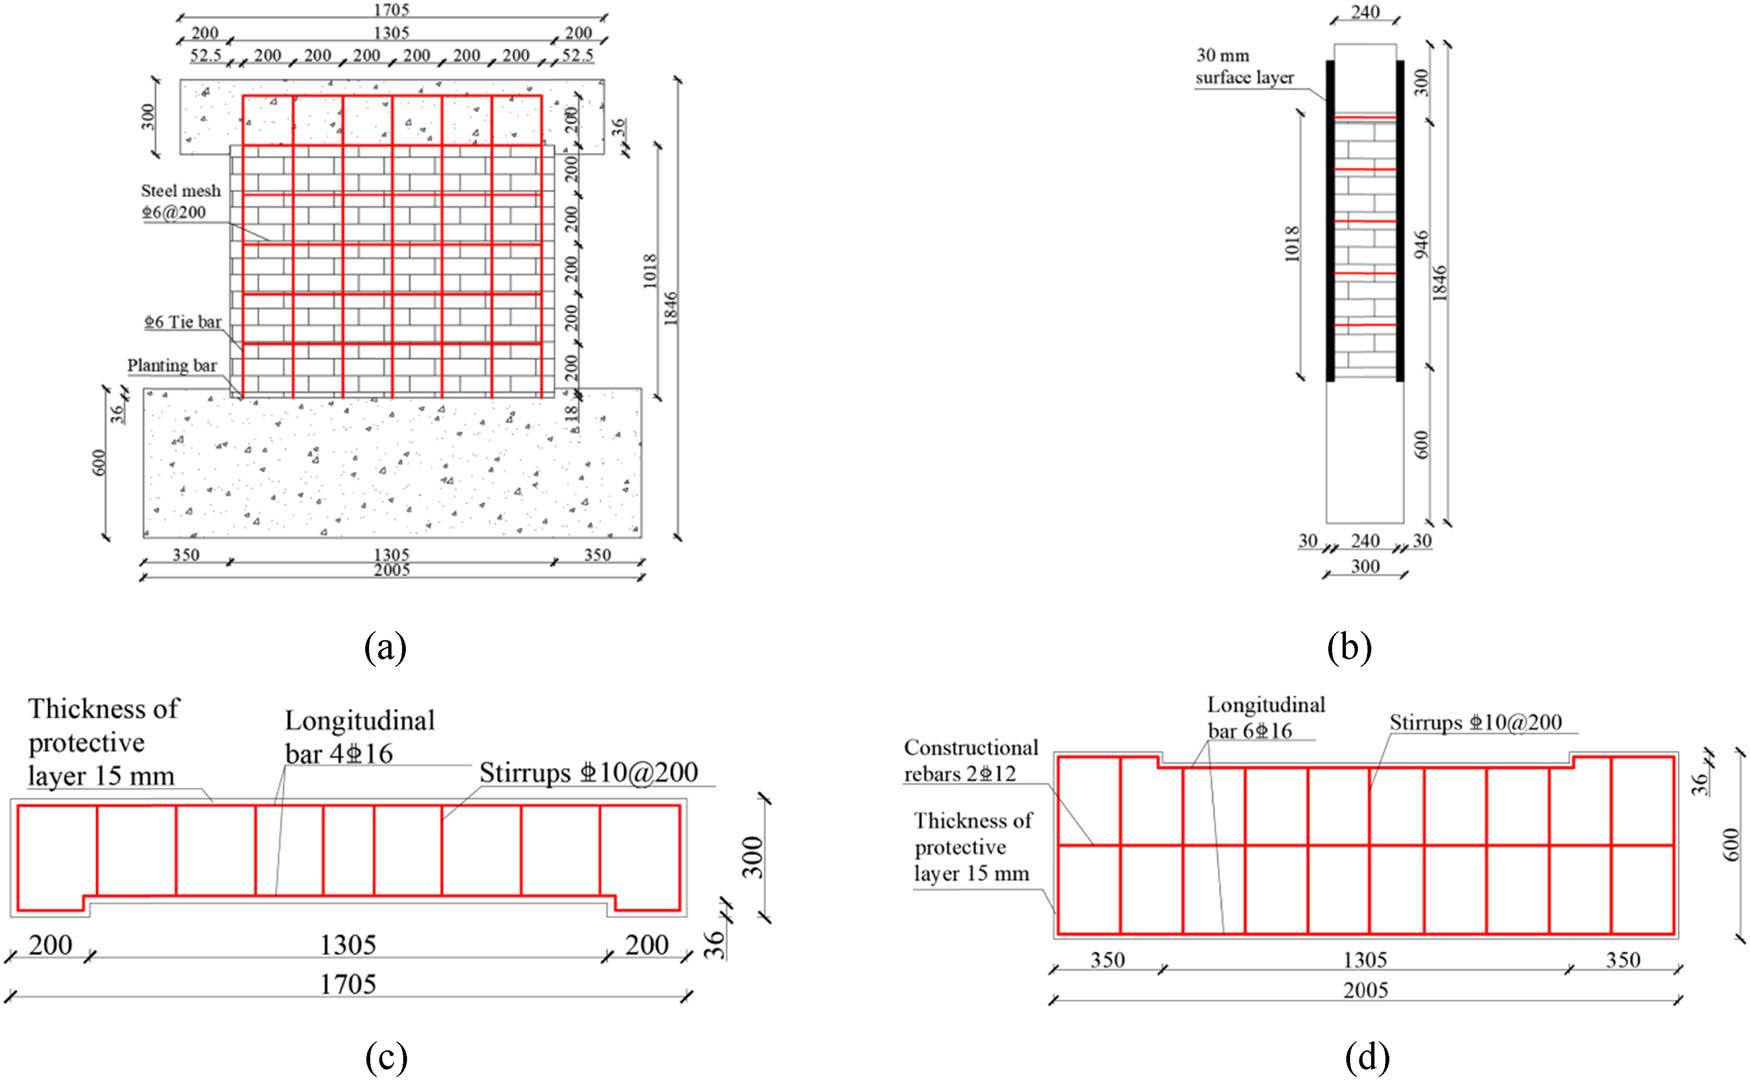
Dimension and configuration of the specimen (unit: mm). (a) Reinforcing mesh arrangement diagram. (b) Side view of reinforced specimen. (c) Top beam reinforcement diagram. (d) Floor beam reinforcement diagram.
The ECC produced includes superfine quartz sand with mesh of 100–200, superfine fly ash, superfine silica fume, normal strength concrete (NSC), water reducer, mixed water, and polyvinyl alcohol (PVA) fibers. In accordance with the code JGJ/T 55-2019 [15], the fine aggregate for NSC consists of manufactured sand with an average particle size of 0.5 mm and ordinary Portland cement of grade P.Ⅱ 42.5, while the coarse aggregate comprises crushed stone with particle sizes ranging from 5 to 20 mm. The PVA fibers have diameter and length of 40.0 μm and 12.0 mm, respectively, whereas their density, tensile strength, modulus of elasticity, and elongation at failure were 1.3 g/cm3, 1,560.0 N/mm2, 41.0 GPa, and 6.5%, respectively. The volume fraction of mixed PVA fibers was 2.0%. Based on the mix proportion of quartz sand, fly ash, silica fume, cement, and water (0.36:3.0:1.0:1.0:0.3 by mass), the corresponding contents were 954, 115, 318, 318, and 95 kg/m³, respectively. Local tap water was used as the mixing water. The polycarboxylate superplasticizer with a solid content of 30% and a water reduction rate of 40% was used. The raw materials used are shown in Figure 4.
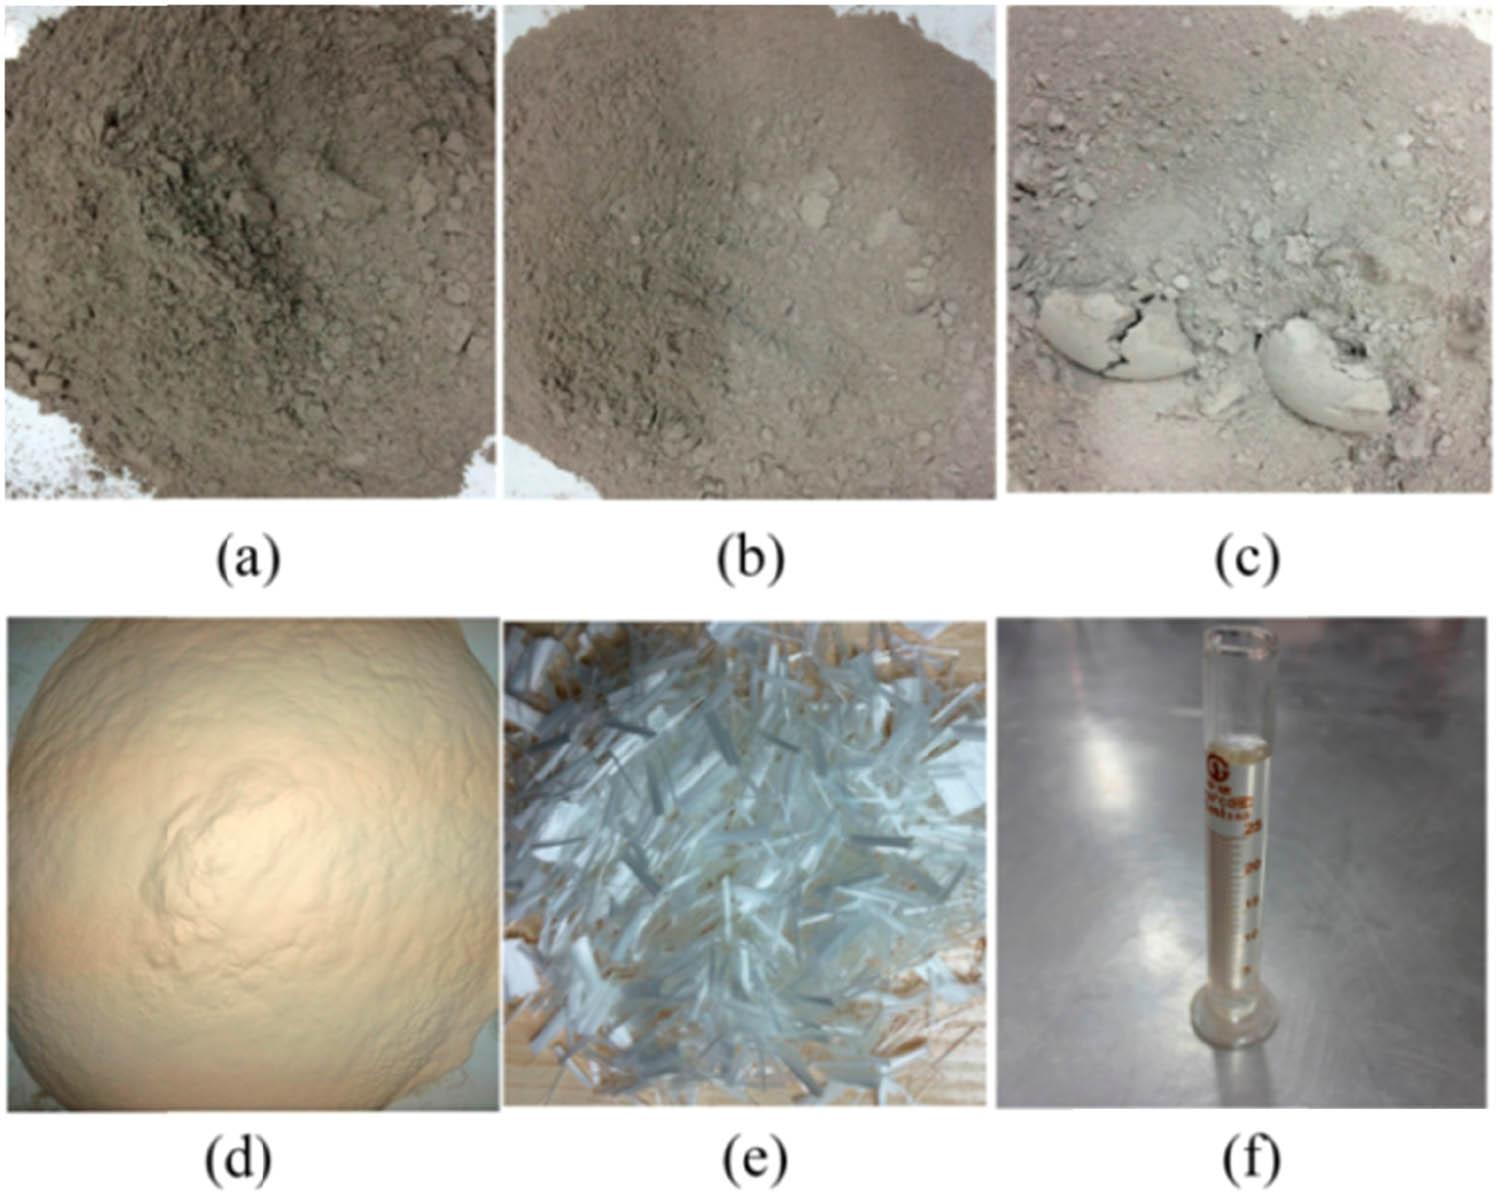
Raw materials used for mixing ECC. (a) Cement. (b) Fly ash. (c) Silica fume. (d) Quartz sand. (e) Fiber. (f) Water reducer.
Figure 5 shows the construction procedure of the masonry wall specimen. The reinforcement cage of the foundation beam was first assembled, followed by the installation of wooden formwork and the casting of C30 concrete. The formwork was removed 7 days after casting, and the specimen was continuously moist-cured until a total curing age of 28 days was reached. Subsequently, the brick masonry wall was constructed on the foundation beam using M5.0 mortar. During the masonry process, tie bars were embedded within the mortar joints in a staggered (plum-blossom) configuration to enhance the integrity and bonding performance of the wall. After the masonry wall had been completed and adequately cured, the reinforcement of the loading beam was installed, wooden formwork was erected, and concrete was poured. The formwork was removed after 7 days, and the specimen was further cured until the overall curing period reached 28 days prior to strengthening (Tables 2–4).
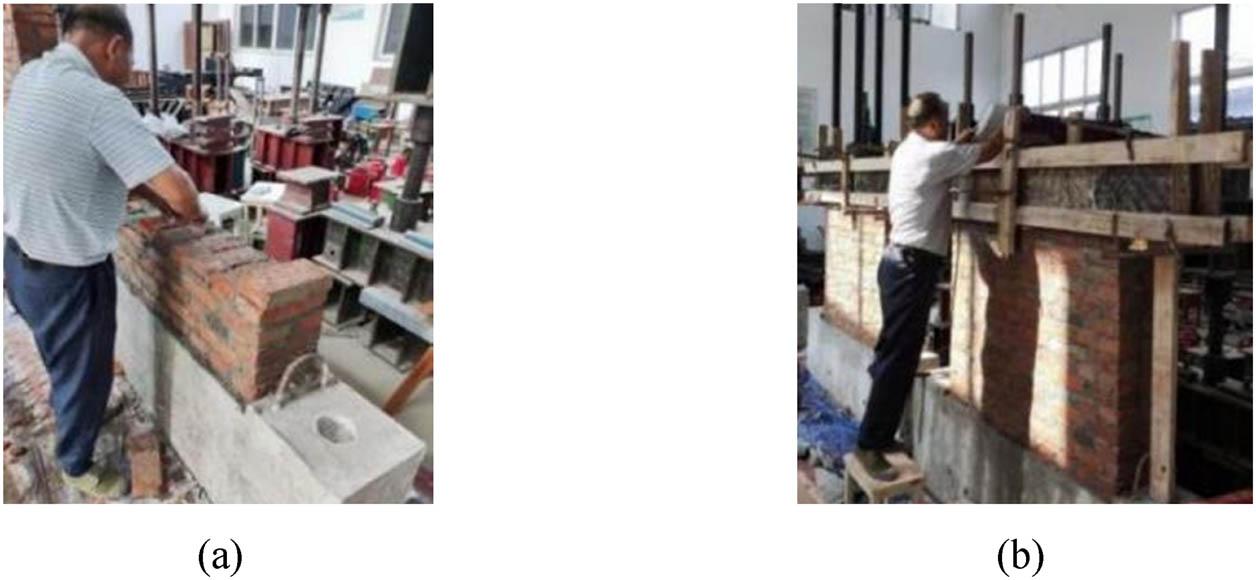
Masonry wall construction process. (a) Brick wall construction. (b) Loading beam formwork and concrete pouring.
Properties of fibers.
| Fiber type | Length/mm | Diameter/μm | Elastic modulus/GPa | Elongation/% | Tensile strength/(N/mm2) | Density/(g/cm3) |
|---|---|---|---|---|---|---|
| PVA | 12 | 40 | 41 | 6.5 | 1,560 | 1.3 |
Chemical properties of cement and mineral admixtures (unit: %).
| Material | SiO2 | Al2O3 | CaO | MgO | Fe2O3 | Na2O | TiO2 | SO3 | K2O |
|---|---|---|---|---|---|---|---|---|---|
| Cement | 19.06 | 4.71 | 66.17 | — | 3.49 | — | — | 2.40 | 0.46 |
| Fly ash | 54.76 | 24.56 | 4.85 | 0.10 | 6.54 | — | 1.85 | — | — |
| Silica fume | 96.74 | 0.32 | 0.11 | 0.10 | 0.08 | 0.09 | — | — | — |
Mix proportions of the matrix (per m³).
| Materials | Quartz sand | Fly ash | Silica fume | Cement | Water |
|---|---|---|---|---|---|
| Mass ratio | 0.36 | 3.00 | 1.00 | 1.00 | 0.30 |
| Quantity (kg/m3) | 115 | 954 | 318 | 318 | 95 |
Figure 6 illustrates the strengthening process of the masonry wall. After the masonry specimens were properly cured, the surface strengthening layer was applied. First, a reinforcing mesh was installed. At the junction between the bottom of the vertical rebars in the mesh and the ground beam, holes were drilled, and the rebars were anchored into the beam using chemical adhesive, with an embedment depth of 3 cm. Before installing strain gauges on the rebars, the measurement points were polished using an angle grinder to ensure a tight bond. The strain gauges were then attached securely, and AB adhesive was applied over both the gauges and their terminals to protect them from damage during the subsequent strengthening. After the AB adhesive cured, the strain gauges were wrapped with black insulating tape. The pre-numbered extension wires firmly connected to the corresponding strain gauge leads to prevent disconnection during the casting of the strengthening layer. All extension wires were then organized and wrapped in plastic bags to protect them and to preserve the identification labels throughout the curing process.
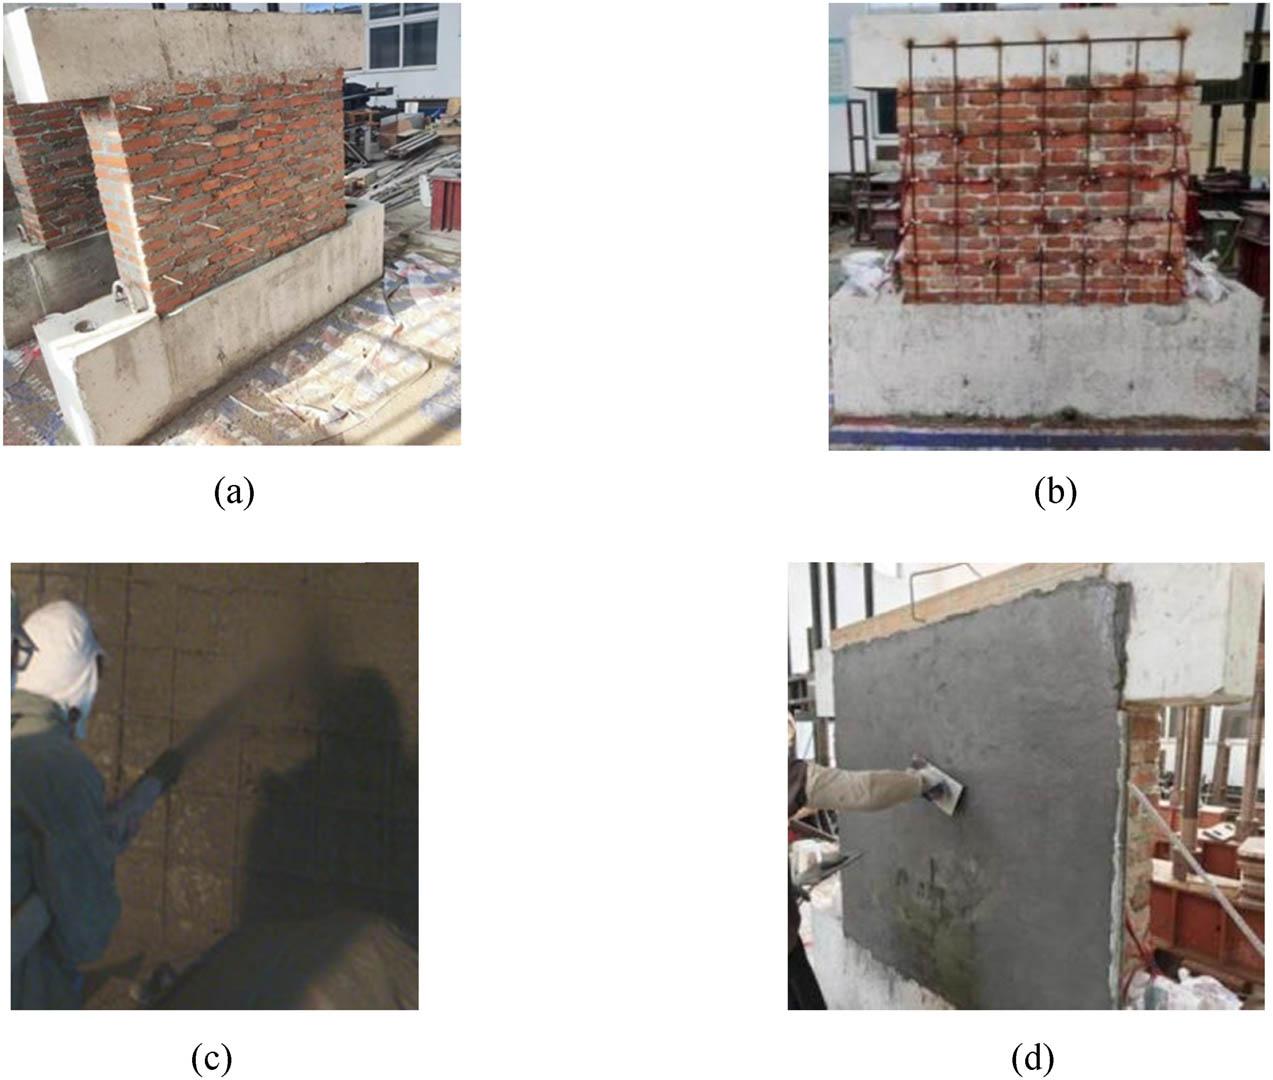
Strengthening of masonry walls. (a) Embed tie bars. (b) Steel mesh and strain gauges. (c) Surface layer ECC spraying. (d) ECC surface layer plastering.
Flowability is a critical parameter for sprayed ECC. The incorporation of appropriate dosages of water-reducing admixtures significantly enhances early-age flow performance. Within 60 min after mixing, the material maintained a flow spread exceeding 160 mm, satisfying the operational time requirements for shotcrete applications. To ensure adequate workability and minimize rebound loss, a perpendicular (90°) spraying technique was adopted when applying the material onto the masonry wall [16]. Prior to spraying, the masonry surface was thoroughly cleaned using a high-pressure water jet to remove dust and debris, thereby promoting effective bonding between the sprayed layer and the masonry substrate. The thickness of the surface layer was controlled using a steel ruler. Following specimen preparation, the samples were manually water-cured for 28 days under outdoor conditions, and companion test blocks of the surface layer material were cured under identical conditions.
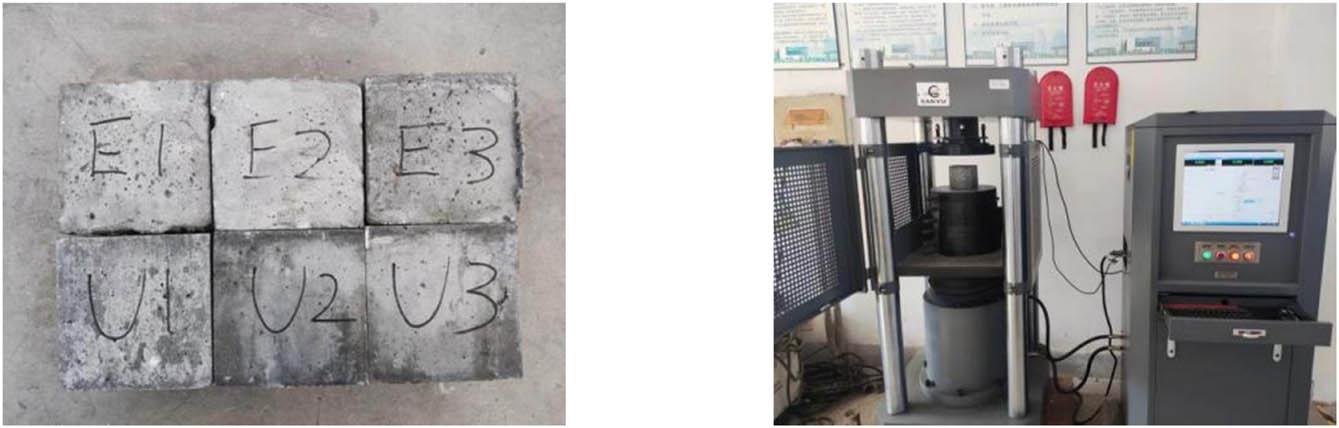
In accordance with the requirements of the “Test Methods for Masonry Bricks” GB/T 2542-2012 [17] and “Fired Common Bricks” GB/T 5101-2017 [18], ten brick specimens were prepared for compressive strength testing. After standard curing, the specimens underwent compressive strength tests. The brick specimens and testing apparatus are presented in Figure 7. The test results are summarized in Table 5.
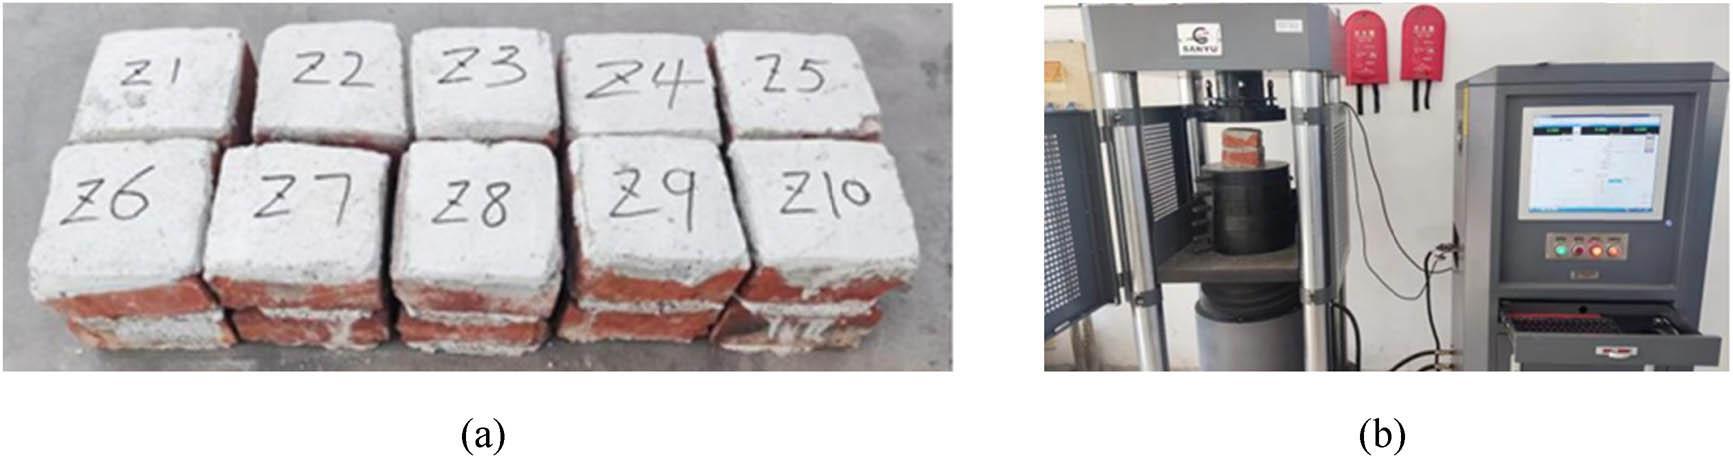
Compressive strength test of a single brick. (a) Brick specimens. (b) Testing apparatus.
Compressive strength of fried common bricks.
| Specimen | Loaded area dimensions (mm) | Ultimate load (kN) | Compressive strength (MPa) |
| S (MPa) | F k (MPa) |
|---|---|---|---|---|---|---|
| Z1 | 108 × 113 | 124.55 | 10.21 | 12.29 | 1.54 | 9.47 |
| Z2 | 109 × 112 | 126.45 | 10.36 | |||
| Z3 | 106 × 113 | 159.29 | 13.30 | |||
| Z4 | 107 × 115 | 165.89 | 13.48 | |||
| Z5 | 107 × 114 | 160.37 | 13.15 | |||
| Z6 | 108 × 115 | 170.39 | 13.72 | |||
| Z7 | 109 × 115 | 175.09 | 13.97 | |||
| Z8 | 109 × 113 | 130.13 | 10.57 | |||
| Z9 | 106 × 114 | 158.91 | 13.15 | |||
| Z10 | 107 × 115 | 135.62 | 11.02 |
According to the requirements specified in GB/T 5101-2017, the strength grade of the bricks used in the masonry walls in this study can be classified as MU10.
The mortar was manually mixed according to the mix proportions “Specification for Mix Proportion Design of Masonry Mortar” JGJ/T 98-2010 [19]. Mortar specimens were then prepared and tested for compressive strength in accordance with the “Standard for Test Method of performance on building mortar” JGJ/T 70-2009 [20], as shown in Figure 8. The test data for the mortar compressive strength are presented in Table 6, where Q-1 to Q-3 represent masonry mortar specimens and M-1 denotes the strengthened surface layer mortar specimen.
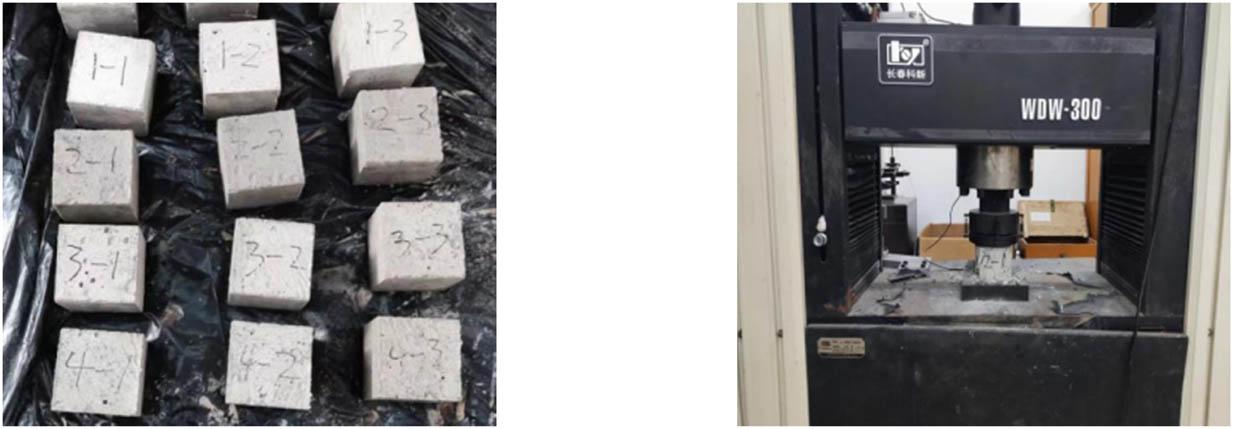
Specimens and testing apparatus.
Test data for the mortar compressive strength.
| Compressive strength (MPa) | Average compressive strength (MPa) | |||
|---|---|---|---|---|
| Q-1 | 5.36 | 5.20 | 5.08 | 5.21 |
| Q-2 | 5.53 | 5.39 | 5.31 | 5.41 |
| Q-3 | 5.33 | 5.49 | 5.35 | 5.39 |
| M-1 | 10.16 | 10.23 | 10.19 | 10.19 |
According to the requirements specified in JGJ/T 70-2009, the strength grade of the masonry mortar can be classified as M5, while that of the surface layer mortar is determined to be M10.
The experiment was conducted in accordance with the “Technical Specification for Mix Proportion Design of Ordinary Concrete” JGJ 55-2011 [21] and “General Code for Concrete Structures” GB 55008-2021 [22]. The measured water-to-binder ratio of the spray ECC was 0.30, and the slump was 193 mm.
According to the “Metallic Materials-Tensile Testing” GB/T 228.1-2021 [23], a tensile test was conducted on the reinforcing bars of the steel mesh used in this study (Table 7).
Mechanical properties of rebar.
| Reinforcing rebar | Rebar diameter (mm) | Yield strength (MPa) | Average (MPa) | Ultimate strength (MPa) | Average (MPa) | Elastic modulus (GPa) | Average (GPa) |
|---|---|---|---|---|---|---|---|
| HRB400 | 6 | 454.33 | 454.18 | 603.47 | 605.87 | 201.74 | 201.43 |
| 453.46 | 609.62 | 203.32 | |||||
| 454.75 | 604.52 | 199.24 |
ECC tensile specimens were prepared as rectangular plates with dimensions of 160 mm × 40 mm × 15 mm. These specimens were cast simultaneously with the main test specimens using an integral casting method and cured under identical conditions. The tensile tests were performed on a DNS-100 universal testing machine equipped with a custom-designed tensile fixture. For the compressive tests, 100 mm × 100 mm × 100 mm cubic specimens were prepared using the same casting and curing procedure, and tested on a YAW-3000C microcomputer-controlled automatic compression testing machine. In addition, prismatic specimens with dimensions of 40 mm × 40 mm × 160 mm were used for compressive strength tests, which were carried out on a WDW-100 universal testing machine. The compressive strength of the concrete was measured in accordance with Codes [24,25,26]. The mechanical performance test results of the ECC are shown in Figure 9, with detailed data presented in Table 8.
Specimens and testing apparatus.
Experimental data of ECC.
| f ct | ε ct | f tu | ε tu | f cu | f cpr |
|---|---|---|---|---|---|
| 2 | 0.023 | 2.4 | 2.5 | 56.9 | 31.4 |
In Table 8, f ct, ε ct, f tu, ε tu, f cu, and f cpr represent the tensile cracking strength, tensile cracking strain, ultimate tensile strength, ultimate tensile strain, cubic compressive strength, and prismatic compressive strength.
The loading setup and horizontal displacement loading protocol used in this experiment are shown in Figure 10. During specimen fabrication, two PVC pipes with diameter of 100 mm were embedded at both ends of the foundation beam to reserve conduit holes. During the test, ground anchor rods were inserted through these conduits to secure the specimen to the ground channel, thereby forming a fixed end at the base of the foundation beam. Horizontal load was applied to the end of the loading beam using a hydraulic servo actuator. Customized steel plates were placed on both sides of the loading beam and clamped using force transmission rods to ensure a reliable connection between the actuator and the beam end. Vertical load was applied at the center of the loading beam using a 50 ton oil jack. A sliding pulley was placed between the jack and the crossbeam of the reaction frame to allow the jack to move horizontally along with the specimen during the test.
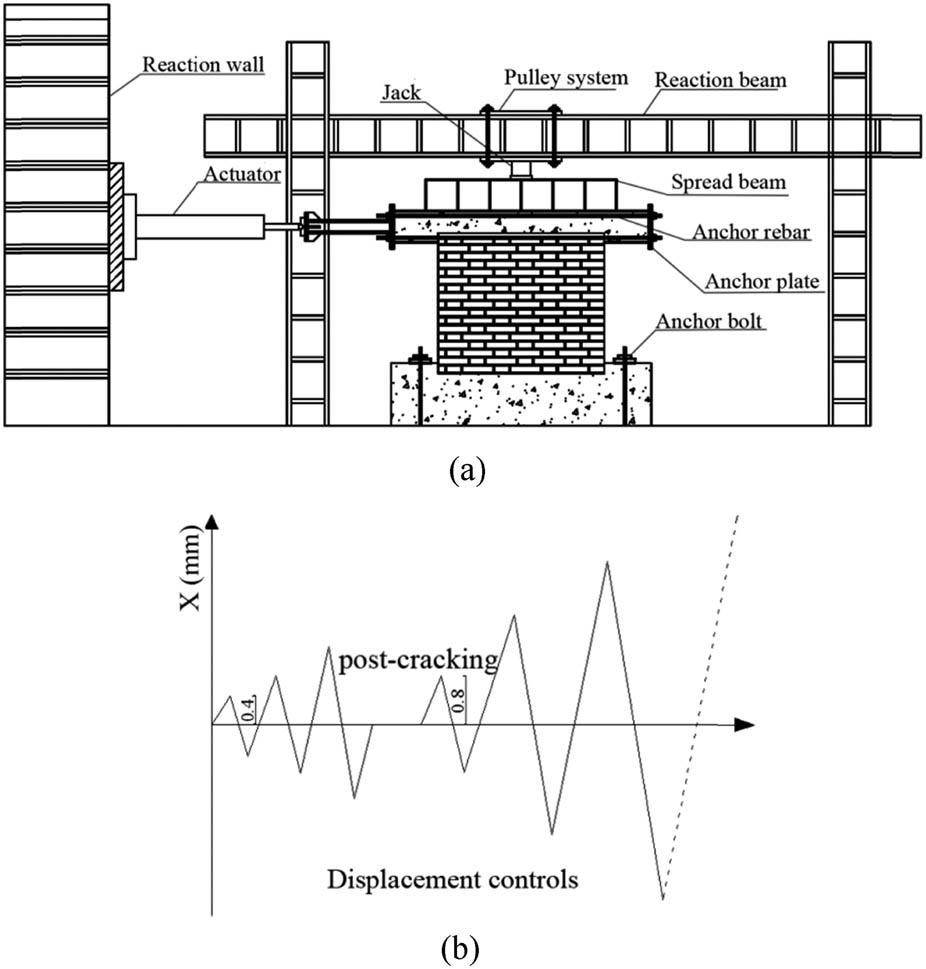
Loading scheme. (a) Loading device. (b) Loading system.
The loading process for this experiment follows the guidelines provided in the “Specification for seismic test of buildings” JGJ/T 101-2015 [27]. A two-stage loading method was employed, where vertical load was applied first, followed by the application of horizontal cyclic load. This loading procedure was used for conducting low-cycle reversed loading tests on masonry structures.
The vertical axial load is a monotonic static load and remains constant throughout the experiment. Prior to the test, the jack was calibrated, and the corresponding values were calculated based on the calibration coefficient. The axial load was then applied in two stages. The first stage involved loading up to 50% of the target axial load, after which the performance of the measurement instruments was checked, and the symmetry of the specimen’s deformation was verified. Following the unloading, the axial load was fully applied and maintained at a stable level for the remainder of the test.
The vertical load loading scheme was designed to simulate the load-bearing system of longitudinal and transverse walls, based on the ground floor of a six-story residential building with conventional masonry construction. The vertical compressive stress was set at 0.5 MPa [28]. The masonry wall specimen measured 1,305 × 240 × 1,018 mm (length × width × height), and the corresponding vertical axial force calculated was 156.6 kN.
The quasi-static test adopted a displacement-controlled cyclic loading protocol, as illustrated in Figure 10 (b), which was determined in accordance with the “Specification for Seismic Test of Buildings” (JGJ/T 101-2015) [29]. Before the initial cracking of the wall, a triangular waveshape was applied with a displacement increment of 0.4 mm, and each displacement level was imposed once. After cracking, the loading continued in the same triangular form but with an increased displacement increment of 0.8 mm, and each displacement level was repeated twice to capture the post-cracking hysteretic response. The cyclic loading proceeded until the lateral load decreased to 85% of the peak load or the specimen exhibited severe damage, at which point the test was terminated.
To investigate the seismic performance of masonry walls, as well as the restraining effect of the steel mesh on the masonry structure and the stress distribution within the strengthening layer, strain data were primarily collected from the steel mesh and the strengthening layer, while displacement data were obtained from the masonry wall and the loading beam using displacement gauges. The horizontal load was automatically recorded by the loading system. The layout of strain gauges and displacement gauges used in this experiment is shown in Figure 11.
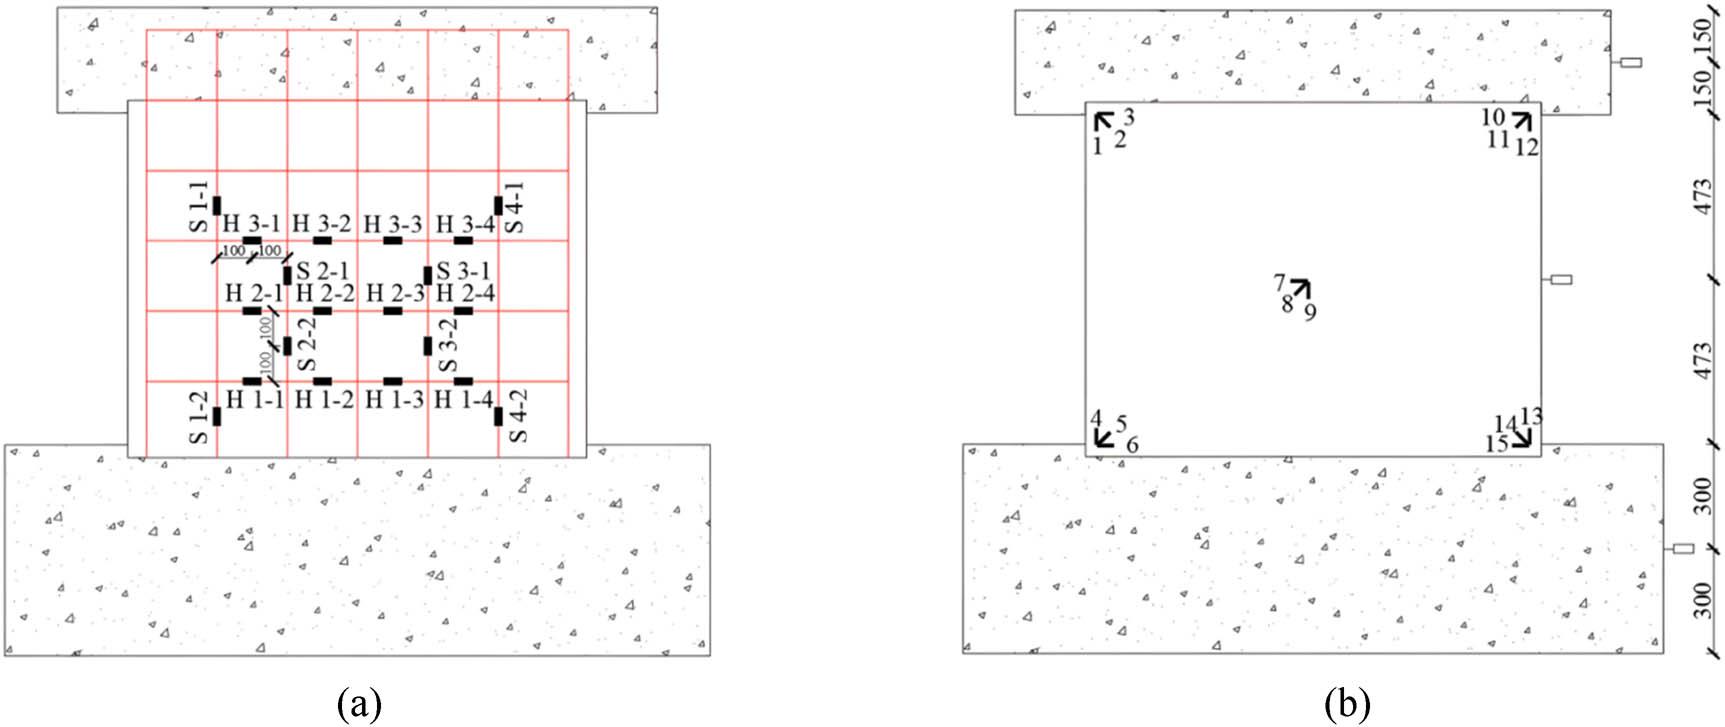
Schematic layout of measure points. (a) Schematic diagram of strain gauges attached on the reinforcing mesh. (b) Schematic diagram of strain and displacement gauges attached on the strengthened surface layer.
Traditional methods of measurement using strain gauges and displacement gauges have the disadvantage of complex setup, being limited to recording data from specific measurement points, and failing to analyze the full-field evolution of the specimen [30]. The Digital image correlation (DIC) method [31] obtains in-plane displacement and strain, along with other mechanical information, by capturing images and performing digital matching computations on the selected image regions.
When using the DIC method in the experiment, the first step is to create a speckle pattern on the surface of the specimen. A speckle pattern refers to a randomly distributed particle-like light intensity field formed by coherent light being scattered by an optically rough surface or inhomogeneous medium, characterized by its movement as the object deforms or moves [32]. There are currently two main methods for creating speckle patterns: manual production and speckle stickers. The quality of manually created speckles cannot be guaranteed, so this experiment uses speckle stickers. The speckle pattern is applied to the measurement area, as shown in Figure 12. In addition, to enable full-field deformation monitoring, real-time data acquisition, and visualization during the wall tests, a unidirectional module of the DIC system was employed to conduct precise and non-contact monitoring of the front-face compression zone. The laboratory setup utilized a high-speed camera with a resolution of 2,448 × 2,048 and a strain measurement accuracy of ≤50 μɛ. Before loading, the DIC equipment was configured and calibrated, followed by debugging and a preliminary test. The shooting frequency was set to 1 Hz, and data acquisition was initiated only after confirming that the measured data could be fully analyzed to capture concrete damage. Subsequently, the settings and calibration results were verified to ensure that the collected data could be accurately analyzed and that the calculated results corresponded to the strain evolution of the wall during loading. After debugging, the area between the DIC camera and the specimen was cleared to ensure unobstructed monitoring throughout the test. Then, lighting equipment is turned on, the camera exposure is adjusted, VIC-20 software parameters are set, and the experiment is ready to begin.
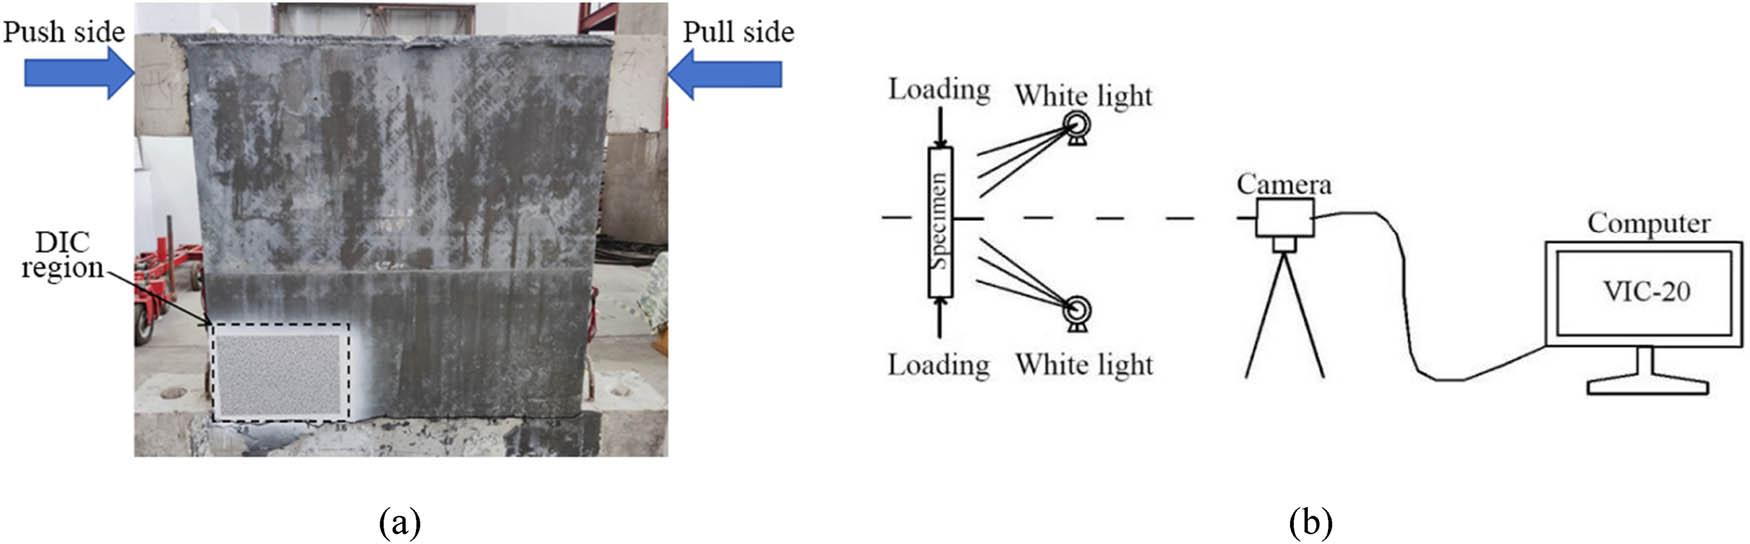
DIC measurement process. (a) DIC measurement area. (b) Diagram of the DIC data acquisition system.
The main instruments used in this experiment are shown in Figure 13.
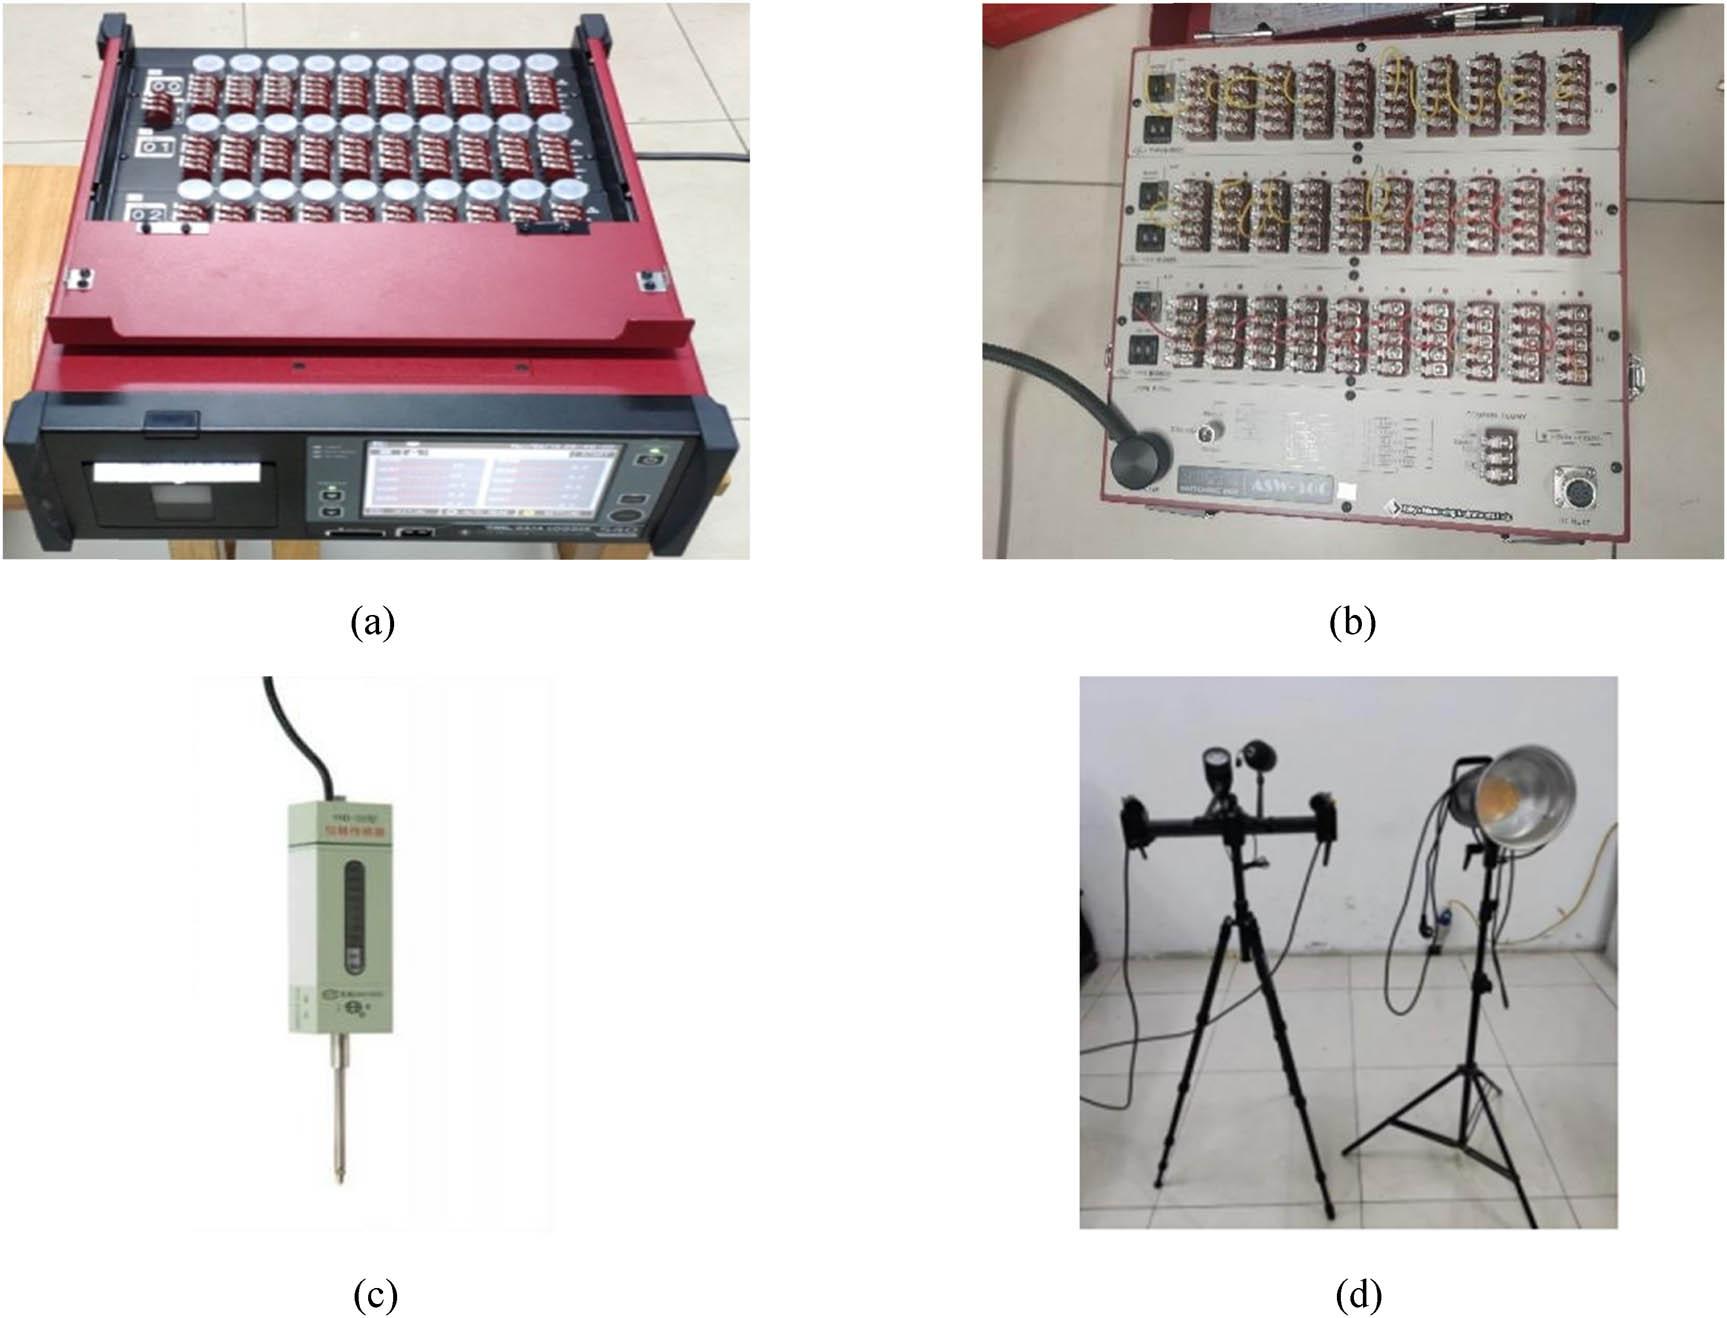
Main instruments. (a) TDS-540 static resistance strain acquisition system. (b) Extension unit. (c) Displacement gauges. (d) DIC device.
For specimen S1, no visible crack was observed in the wall after the application of vertical loads. When the lateral load reached F = +75.34 kN with a displacement of Δ = +1.60 mm (positive for actuator pushing, negative for pulling), three minor diagonal cracks along the mortar joints appeared on the first, third, and sixth layers of bricks at the bottom west side of the wall, and two minor downward diagonal cracks were observed on the first and third layers at the upper east side. When the lateral load increased to F = −69.40 kN with a displacement of Δ = −2.00 mm, two minor upward diagonal cracks along the mortar joints developed on the third and seventh layers of bricks at the bottom east side, and two minor downward diagonal cracks appeared on the second and fourth layers at the upper east side. When the lateral load reached F = +97.32 kN with a displacement of Δ = +2.00 mm, the diagonal crack on the west side of the wall continued to propagate along a 45 degree angle. As the load reversed to F = 82.39 kN with Δ = −2.40 mm, a similar diagonal crack on the east side extended along the same angle. When the displacement reached Δ = ±4.00 mm, the primary diagonal cracks on both the east and west sides further propagated, and the peak load-bearing capacity dropped below 85%. The test was subsequently terminated, and the failure pattern of specimen S1 is shown in Figure 14.
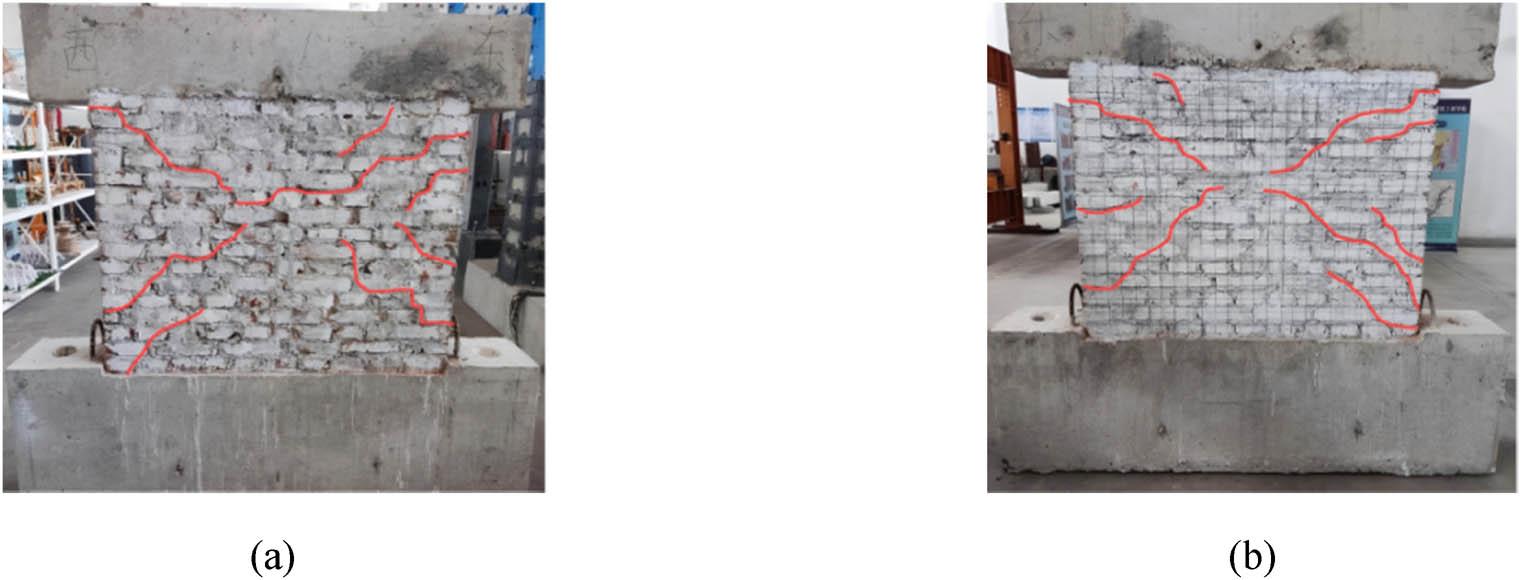
Failure pattern of specimen S1. (a) The south side of the specimen. (b) The north side of the specimen.
The initiation and propagation of diagonal cracks along mortar joints indicate that the shear resistance of the unreinforced masonry governed the failure process. Owing to the absence of any strengthening measures, the masonry shear capacity was exhausted prior to the development of flexural deformation, resulting in a typical diagonal shear failure mode. The test was subsequently terminated, and the failure pattern of specimen S1 is shown in Figure 14.
For specimen S2, no visible cracks were observed after the application of vertical loads, and the wall remained intact during the early stages of lateral loading. When the load reached F = +111.19 kN with a displacement of Δ = +2.80 mm, a crack appeared at the connection between the bottom brick and the foundation beam on the pushed side. Reversing the load to F = −105.87 kN with Δ = −2.80 mm, a crack formed at the same location on the tension side, alongside a slender crack along the first mortar joint at the bottom of the wall. As the horizontal displacement continued to increase, a slight crack appeared at the connection between the bottom of the finish layer and the ground beam (F = +120.47 kN, Δ = +4.80 mm), and a similar crack developed on the tension side upon load reversal (F = −115.62 kN, Δ = −4.80 mm). At F = +145.17 kN with Δ = +5.20 mm, the crack at the bottom of the finish layer further extended, and deformation was subsequently governed by lateral rocking. The horizontal load-bearing capacity gradually declined afterwards, dropping below 85% at F = +128.13 kN with Δ = +6.80 mm, at which point the test was terminated. The absence of pronounced diagonal cracking and the dominance of rocking deformation demonstrate that the ECC overlay effectively restrained shear crack development and enhanced the tensile capacity of the wall surface. Consequently, the governing failure mechanism of specimen S2 shifted from shear to flexure, leading to a flexural-dominated failure mode. The failure pattern is shown in Figure 15.
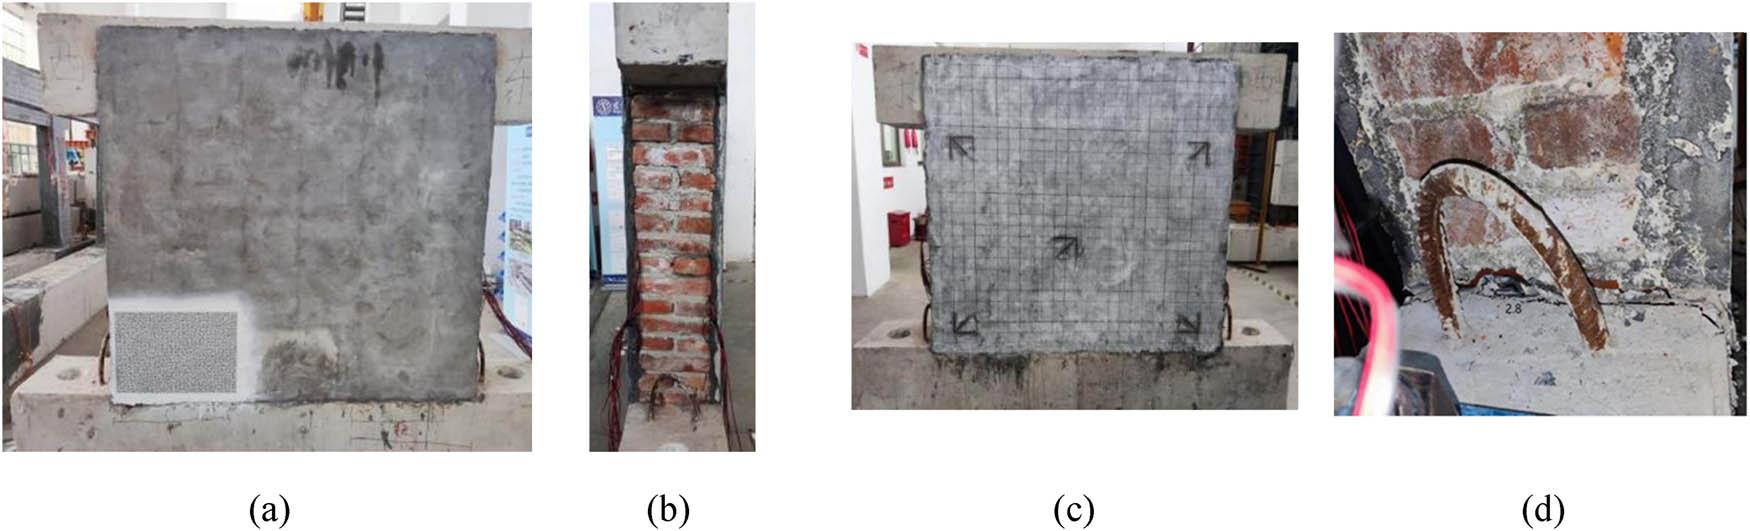
Failure pattern of specimen S2. (a) The south side. (b) The west side. (c) The north side. (d) The east side.
For specimen S3, no visible cracks were observed in the wall after the full application of vertical loads. When the load reached F = +106.48 kN with a displacement of Δ = +2.40 mm, a crack appeared at the connection between the bottom brick and the foundation beam along the wall thickness on the west side. Upon reversing the load to F = −90.25 kN with Δ = −2.40 mm, a similar crack developed at the corresponding location on the east side. Subsequently, the amplitude of horizontal displacement was adjusted to 0.8 mm. When the load reached F = +117.51 kN with Δ = +3.20 mm, cracks appeared in both the first and second mortar joints at the bottom of the wall thickness on the west side, as well as at the connection between the bottom brick and the ground beam. When the load reached F = −107.83 kN with a displacement of Δ = −3.20 mm, a slight crack appeared at the first mortar joint at the bottom of the east side of the wall, along the wall thickness. When the load increased to F = +112.41 kN with Δ =+4.00 mm, a continuous crack formed at the second mortar joint at the bottom of the west side, resulting in a stepped crack. Subsequently, the wall exhibited primarily lateral rocking, with the crack at the connection between the finish layer and the foundation beam nearing penetration. No new crack was observed. With the horizontal displacement increased, the horizontal load-bearing capacity decreased gradually. The observed cracking pattern, concentrated at the wall base and accompanied by dominant rocking deformation, indicates that the cement mortar overlay increased the flexural resistance of the wall and suppressed diagonal shear cracking. As a result, specimen S3 failed in a flexural-dominated mode, although with fewer and wider cracks compared to the ECC-strengthened specimen. The test was terminated after the displacement reached Δ = ±4.80 mm, and the failure pattern is shown in Figure 16.
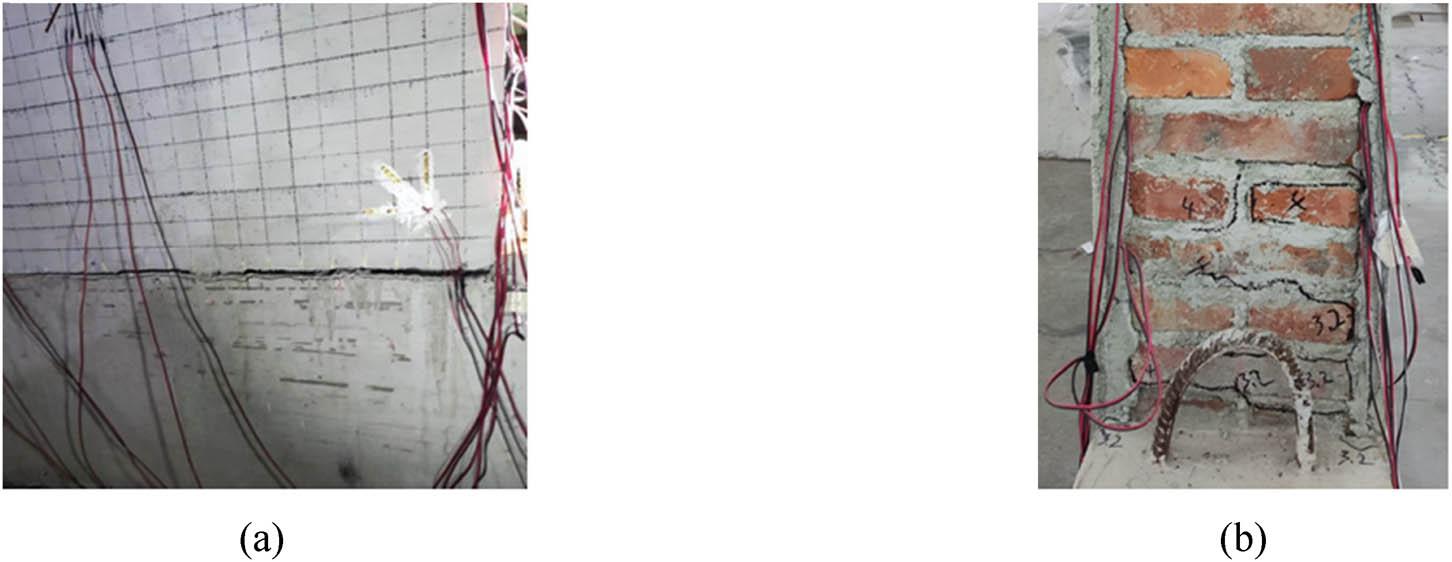
Failure pattern of specimen S3. (a) Cracking at the bottom of the mortar layer. (b) Cracking at the bottom of the sidewall.
According to previous studies [33,34], the failure pattern of masonry walls can be categorized into the following four types.
-
1)
Slippage failure typically occurs in masonry walls with a high aspect ratio and low vertical compressive stress. When the shear force applied to the wall exceeds the frictional resistance between the mortar joints caused by vertical compressive stress, the mortar joints can no longer provide sufficient resistance to sliding, leading to slippage failure. This failure mode is usually characterized by horizontal sliding along the mortar joints, which severely impacts the overall stability of the wall.
-
2)
Flexural failure generally occurs when high-strength mortar is used during construction, and the masonry wall has a large aspect ratio but low vertical compressive stress. With the horizontal load increases, the vertical force and the bottom reaction force can no longer effectively counteract the flexural moment generated at the bottom of the tensile side of the wall, leading to the formation of cracks at the bottom. The masonry wall undergoes repeated rocking along the two bottom corners, and finally, the failure of these corners causes a gradual reduction in the load-bearing capacity.
-
3)
Diagonal crushing failure, also known as oblique compression failure, typically occurs when masonry walls are subjected to high compressive stress. Under such conditions, the wall exhibits characteristics similar to compressive failure. As the horizontal load increases, the compressive stress at the wall’s diagonal regions intensifies until the corners are crushed, resulting in a significant reduction in load-bearing capacity.
-
4)
Diagonal shear failure commonly occurs in masonry walls with a low height-to-width ratio and subjected to high compressive stress. As the vertical pressure increases, the strength required to initiate diagonal shear failure becomes lower than that required for sliding failure. When the principal tensile stress in the wall exceeds the tensile strength along its diagonal section, diagonal shear failure occurs. In this failure mode, intersecting diagonal cracks form along the wall, and once these cracks propagate and connect, the wall’s load-bearing capacity drops sharply, exhibiting a brittle failure characteristic.
In summary, specimen S1, representing the unstrengthened wall, exhibited a typical diagonal shear failure pattern characterized by intersecting cracks across the wall. Consistent with previous studies on URM under cyclic loading [35], such diagonal cracking led to rapid degradation of load-bearing capacity due to the brittle nature of masonry. Specimen S2, strengthened with a 30 mm thick ECC overlay and steel mesh on both sides, demonstrated significantly altered failure behavior. The high tensile strain capacity and crack-control properties of ECC effectively delayed crack initiation and propagation, leading to an increased cracking load and enhanced lateral stiffness compared with specimen S1. Specimen S3 strengthened with a 30 mm thick mortar layer and steel mesh, showed similar improvements in initial stiffness and shear resistance, though with slightly less ductility than S2. Ultimately, both specimens S2 and S3 exhibited a flexural-dominated failure mode, characterized by crack initiation at the tensile side of the wall base and progressive damage accumulation that led to a gradual decline in load-bearing capacity. These findings are consistent with the behaviors reported in previous studies on strengthened masonry walls. In textile-reinforced motar (TRM)-strengthened URM walls, diagonal shear cracks accompanied by TRM layer delamination are commonly observed, highlighting the importance of interface bonding. Steel strip-confined masonry walls [36] under low-cycle cyclic loading exhibited shear sliding along the wall plane and enhanced energy dissipation, demonstrating the effectiveness of continuous surface confinement. In C-shaped masonry walls retrofitted with twisted or bonded bars [37], cyclic out-of-plane loading primarily led to improved wall base integrity and increased ductility, while controlling separation at wall junctions. Compared with these prior studies, the present ECC overlays not only increased the load-bearing capacity of the walls but also simultaneously controlled crack propagation, improved flexural performance, and enhanced shear resistance, providing a more comprehensive simulation of masonry wall behavior under multi-directional seismic loading.
The hysteresis curves of walls tested are shown in Figure 17.
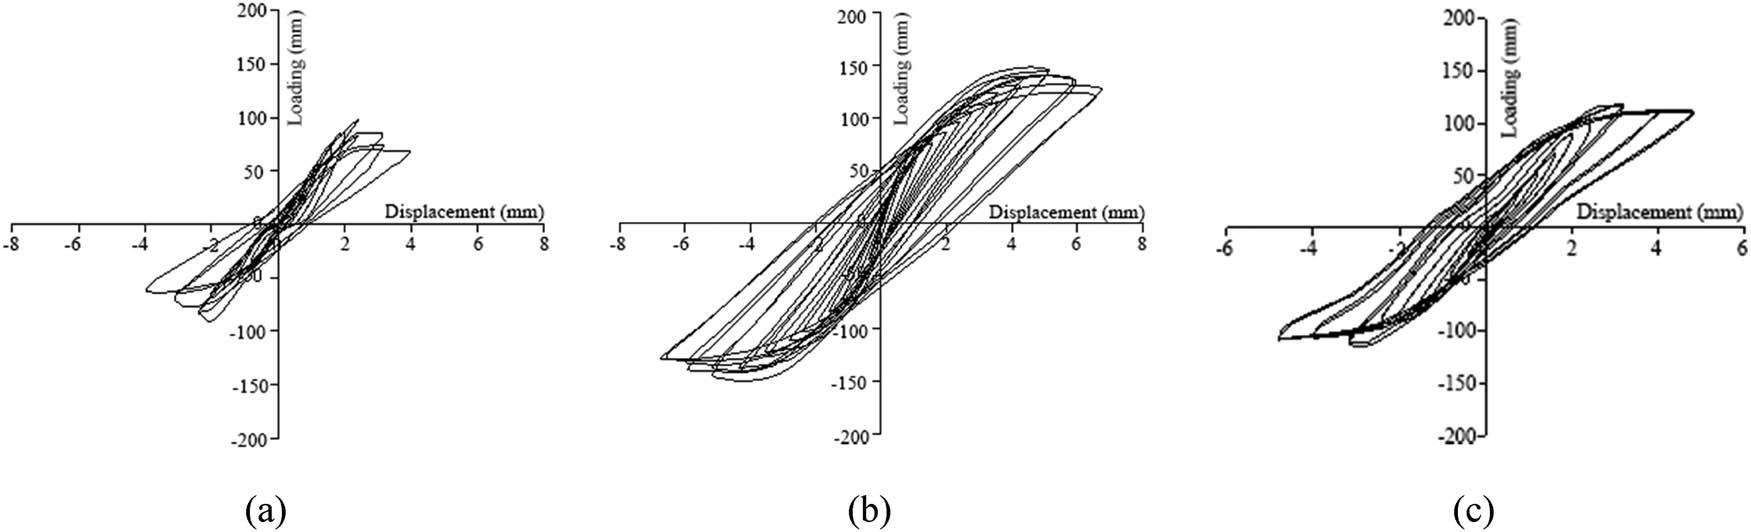
Comparison of hysteresis curves. (a) Specimen S1. (b) Specimen S2. (c) Specimen S3.
As shown in Figure 17, S1 exhibited narrow hysteresis loops with pronounced pinching and rapid stiffness degradation, indicative of brittle shear behavior dominated by diagonal cracking. Its limited deformation capacity and low energy dissipation reflect the inherent vulnerability of unstrengthened masonry under cyclic loading.
S3 showed moderate improvement, the hysteresis loops became fuller and the pinching effect was partially mitigated, indicating enhanced load transfer and delayed stiffness degradation. However, the improvements in ductility and energy dissipation remained limited, primarily due to the brittle nature of the mortar and the relatively insufficient bond performance at the wall–overlay interface. Although the embedded steel mesh contributed to better mechanical interaction, the mortar layer could not maintain high deformation capacity after cracking.
S2 demonstrated the best seismic behavior. The hysteresis loops were significantly fuller and more stable, with minimal pinching and smoother stiffness degradation. Substantial increases in peak load, ductility, and cumulative energy dissipation were observed. These enhancements are attributed to the synergistic interaction among the masonry substrate, the anchored steel mesh, and the high-ductility ECC overlay. The strain-hardening and multiple-cracking characteristics of ECC allowed the strengthening layer to sustain substantial cyclic deformation while maintaining its load-bearing capacity.
In summary, the hysteretic responses of specimens S1–S3 are in good agreement with their observed failure modes. The diagonal shear failure of the unstrengthened specimen S1 resulted in pronounced pinching and rapid stiffness degradation, whereas the flexural-dominated behavior of specimens S2 and S3 led to fuller hysteresis loops and improved energy dissipation, with the ECC-strengthened specimen exhibiting the most stable hysteretic performance.
The skeleton curve is an envelope curve formed by connecting the peak points of the first loading cycle at each displacement loading cycle from the hysteresis loops. The comparison for the skeleton curves of specimens tested is shown in Figure 18.
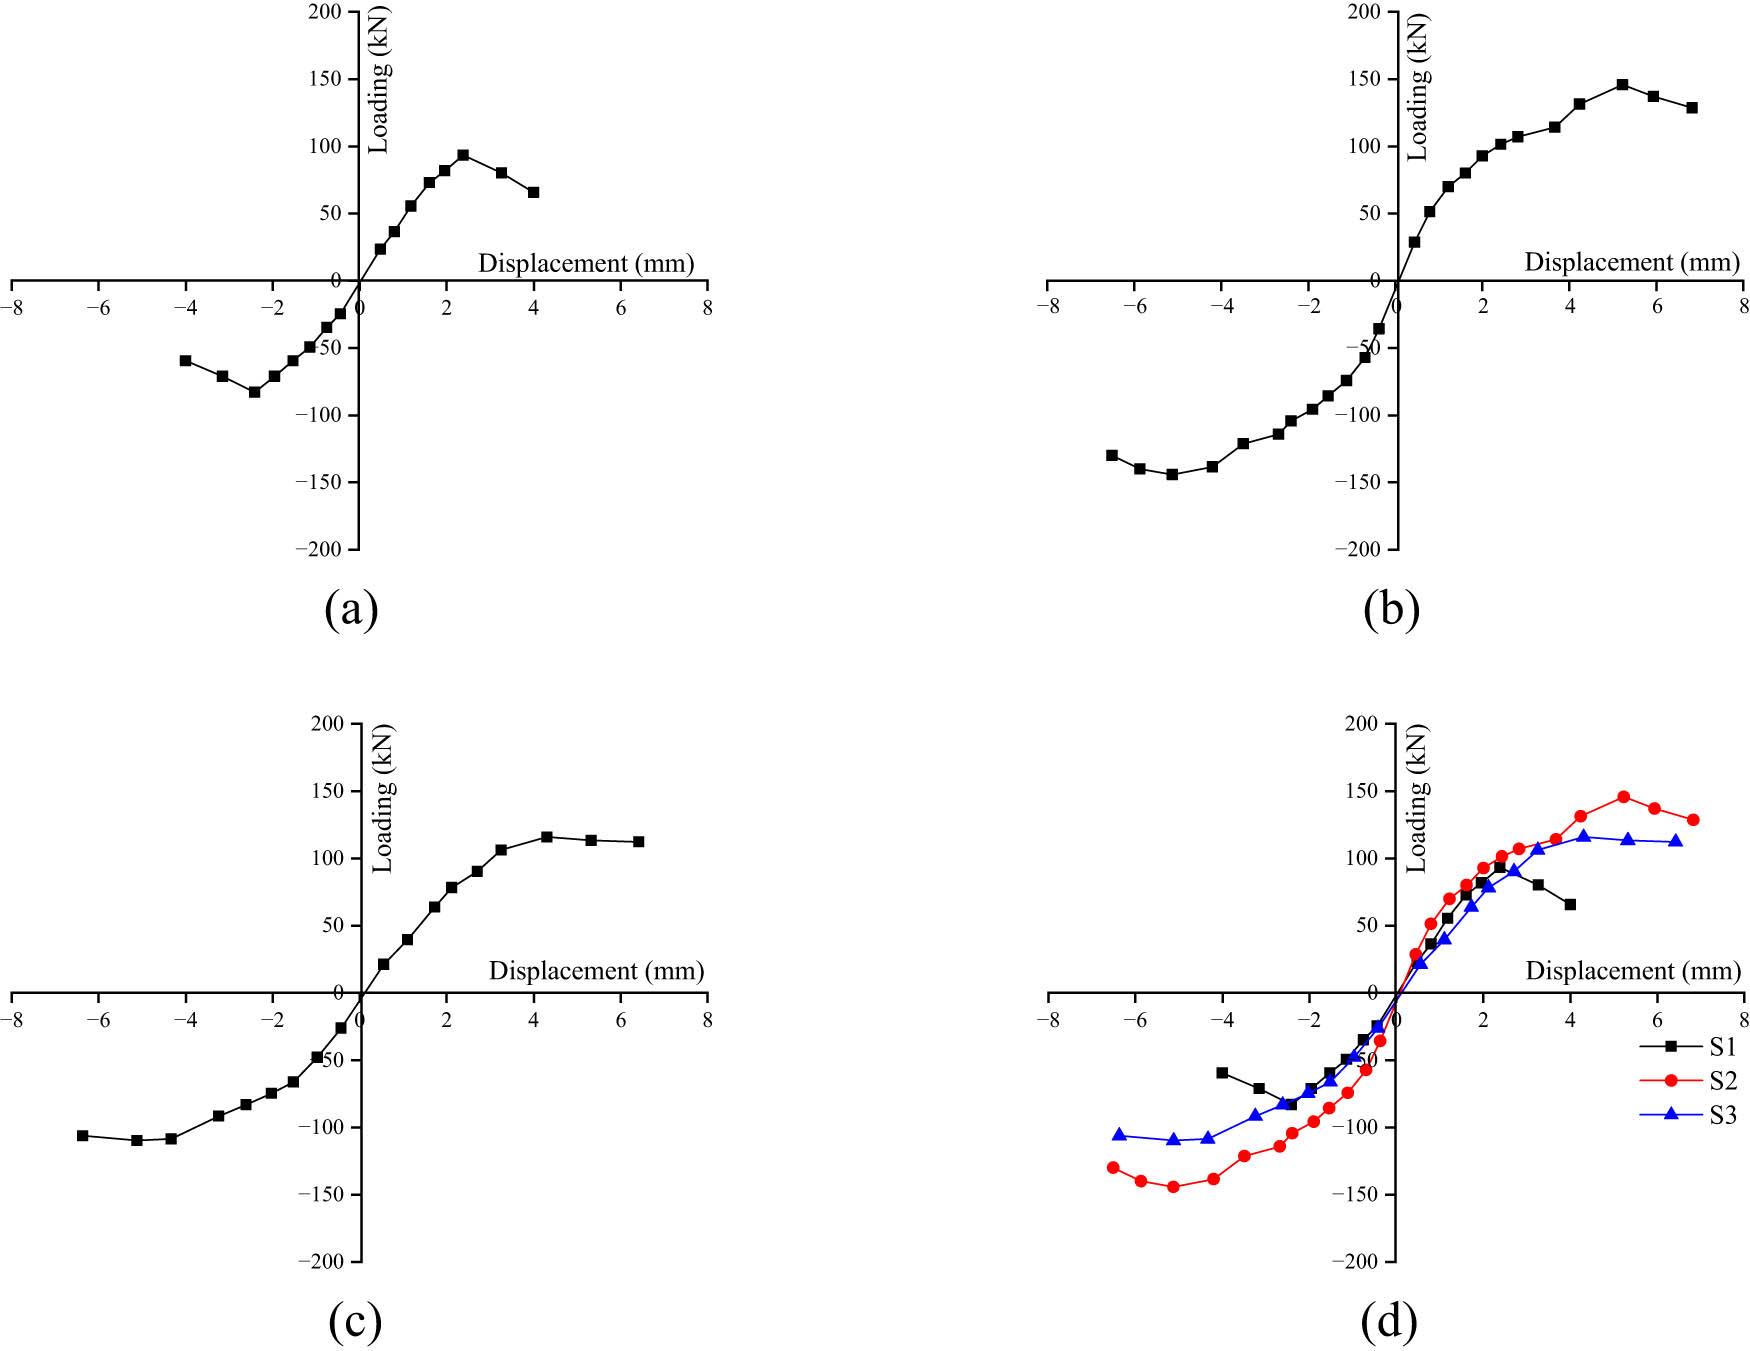
Skeleton curves. (a) Specimen S1. (b) Specimen S2. (c) Specimen S3. (d) Comparison of skeleton curves.
As shown in Figure 18, before reaching the peak load, the skeleton curve of the unstrengthened specimen S1 primarily exhibits linear behavior. After the peak load, the loading capacity decreases significantly, demonstrating brittle characteristics. In contrast, the strengthened specimens exhibit an initial linear segment followed by an elastoplastic hardening phase, indicating that strengthening improves the wall’s deformation capacity. Both the double-sided strengthened specimens exhibited flexural failure. After the peak load, the skeleton curve primarily developed horizontally, with a slow decline in the loading capacity. The enhancement effect of specimen strengthened with steel mesh-ECC layer is higher than that of specimen strengthened with steel mesh-cement mortar layer. With double-sided strengthening, the initial slope of the skeleton curves increased, resulting in improved stiffness.
The strain distributions on the strengthen layer and reinforcements are shown in Figures 19–22. In Figure 19, “E-1” denotes the strain gauge located at position no. 1 on the surface layer of specimen S2. In Figure 20, “EH1-1” refers to the strain gauge labeled “H1-1” on the reinforcement mesh of specimen S2. In Figure 21, “M-1” indicates the strain gauge at position no. 1 on the surface layer of specimen S3. In Figure 22, “MH1-1” represents the strain gauge labeled “H1-1” on the reinforcement mesh of specimen S3. The remaining labels follow the same naming convention.
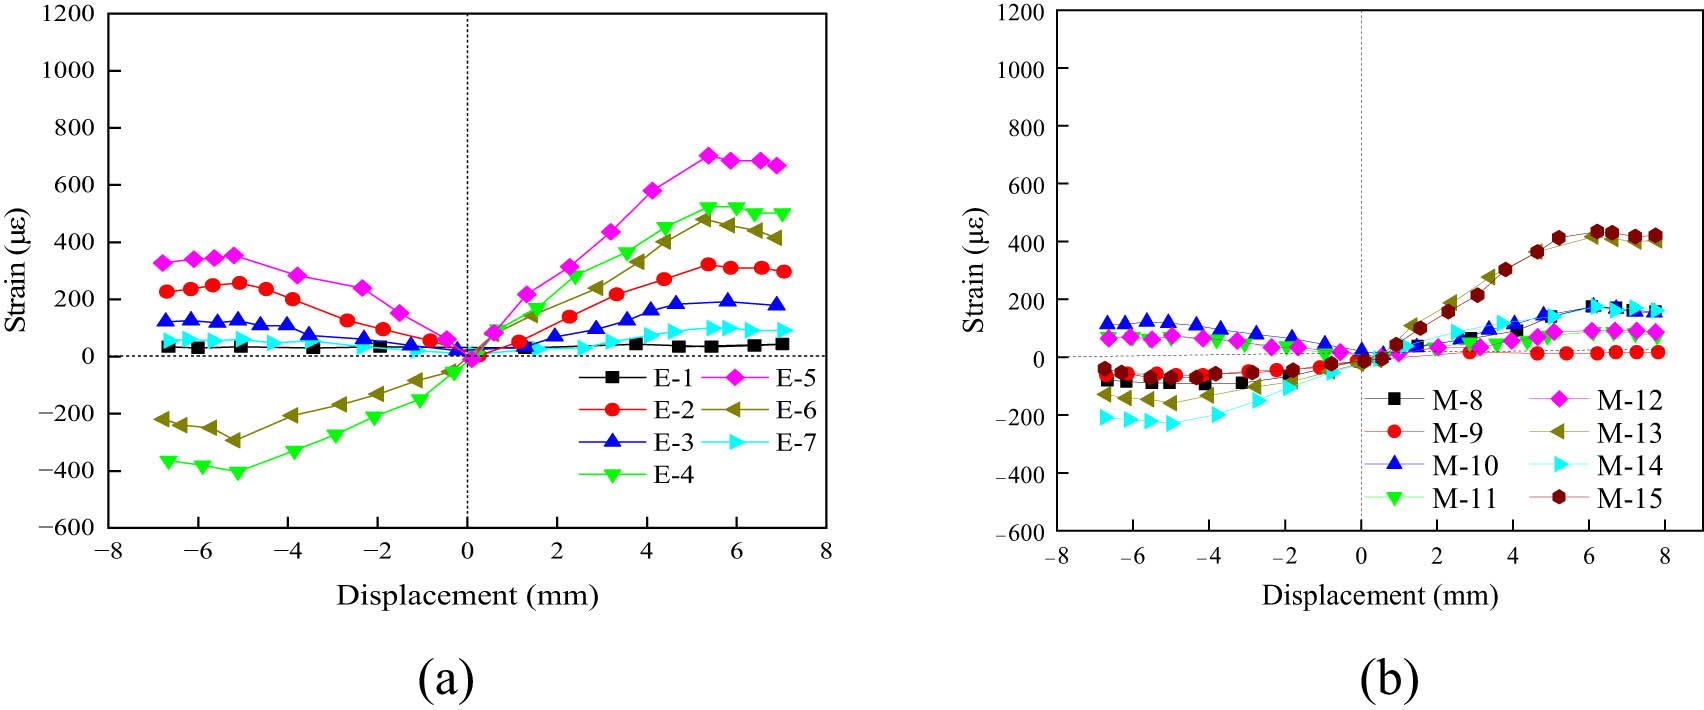
Strain distribution on the strengthening layer of specimen S2. (a) E-1∼E-7. (b) E-8∼E-15.
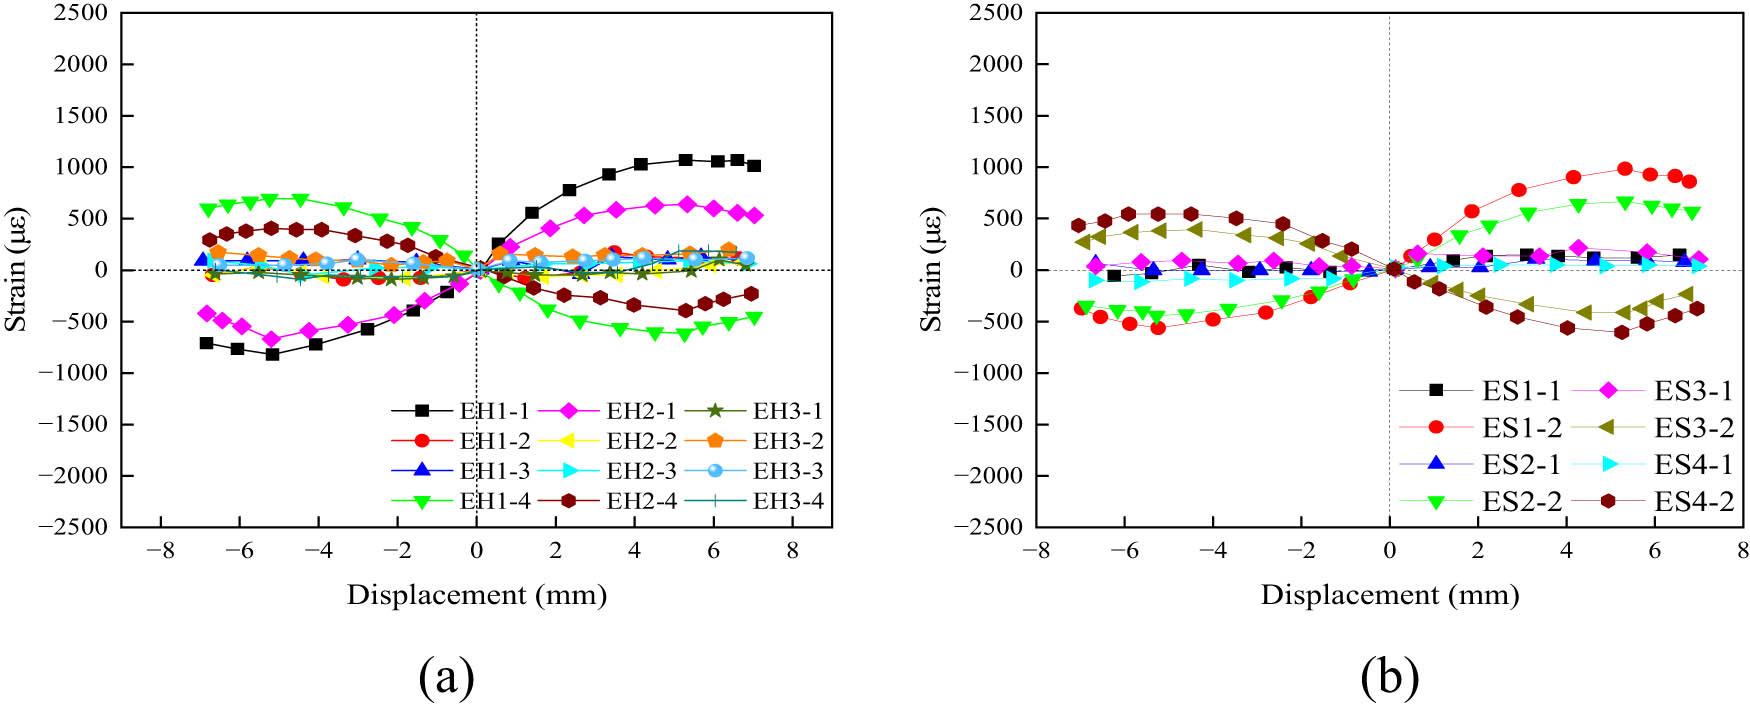
Strain distribution on the reinforcement of specimen S2. (a) Transverse reinforcement strain. (b) Vertical reinforcement strain.
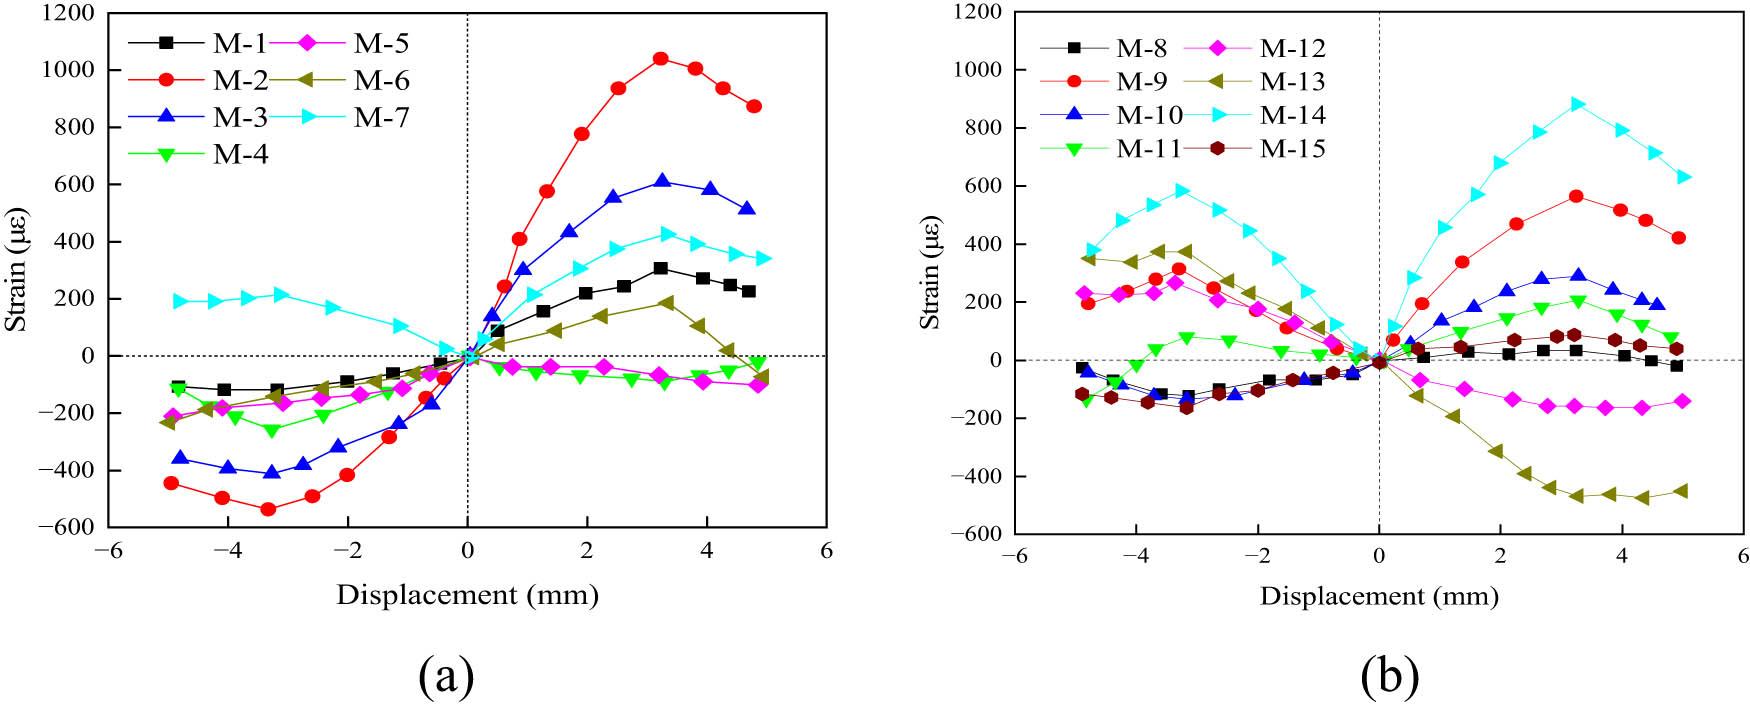
Strain distribution on the strengthening layer of specimen S3. (a) M-1∼M-7. (b) M-8∼M-15.
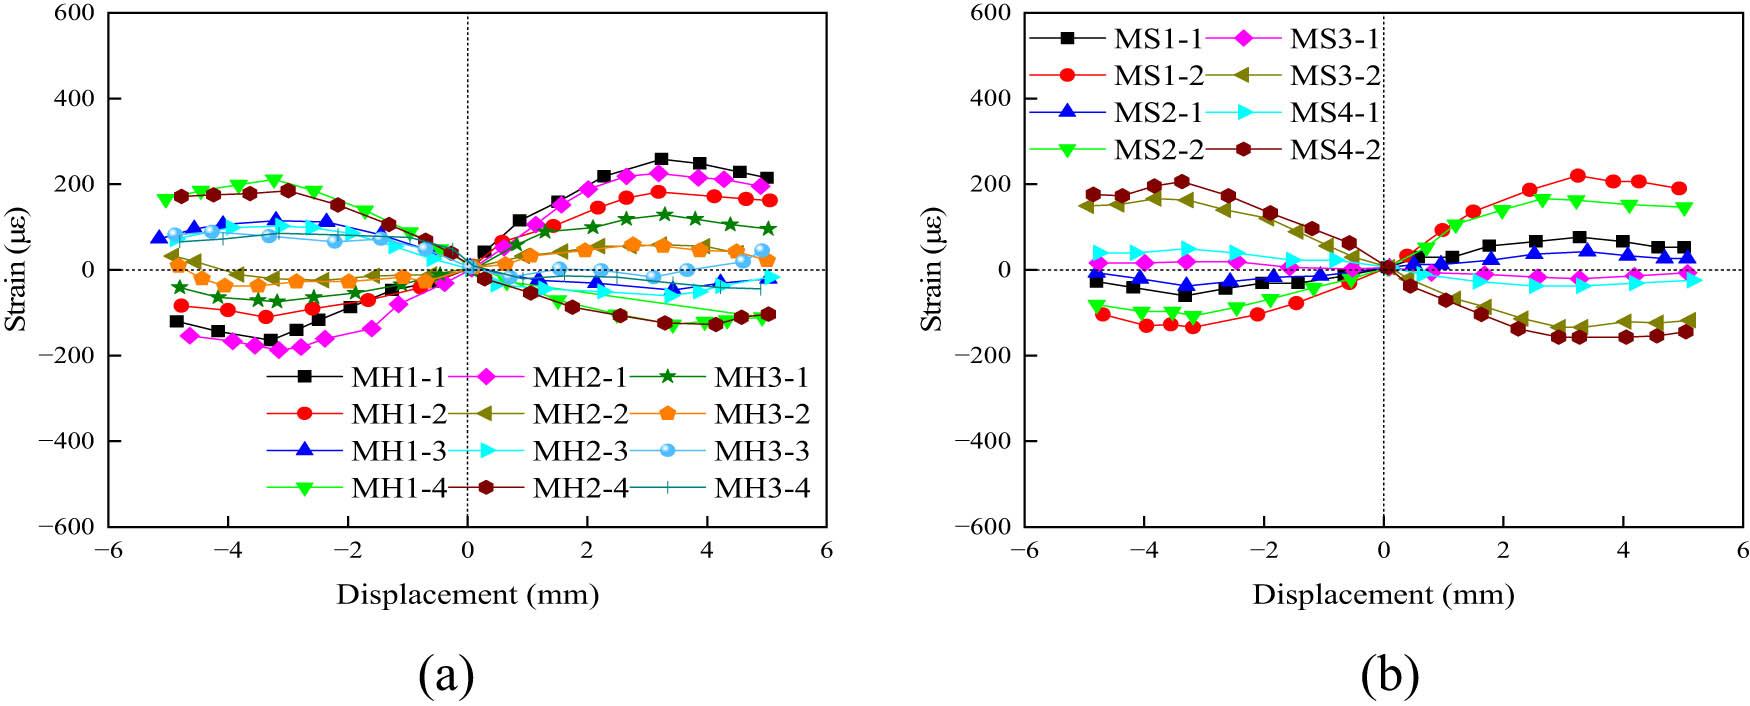
Strain distribution on the reinforcement of specimen S3. (a) Transverse reinforcement strain. (b) Vertical reinforcement strain.
All strengthened masonry walls exhibited flexural failure, with damage concentrated at the wall corners. As shown in Figures 19 and 21, the surface strain near the corners was significantly higher and reached its peak when cracks appeared at the wall base. Figures 20 and 22 indicate that the steel mesh embedded in the surface layer did not yield during loading. Experimental observations confirm that flexural failure occurred in all strengthened specimens, with the highest strain in the mesh located near the wall corners, coinciding with the initiation of cracks at the wall base. Figure 23 shows the DIC acquired strain field and corresponding contour map.
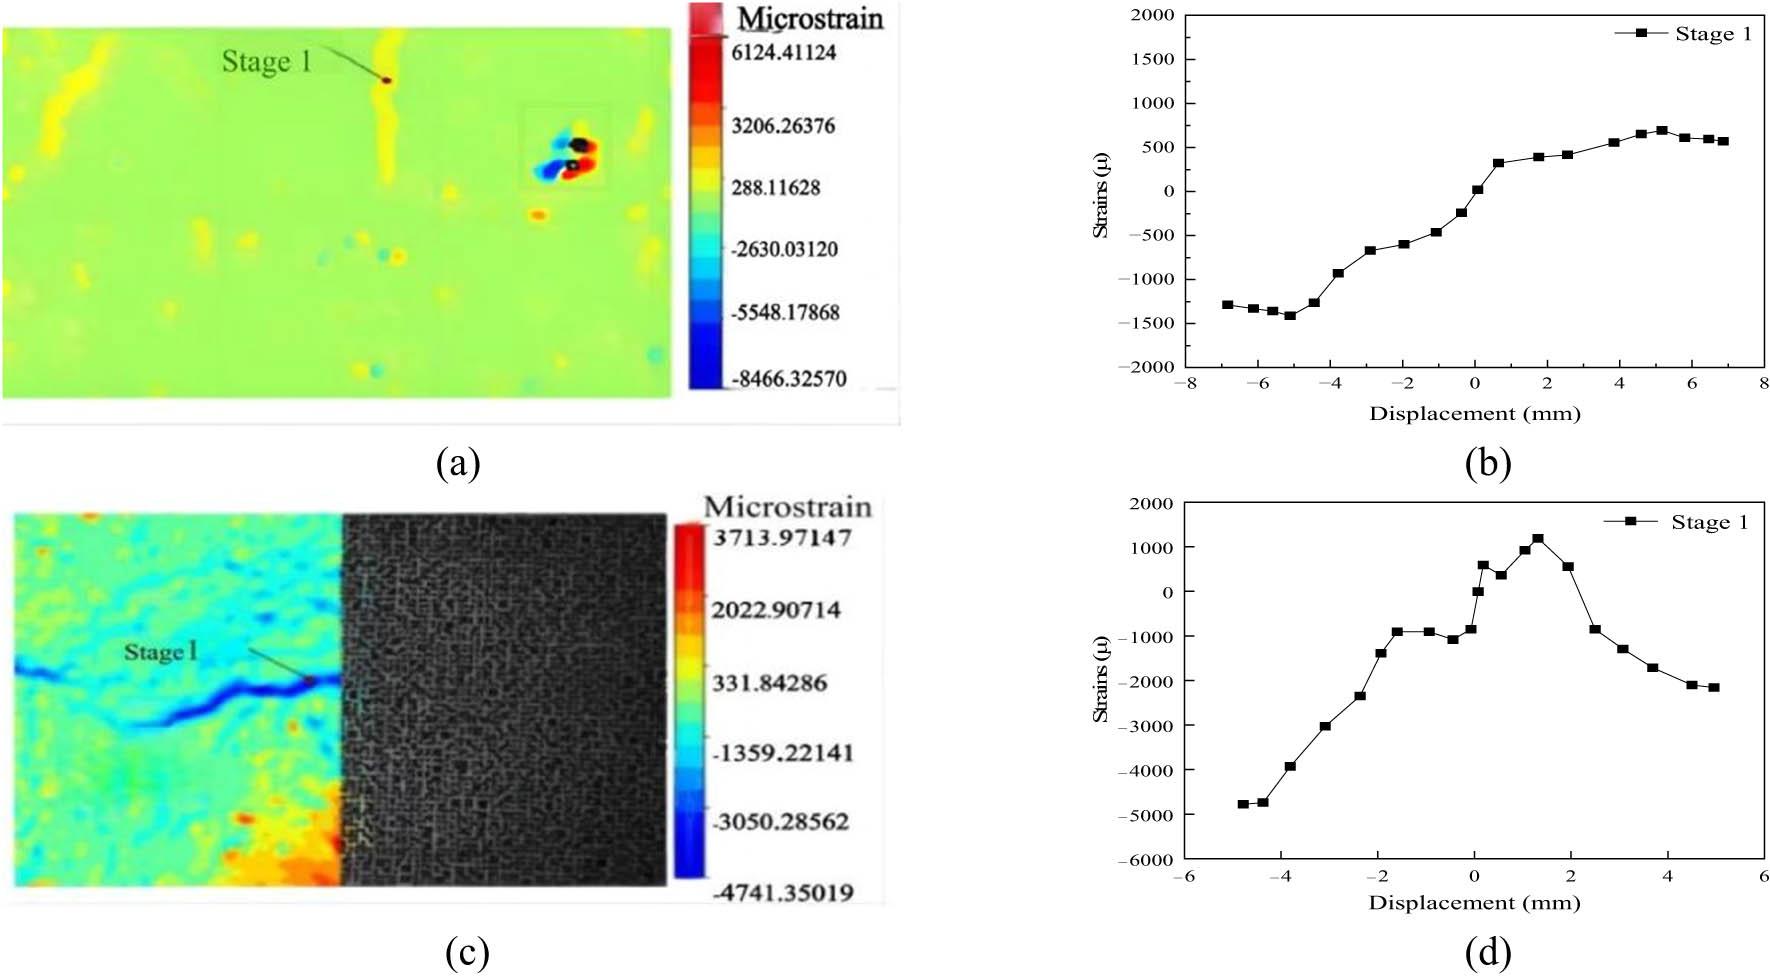
Strain contours and strain data obtained through DIC. (a) Strain contour map of specimen S2. (b) Strain distribution of specimen S2. (c) Strain contour map of specimen S3. (d) Strain distribution of specimen S3.
Stiffness refers to the ability of a material or structure to resist deformation under applied force. In this study, the stiffness of the wall is defined as the magnitude of the horizontal load required to produce a unit horizontal displacement.
Under low reversed cyclic loading, as the horizontal displacement of the masonry wall specimens gradually increases, cracks repeatedly open and close, leading to the accumulation of plastic damage and progressive stiffness degradation. To characterize the stiffness degradation of each specimen, the secant stiffness at the peak load point during the first cycle of each displacement level is adopted, in accordance with the “Specification for seismic test of buildings” JGJ/T 101-2015. The secant stiffness k
j is calculated using equation (1) [38].
The comparison of stiffness degradation curves of specimens tested is shown in Figure 24.
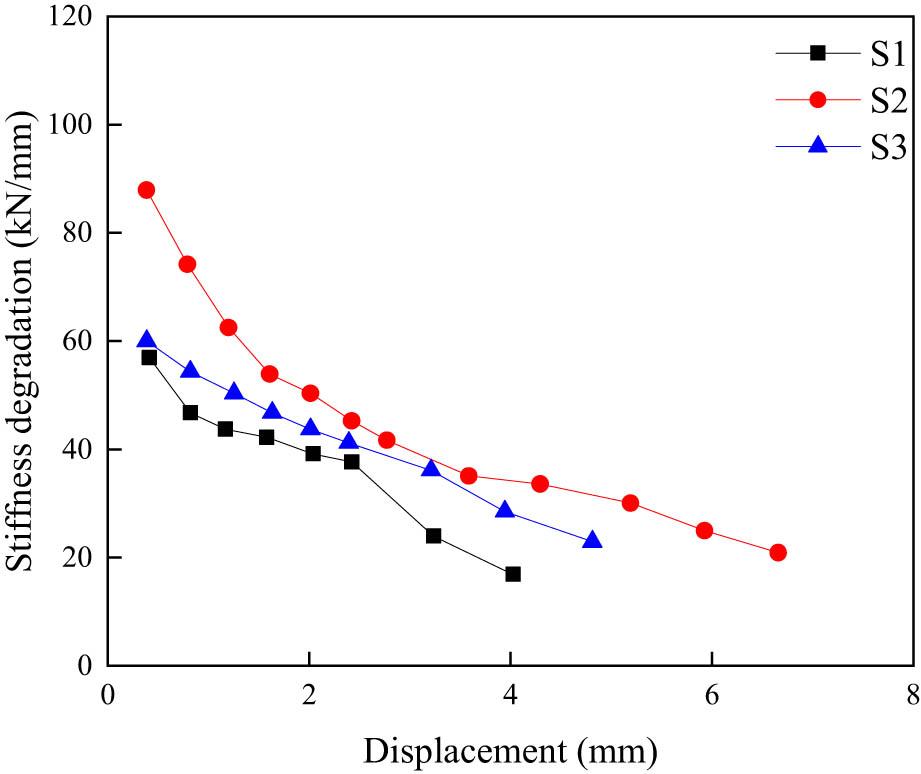
Comparison of stiffness degradation.
From Figure 24, it can be observed that the initial stiffness of the masonry walls strengthened on both sides are greater than that of unstrengthened wall. The stiffness degradation trends for both specimens exhibit certain similarities. During the early stages of loading, the stiffness of the specimens deteriorates rapidly, and the stiffness continues to decrease as loading progresses. And then, a noticeable decline in stiffness is observed for all specimens, with some exhibiting fluctuations in stiffness. These fluctuations may be attributed to unevenness within the specimens caused by the masonry quality, as well as the loosening of anchoring devices such as ground anchors and anchor bolts. The unstrengthened specimen S1 demonstrated a faster loading reduction rate in the later stages, displaying certain brittle characteristics. The strengthened specimens, irrespective of S2 with steel mesh-ECC layer or S3 with steel mesh-mortar layer, exhibit high stiffness, compared with unstrengthened specimen S1.
Ductility is a key index of seismic performance, referring to a specimen’s ability to resist plastic deformation after yielding. According to the “Specification for seismic test of buildings” JGJ/T 101-2015, the ultimate load and displacement of a specimen are defined as those corresponding to the point at which the horizontal load drops to 85% of the peak load. In this experiment, the displacement ductility coefficient is used to evaluate the ductility performance of the specimens, and it is calculated using equation (2) [39].
As the yield point of the masonry specimens is not clearly identifiable, several commonly used methods are considered for its determination, including the general moment-curvature method, the energy equivalent method, and the R. Park method [40]. As shown in Figure 25, the energy equivalent method determines the yield point by drawing a straight line from the origin that intersects the envelope curve at point c. A horizontal line is then extended from the peak of the envelope curve to intersect the initial line at point b, such that the area of triangle abc is equal to the area under the curve between the origin and point c. Finally, a vertical line is drawn from point b to intersect the envelope curve at point d, which is defined as the yield point.
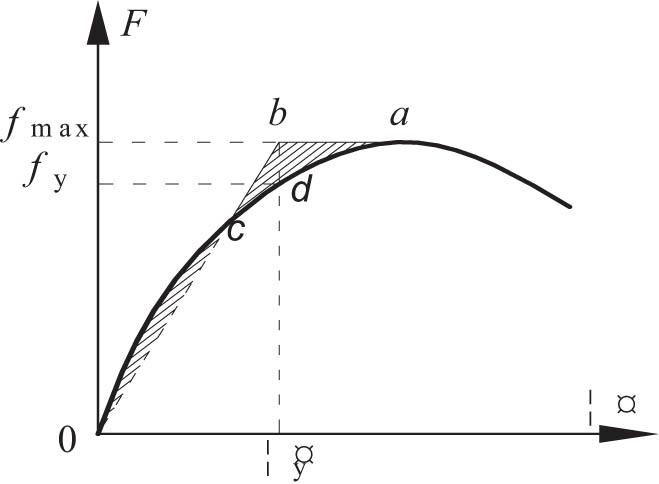
Energy equivalent method.
The comparison of the characteristic load and corresponding displacement and ductility is shown in Table 9.
Comparison of characteristic load, displacement, and ductility.
| Specimen | Loading direction | σ s/kN | Δ y/mm | σ p/kN | Δ p/mm | σ u/kN | Δ u/mm | μ |
|---|---|---|---|---|---|---|---|---|
| S1 | Forward | 88.43 | 2.09 | 97.32 | 2.39 | 82.79 | 3.14 | 1.51 |
| Downward | −74.46 | −2.16 | −82.39 | −2.38 | −70.01 | −3.25 | 1.50 | |
| Averages | 81.45 | 2.13 | 89.86 | 2.39 | 76.40 | 3.19 | 1.51 | |
| S2 | Forward | 115.06 | 3.01 | 145.18 | 5.14 | 123.40 | 6.79 | 2.26 |
| Downward | −116.81 | −3.05 | −142.63 | −5.16 | 121.23 | −6.77 | 2.22 | |
| Averages | 115.94 | 3.04 | 143.93 | 5.15 | 122.32 | 6.78 | 2.24 | |
| S3 | Forward | 109.81 | 2.65 | 117.51 | 3.22 | 111.52 | 4.80 | 1.81 |
| Downward | −89.29 | −2.34 | −107.83 | −3.19 | −105.32 | −4.79 | 2.04 | |
| Averages | 99.55 | 2.50 | 112.67 | 3.21 | 108.42 | 4.80 | 1.93 |
In Table 9, σ s, Δ y, σ p, Δ p, σ u, and Δ u represent the yield load, yield displacement, peak load, peak displacement, ultimate load, and ultimate displacement, respectively.
Table 9 shows that both the bearing capacity and ductility of the strengthened masonry walls were significantly improved. Specifically, the peak load, yield load, and ductility of specimen S2 strengthened with the steel mesh-ECC layer increased by 60.17%, 42.34%, and 48.34%, respectively, compared with specimen S1, and by 27.74%, 16.46%, and 16.06%, respectively, compared with specimen S3 strengthened with the steel mesh-mortar layer. The steel mesh-ECC strengthening method effectively enhances the deformation capacity of the walls, resulting in wider and more stable hysteresis loops, improved energy dissipation, and better seismic performance.
The observed failure modes provide further insight into these improvements. Specimen S1, the unstrengthened wall, experienced diagonal shear failure, characterized by pronounced cracking along the diagonal and sudden localized collapse. In contrast, both S2 and S3 specimens, strengthened with steel mesh-ECC and steel mesh-mortar, respectively, exhibited flexural failure. Among them, the S2 specimen with the ECC overlay showed multiple fine distributed cracks and delayed localized damage, reflecting a more ductile behavior. The S3 specimen strengthened with the mortar layer experienced earlier crack localization and partial debonding, indicating lower ductility compared to S2.
These observations align with previous numerical studies showing that masonry walls retrofitted with ECC display higher ductility factors than unreinforced walls, allowing larger inelastic deformations under cyclic loading and improved energy dissipation [41]. The enhanced ductility and controlled failure modes of ECC-strengthened walls can mitigate sudden brittle collapse and improve structural resilience during seismic events.
For low cyclic reversed loading test, the area enclosed by the hysteresis loop at each loading level represents the energy dissipated by the specimen. Therefore, the fuller the hysteresis loop, the more energy is dissipated, resulting in better seismic performance. This study uses the equivalent viscous damping coefficient ζ to assess the energy dissipation capacity of the specimens. The equivalent viscous damping coefficient ζ is calculated by equation (3) [42], with the calculation diagram shown in Figure 26.
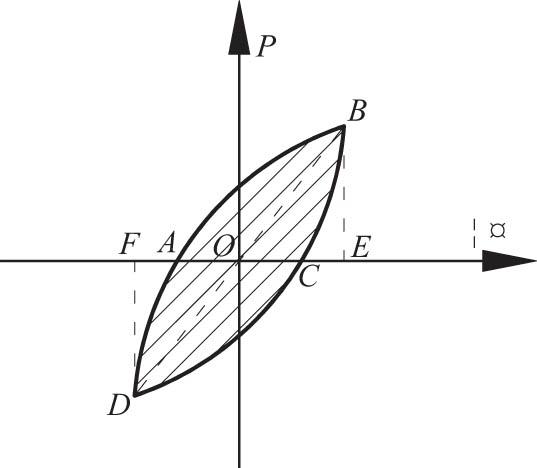
Schematic diagram of equivalent viscous damping factor calculation.
In Figure 26, ABCD represents the hysteresis loop formed under a single cyclic load. Points E and F are the points where the perpendiculars from the limit points on both sides of the hysteresis loop intersect the x-axis. In the equation, S ABC + S ACD represents the area of one hysteresis loop.
The energy dissipation for each loading level is calculated based on the area of the hysteresis loop during the first loading cycle at each level. The energy dissipation at each level is then accumulated to determine the total cumulative energy dissipation throughout the loading process. Figure 27(a–c) shows comparison of the equivalent viscous damping coefficient, cumulative energy dissipation, and total cumulative energy dissipation for specimens tested.
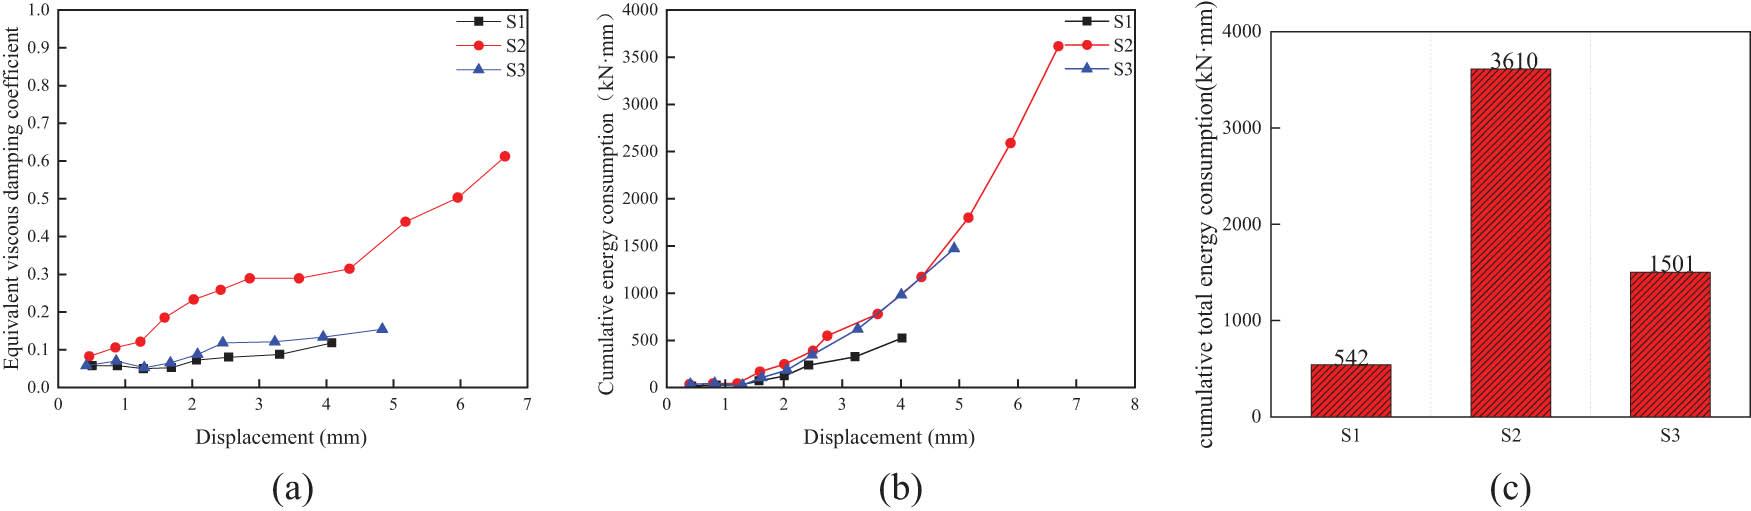
Comparison of energy dissipation capacity. (a) Equivalent viscous damping coefficient. (b) Cumulative energy dissipation. (c) Cumulative total energy dissipation.
Figure 27 indicates that the equivalent viscous damping coefficient increases with the displacement amplitude, suggesting an enhancement in the energy dissipation capacity of the masonry walls. The cumulative energy dissipation of the specimens with double-sided strengthening is consistently higher than that of the unstrengthened specimen. Specifically, the total cumulative energy dissipation of specimen S2 is 5.66 and 1.41 times that of specimens S1 and S3, respectively, demonstrating the markedly superior energy dissipation capacity provided by the steel mesh-ECC strengthening system.
Low reserved cyclic loading tests were conducted on masonry walls strengthened with a steel mesh-sprayed ECC system. A comparative analysis of the hysteresis curves and skeleton curves of the specimens led to the following conclusions:
-
1)
Sprayed ECC exhibits excellent workability and interfacial bonding performance, effectively increasing the cracking load of masonry walls. In addition, it provides favorable post-cracking ductility, indicating that it satisfies the mechanical and constructability requirements for practical strengthening applications.
-
2)
Masonry wall specimens strengthened with surface layers exhibited fuller hysteresis loops and a more gradual stiffness degradation. Both the equivalent viscous damping coefficient and cumulative energy dissipation capacity were significantly enhanced at all displacement levels. These results demonstrate that the proposed strengthening technique can effectively improve deformation capacity and key seismic performance indicators, thereby enhancing the overall seismic resilience of masonry walls.
-
3)
Compared with the unstrengthened specimen, specimens S2 exhibited increases in peak load, ductility coefficient, yield load, and cumulative energy dissipation of 60.17%, 48.34%, 42.34%, and 5.66 times, respectively, while specimens S3 exhibited 25.38%, 27.81%, 22.22%, and 1.77 times, respectively.
-
4)
Compared with conventional steel mesh-mortar strengthening, the steel mesh-ECC system exhibited superior seismic enhancement performance. The peak load, ductility coefficient, yield load, and cumulative energy dissipation of specimen S2 were 27.74%, 16.06%, 16.46%, and 1.41 times higher than those of specimen S3, respectively. The ECC-based system achieved substantially higher improvements, highlighting its greater potential for application in seismic retrofitting practice.
The authors would like to acknowledge financial support from the Fundamental Research Funds for the Central Universities, the Open Project of the Key Laboratory of Concrete and Prestressed Concrete Structures of Ministry of Education-Southeast University, the Yangzhou Science and Technology Project (YZ2025240, YZ2025096), the Yangzhou City Construction System Science and Technology Project (202507, 2025ZD03), Jiangsu Province “333 Project” Scientific Research Funding Program (BRA2020241), Suqian Sci&Tech Program (KJJ202400290), Suqian City Thousand Outstanding Talents Training Program (Second-Level Training Project), Open Fund of Jiangsu Province Prefabricated Construction and Smart Building Engineering Research Center.
This work was supported by the High-End Foreign Experts Project of the Ministry of Science and Technology of China (G2025L); the Fundamental Research Funds for the Central Universities; the Open Project of the Key Laboratory of Concrete and Prestressed Concrete Structures, Ministry of Education, Southeast University; the Yangzhou Construction System Science and Technology Project (202507, 2025ZD03); the Yangzhou Science and Technology Project (YZ2025240, YZ2025096); the Jiangsu Province 333 Project Scientific Research Funding Program (BRA2020241); the Suqian Science and Technology Support Program (H202412); and the Suqian City Thousand Outstanding Talents Training Program (Second-Level Training Project).
Conceptualization: Zeqing Wan, Wenjie Ge; Methodology: Juntao Chen; Validation: Juntao Chen, Rui Zhang; Investigation: Juntao Chen, Rui Zhang; Resources: Yi Wang, Chuanzhi Sun; Data Curation: Juntao Chen; Writing – Original Draft: Juntao Chen; Writing – Review & Editing: Zeqing Wan, Wenjie Ge; Supervision: Zeqing Wan; Funding Acquisition: Yuexiang Hu, Shenfeng Yuang.
The authors declare that they have no known competing financial interests or personal relationships that could have appeared to influence the work reported in this article.
All data, models, or codes that support the findings of this study are available from the corresponding author upon reasonable request.