
The number of reinforced concrete (RC) structures that require rehabilitation or strengthening has increased as a result of the global expansion of infrastructure, aimed at reducing the risk of failure. Reasons behind the deficiency of RC structures are corrosion in reinforcement [1]; design error; earthquake; error in detailing; construction defects [2]; increase in loads; aging of structures [3]; inadequate maintenance; design standard upgrading; and poor concrete properties [4]. In such cases, the structure is to be rehabilitated or demolished. In the case of rehabilitation, the structure is to address inadequate capacity and be retrofitted. Strengthening as an option is found to be an effective and economical solution in comparison to demolishing and reconstruction [5].
RC members constructed with low-strength concrete (LSC) are considered dangerous, requiring reinforcement using appropriate materials and techniques [6]. Anil [7] studied RC T-beams made with LSC to evaluate their behavior when strengthened with carbon fiber reinforced polymer (CFRP) under cyclic loading. The author found that CFRP sheets significantly improved shear capacity, stiffness, and energy dissipation compared to the unstrengthened beam. It was also noted that the configuration of the CFRP influenced the failure mode, particularly regarding debonding. Overall, the study showed that CFRP strengthening is an effective method for enhancing the cyclic performance of LSC beams. Dias and Barros [8] tested LSC T-beams strengthened in shear using near surface mounted CFRP laminates. They found that properly anchored, inclined, and closely spaced CFRP strips significantly improve shear capacity and stiffness, reducing the risk of premature debonding. Confrere et al. [9] tested LSC beams reinforced with fiber-reinforced polymer (FRP) bars to see how they bend and deflect. They found that while design codes (like ACI 440.1R and CSA S806) do a decent job predicting the bending (moment) capacity, they significantly underestimate how much the beams will deflect, especially under service loads. Their experiments and analytical simulations showed that deflection, not strength, is more likely to limit these FRP-reinforced, LSC beams. In short, using FRP bars in weaker concrete helps avoid corrosion, but controlling deflection becomes a bigger challenge than ensuring ultimate strength. Guo et al. [10] tested seven low-strength RC beams, strengthening six with FRP grid embedded in engineered cementitious composite (ECC). They found that the FRP‑ECC layer improved shear capacity, but adding a second FRP layer did not help due to premature debonding. They also proposed a formula to predict the angle of critical cracks. Throughout the twentieth century, various traditional techniques, including jacketing using concrete or steel plates, were employed to strengthen RC structures [11]. Strengthening involves either wrapping damaged structural elements (jacketing) using RC or steel plates to restore the strengthened structural elements to specified performance before any occurrence of damage (rehabilitation), or enhancing their performance beyond their original capacity (strengthening). However, concrete jacketing disadvantage is increased dimensions and weight, whereas steel jacketing faces challenges like inner surface corrosion and handling difficulty [12].
Ersoy [13] highlighted practical methods for repairing and strengthening RC structures after earthquakes, such as concrete or steel jacketing and adding infill walls, emphasizing cost-effective retrofits that improve strength, stiffness, and ductility while ensuring good bond with existing concrete. Belarbi and Acun [14] reviewed FRP systems for shear strengthening of RC structures, noting that although FRPs are lightweight and strong, there is still limited experimental and analytical work in shear. They pointed out the lack of unified design guidelines, examined existing specifications, and proposed areas that need further research to develop more reliable design provisions. Abo‑Alanwar and Elbatal [15] tested a U‑shaped steel wire mesh jacketing technique for RC beams, which significantly improved flexural and shear strength, increased load capacity up to 136%, and reduced deflection, even in preloaded beams. Over the last four decades, a new material called FRP has been utilized as a viable option for structural strengthening [16]. FRP fabrics and laminates have gained prominence in strengthening RC structures due to the development of high-tensile structural adhesives [17]. Saribiyik and Caglar tested LSC RC beams and strengthened them using either CFRP or glass fiber reinforced polymer (GFRP) wraps. They found that while CFRP gave the highest flexural and shear strength, GFRP produced much better ductility and energy absorption. In other words, CFRP boosts strength more, but GFRP makes the beam behave more flexibly and safely [18]. Remennikov et al. [19] studied the impact behavior of RC beams strengthened externally with carbon FRP sheets. In their experiments, they compared unstrengthened control beams with beams that had either U-shaped or fully wrapped CFRP layers (single or double). Under impact loading (using a drop hammer), the CFRP-strengthened beams showed much better resistance, absorbing more energy, reducing deflection, and delaying failure compared to control beams. Huo et al. [20] found that CFRP strengthening significantly improves the impact resistance of RC beams without stirrups, reducing deflection and delaying shear failure near midspan and supports. In comparison to steel plates, FRP has become the preferred material for strengthening RC structures globally [21].
Flexural failure occurs when the ultimate flexural capacity is reached, due to CFRP rupture or concrete crushing, as presented. Separation of concrete cover (concrete rip-off failure) is the most common debonding failure recorded in experimental studies, often initiating at one of the ends of the soffit plate. In general, this type of failure occurs before the section reaches ultimate flexural capacity. Another less common failure is debonding CFRP from the RC beam soffit [22]. The aim of this study is to comprehensively examine the practical and theoretical behavior of RC beams with LSC after being strengthened with FRP materials employing different schemes. While many studies have considered strengthening RC beams with normal-strength concrete 25 MPa or above, few have investigated flexural behaviors under different schemes.
As mentioned above, this study investigates the effects of CFRP on the structural behavior of LSC. Thus, several trial mixes were conducted to cast 17 MPa concrete. Then, 16 RC beams with dimensions of 2,200 mm × 200 mm × 150 mm were constructed with 17 MPa concrete. 3 m3 of concrete was batched to the laboratory via a mixer truck. The properties of concrete are listed in Table 1. The RC beams were designed to fail in a flexural manner, using a design based on the ACI-318-19 standard, and the predicted ultimate shear and flexural capacity loads were 147 and 46.9 kN, respectively. In this case, when the RC beam is subjected to a load gradually, the RC beam would fail in flexural, as the flexural capacity of the section is lower than the shear capacity. The section was reinforced with 2Ø12 mm bars at the bottom and 2Ø10 mm bars as longitudinal reinforcement. Shear reinforcement bars were Ø8 mm @ 150 mm c/c. Concrete cover was maintained at 25 mm along the entire beam, as presented in Figure 1.
Mechanical properties of LSC.
| () MPa | (f t) MPa | (f r) MPa | (E) GPa | Poisson’s ratio | Slump test (mm) | Velocity based on UPV test mm/μ s | Density (kg/m3) | |
|---|---|---|---|---|---|---|---|---|
| LSC | 17.3 | 2.38 | 3.59 | 21.36 | 0.172 | 65 | 4.25 | 2,246 |
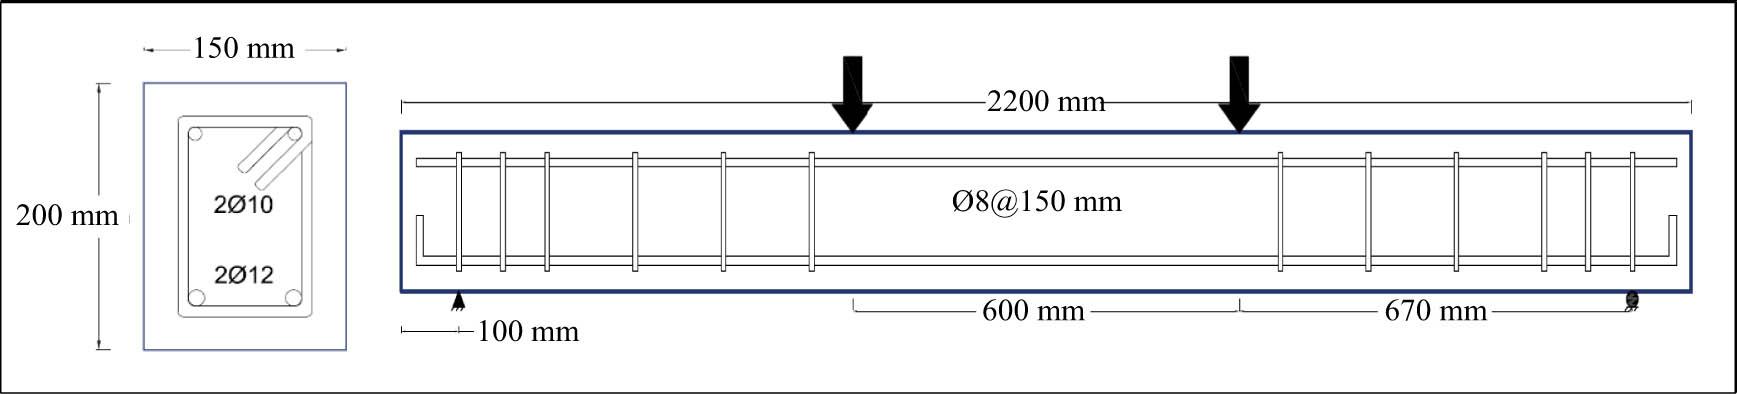
RC beam detailing.
In this research, two types of CFRP were used: unidirectional CFRP fabric and CFRP laminate. Both types were tested according to ASTM D3039M [23]. Testing coupons went through several stages, including cutting the CFRP matrix into strips. The fabric CFRP coupons were fabricated by a wet lay-up application using Sikadur-330 epoxy adhesive. Steel plates with (50 × 50 × 3) mm dimensions were fabricated to form the required grips for tensile testing of CFRP coupons. The grips were bonded to each coupon on both sides. Moreover, to get precise results, two strain gauges were attached to each coupon (CFRP laminate and CFRP fabric) to evaluate strain and Poisson’s ratio while testing. A total of 12 coupons were fabricated for each of the CFRP fabric and CFRP laminate coupons. The coupons were 250 mm in length and 50 mm in width, with a clear span of 150 mm between the grips. Testing was conducted at a load rate of 2 mm/min, following the guidelines of ASTM D3039M [23]. The CFRP curing process was carried out for 7 days at 26°C in the laboratory environment, as recommended by the Sika manufacturer. Figure 2 illustrates a schematic view of a CFRP coupon testing. Furthermore, the material properties for the carbon fiber (single fiber) used in this research were provided by the manufacturer (Sika) for both types of CFRP fabric and CFRP laminate (Table 2). These results were compared to the experimental findings. Although the fabricated coupons are matrixed, in contrast to the single fiber provided by the manufacturer.
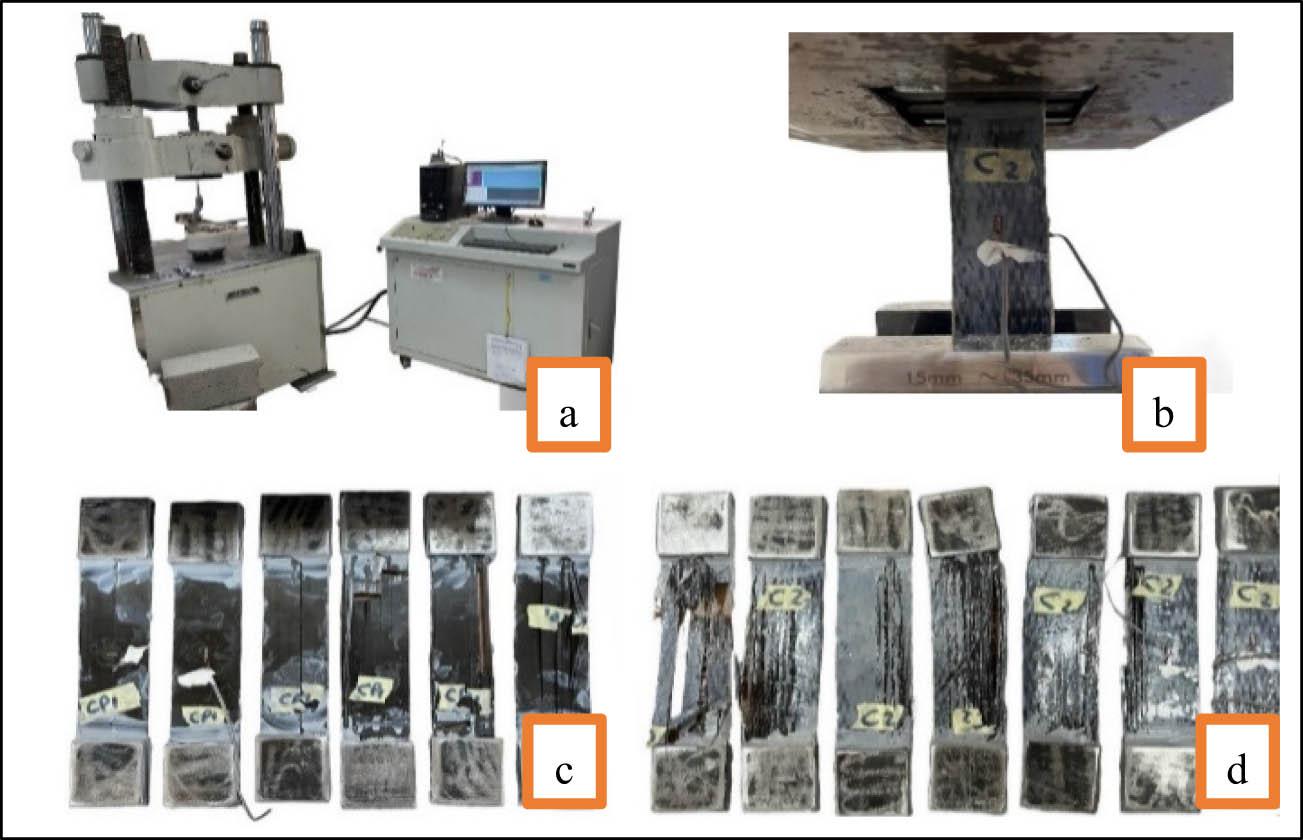
CFRP coupon testing: (a) universal machine test; (b) coupon under testing; (c) laminate CFRP coupons failure; and (d) fabric CFRP coupons failure.
Material properties of CFRP fabric and CFRP laminate provided by the manufacturer.
| Characteristics | Manufacturer data | |
|---|---|---|
| CFRP fabric | CFRP laminate | |
| Ultimate tensile strength (MPa) | 4,000 | 3,100 |
| Fiber modulus (GPa) | 230 | 170 |
| Ultimate tensile elongation (%) | 1.7 | 1.8 |
| Thickness (mm) | 0.167 | 1.4 |
| Fiber density (g/cm3) | 1.82 | 1.6 |
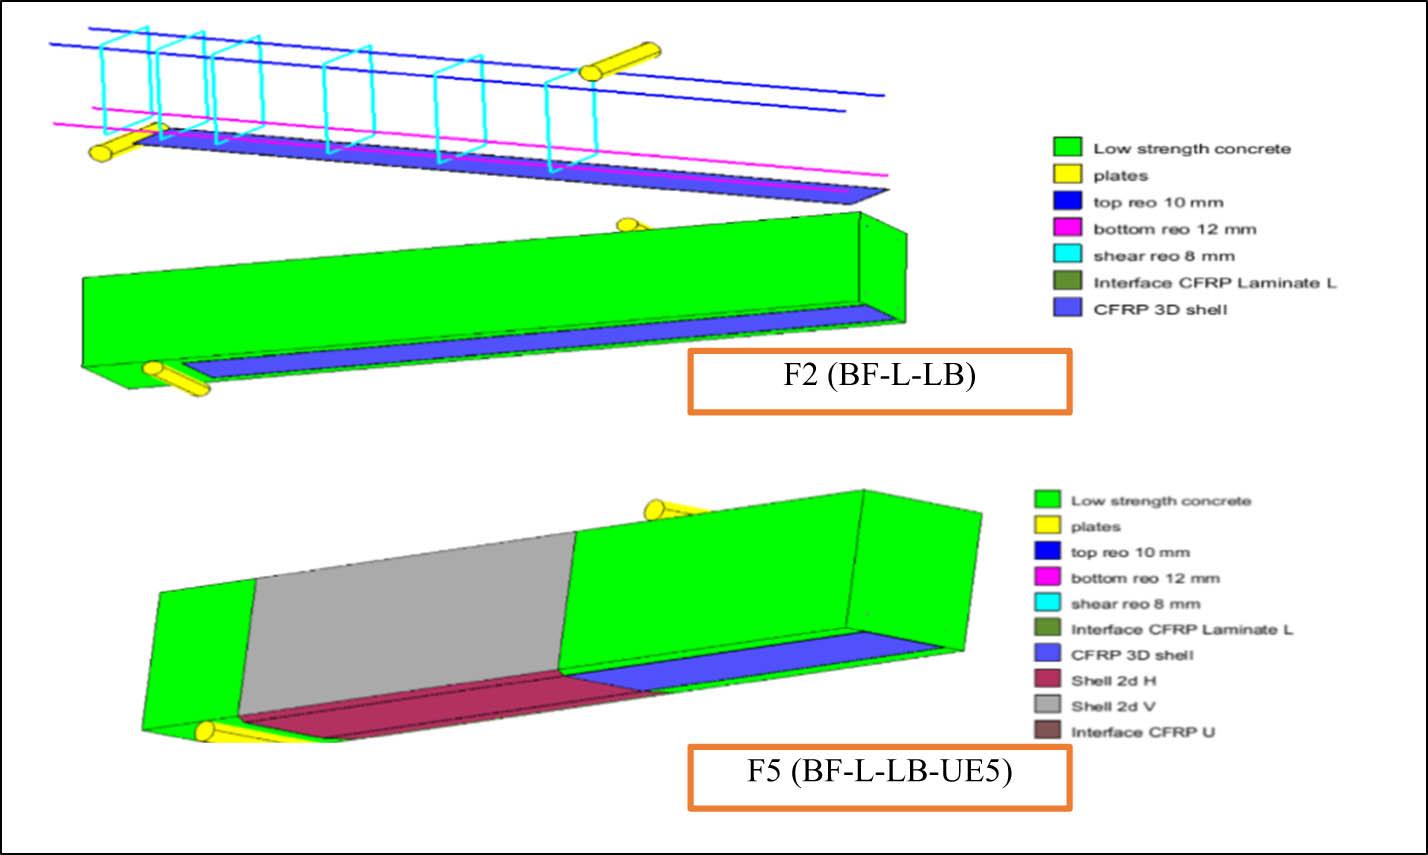
Two beams served as control specimens (BF-L), only one representative sample was presented in this work. Seven RC beams were strengthened in flexure using CFRP composite (Figure 3). The first application was adding a layer of CFRP laminate with a 100 mm width at the bottom of the RC beam (BF-L-LB). The second scheme was adding a two-layer CFRP sheet with 100 mm in width placed at the bottom of the RC beam (BF-L-SB-2). The third scheme was a layer of CFRP laminate with a 100 mm width placed at the bottom of the RC beam, and provided a U-shaped CFRP sheet at both ends with a 100 mm width to increase the bonding between the CFRP composite and concrete surface (BF-L-LB-UE). The fourth scheme was adding a layer of CFRP laminate with 100 mm in width placed at the bottom of the RC beam and providing a U-shaped CFRP sheet at both ends with 500 mm in width to prevent debonding at the ends and investigate the performance of the thickness of U anchorage (BF-L-LB-UE5). The fifth scheme was adding a layer of CFRP sheet with 100 mm in width at the bottom of the RC beam and providing a U-shaped CFRP sheet at both ends with 100 mm in width to prevent debonding at the ends (BF-L-SB-UE). The sixth scheme was adding two layers of CFRP sheet with 100 mm width at the bottom of the RC beam and providing a U-shaped CFRP sheet at both ends with 100 mm in width to prevent debonding at ends (BF-L-SB-UE2). The seventh scheme was adding a layer of CFRP laminate with 100 mm in width at the bottom of the RC beam and another layer at the top face between the two applied loads, and providing a U-shaped CFRP sheet at both ends with 100 mm in width (BF-L-LBT-UE). Strengthening schemes' objectives are defined in Table 3.
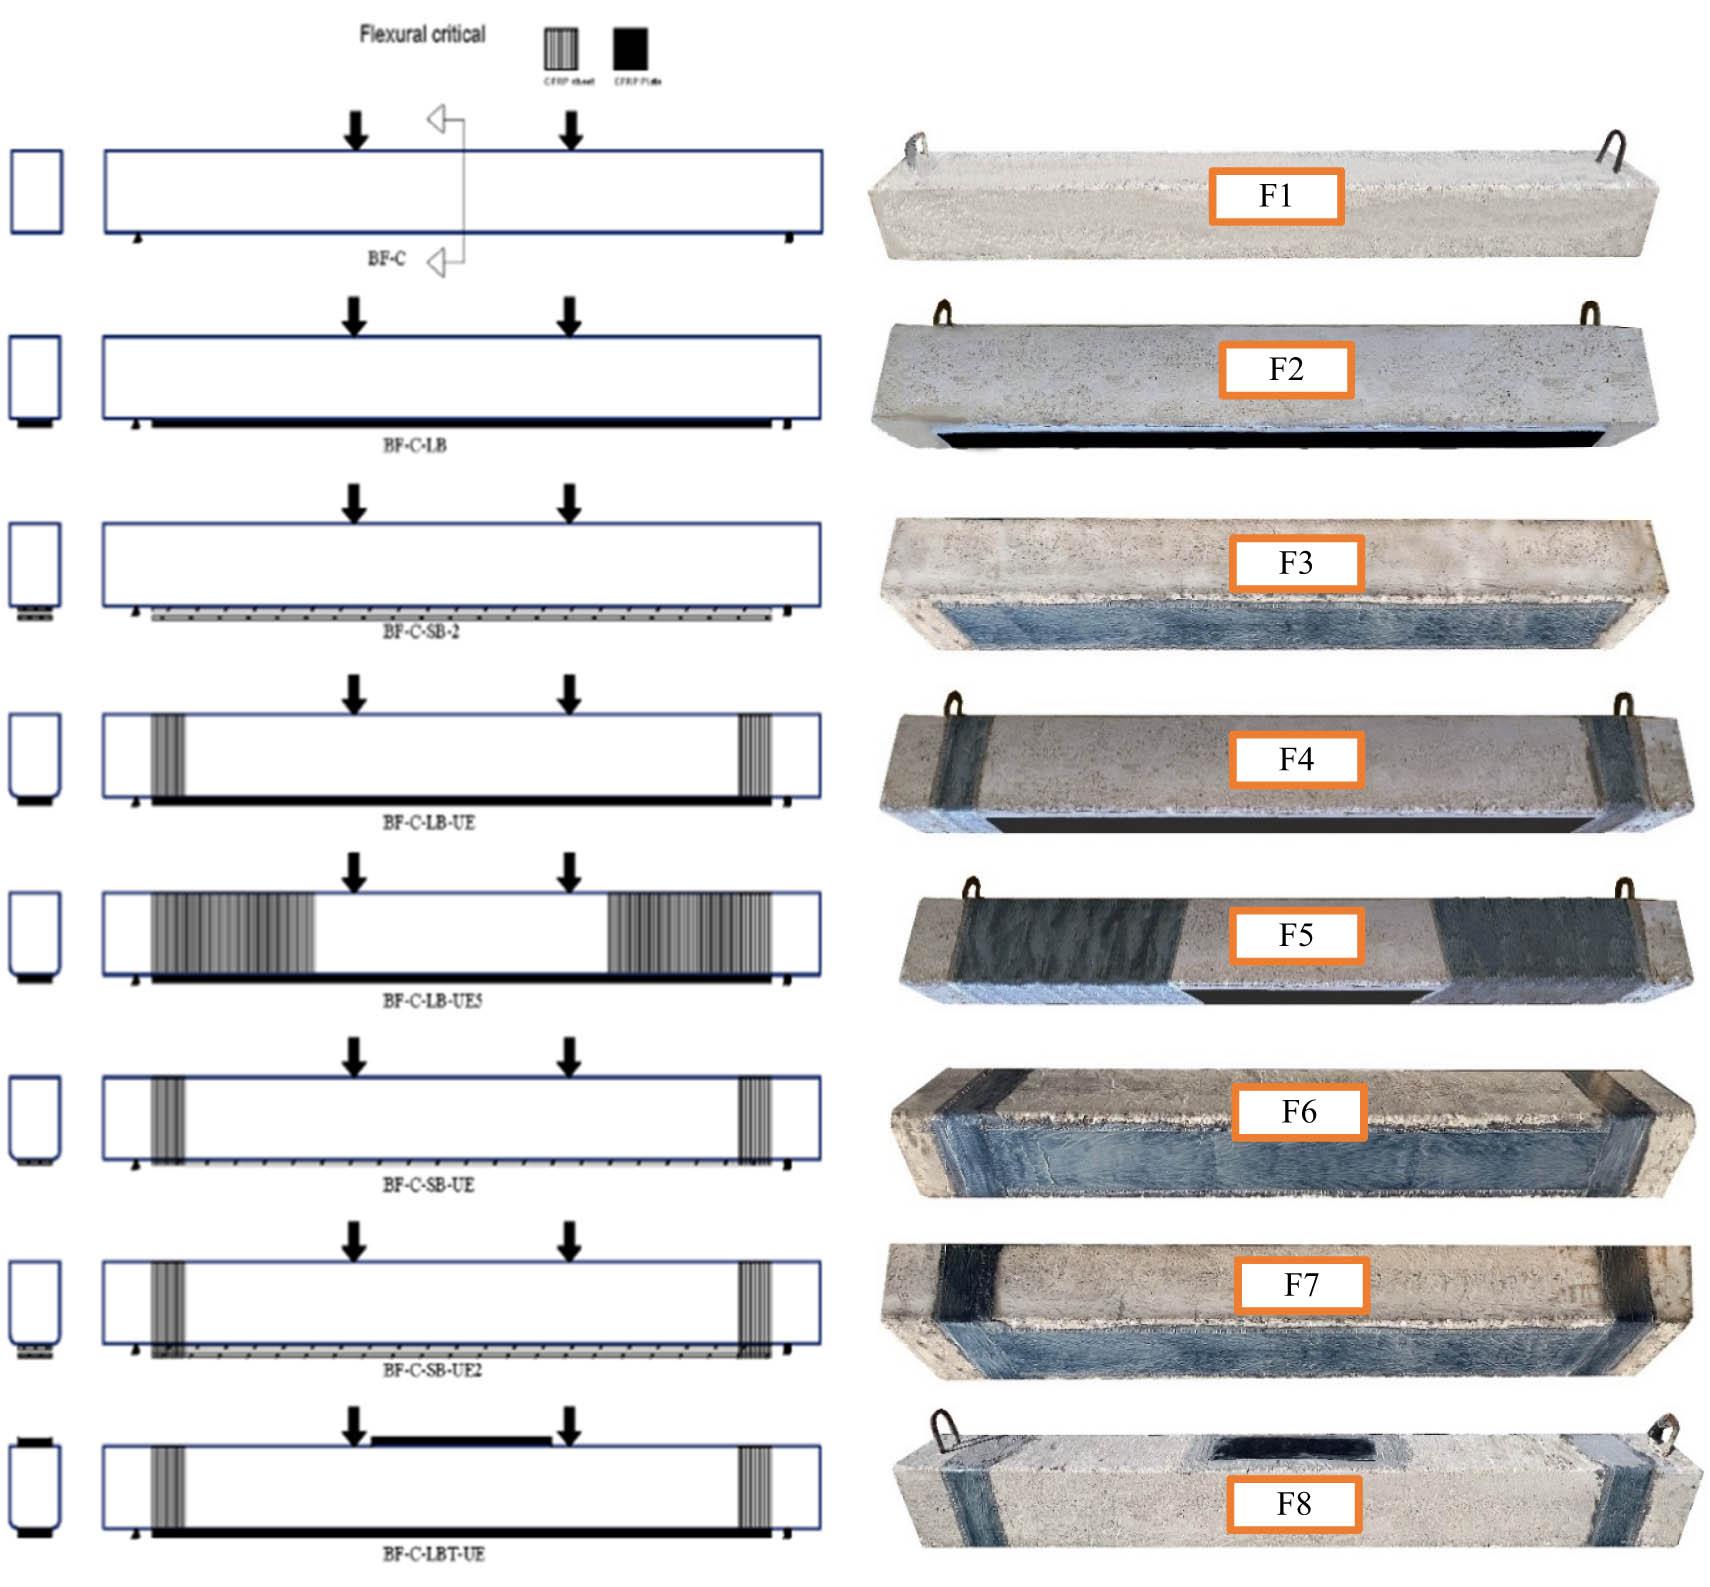
Flexural strengthening program.
Details of strengthened RC beams.
| Label | Beam symbol | FRP material | Scheme | Notes |
|---|---|---|---|---|
| F1 | BF-L | Flexural control beam | ||
| F2 | BF-L-LB | CFRP strip | 1-layer 100 mm | Bottom soffit |
| F3 | BF-L-SB-2 | CFRP sheet | 2-layer 100 mm | Bottom soffit |
| F4 | BF-L-LB-UE | CFRP strip/sheet | 1-layer 100 mm/1-layer 100 mm at both ends | Bottom soffit/U-wrapped only ends |
| F5 | BF-L-LB-UE5 | CFRP strip/sheet | 1-layer 100 mm/1-layer 500 mm at both ends | Bottom soffit/U-wrapped only ends |
| F6 | BF-L-SB-UE | CFRP sheet/sheet | 1-layer 100 mm/1-layer 100 mm at both ends | Bottom soffit/U-wrapped only ends |
| F7 | BF-L-SB-UE2 | CFRP sheet/sheet | 2-layer 100 mm/1-layer 100 mm at both ends | Bottom soffit/U-wrapped only ends |
| F8 | BF-L-LBT-UE | CFRP sheet/strip | 1-layer 100 mm/1-layer 100 mm/1 layer at both ends | Bottom soffit/top soffit center compression/U-wrapped only ends |
The selection of CFRP widths and anchorage lengths followed established guidelines and prior experimental findings to ensure adequate load transfer and prevent premature debonding. Recommendations from ACI 440.2R-17 (ACI Committee 440, 2017) [24] and fib Bulletin No. 14 (fib, 2001) [25] were adopted for determining the effective bond length, beyond which additional bonded length provides negligible strength gain. Preliminary bond stress and strain transfer checks confirmed that the chosen CFRP widths adequately cover the tensile zone and that the anchorage lengths exceed the effective bond length estimated by these models. Previous studies (Grelle and Sneed [26]; Li et al. [27]; Anil and Belgin [28]) further supported the role of proper anchorage and U-wrap configurations in enhancing bond performance and delaying debonding.
All the tests were conducted at the College of Engineering lab, Duhok University. Tow-point test loading was performed to load the specimens up to failure. A flexural machine with 400 kN capacity was used. The RC beams were tested under the load control test method at a rate of 0.2 kN/s using a 400 kN flexural testing machine, in which the control RC beam took about 5 min from starting the loading up to failure. A series of 100 mm linear variable differential transformers was used to record the deflection at mid-span, under the loads, and at a distance d from the support. Moreover, strain gauges were used to measure strains at the tension zone at mid-span, the compression zone at mid-span, and at a distance d from the support. Digital image correlation (DIC) technique was also used using a Canon D90 camera to capture the distortion of the RC beam during loading. All RC specimens were painted with white paint on one side to capture the initiation of cracks conveniently while loading. Another side was painted with white and black dots for the DIC test procedure. Cracks were marked on the RC specimens with a pencil while loading, and cracking loads were recorded. A controlling computer with a data logger was used to collect all data from the bonded strain gauges, dial gauges, and load cell. DIC was also used to record the RC specimens while loading, and all recorded data were analyzed using GOM correlate software, and the results were then evaluated by comparing them with the experimental results and numerical models. Figure 4 illustrates the test setup, including the flexural machine, data logger, DIC camera, and tested sample.
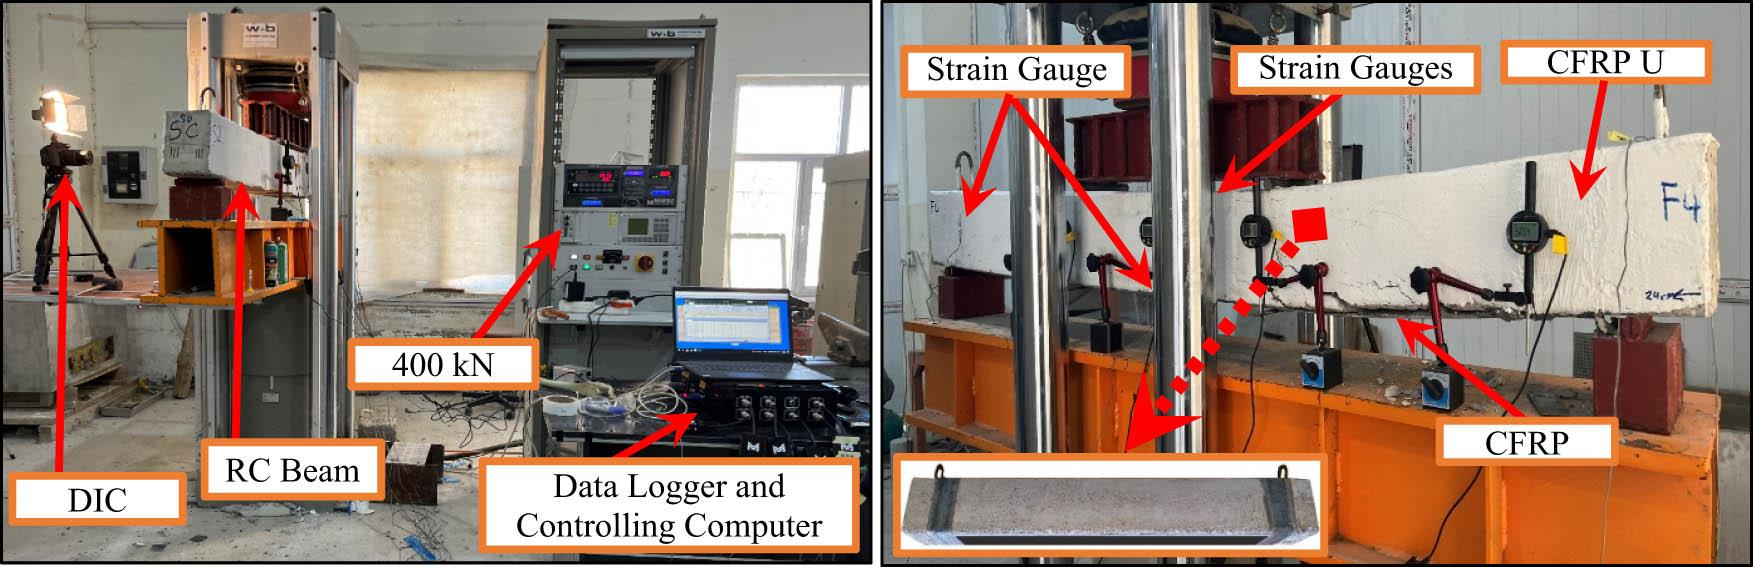
Test set-up.
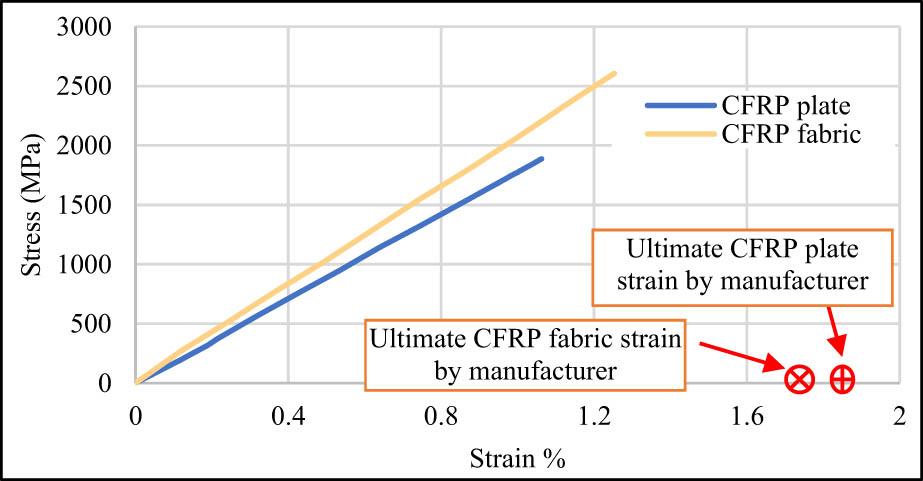
Test results for all the coupons are illustrated in Table 4. Figure 5 shows the linear elastic properties of the CFRP stress–strain curves acquired from the foil strain gauges. According to ASTM D3039/D3039M, the elastic modulus throughout the strain range of 0.001–0.003 was calculated using the CFRP stress-strain response. Numerous studies have discovered that there are differences in strength between the manufacturer's nominal qualities and the properties of materials that were tested as composite material (CFRP and epoxy) [29,30,31,32,33,34,35]. This is because evaluating a single fiber (based on the manufacturer's data) and testing a real-world tensile coupon are two different things. To prevent issues with stress concentrations at the grips and misalignment, as well as to allow for accurate strain readings, this testing must be performed on a composite CFRP and epoxy tensile specimen. Instead of using the thickness of the coupon, the maximum tensile stress and elastic modulus are based on the thickness of the fiber (i.e., epoxy plus fiber) [36].
CFRP composite material properties.
| Coupon | Ave. width (mm) | Ave. thick. (mm)a | Max load (kN) | Max tensile stress (MPa) | Max tensile strain | Modulus of elasticity (GPa) | Poisson’s ratio |
|---|---|---|---|---|---|---|---|
| CFRP sheet (0.167 mm/ply) | |||||||
| 1 | 50.1 | 0.71 | 21 | 2,560 | 0.0122 | 209.8 | — |
| 2 | 50.3 | 0.73 | 21 | 2,530 | 0.0121 | 209.1 | — |
| 3 | 50.5 | 0.78 | 23 | 2,700 | 0.0131 | 206.1 | — |
| 4 | 50.0 | 0.82 | 22 | 2,606 | 0.0125 | 208.5 | 0.28 |
| 5 | 50.8 | 0.88 | 23 | 2,690 | 0.0127 | 211.8 | — |
| 6 | 50.1 | 0.90 | 22 | 2,620 | 0.0126 | 207.9 | — |
| Average | 50.3 | 0.80 | 22 | 2,618 | 0.0125 | 208.9 | |
| CFRP laminate (1.4 mm plate thickness) | |||||||
| 1 | 50 | 1.4 | 133 | 1,897 | 0.0114 | 166.4 | — |
| 2 | 50 | 1.4 | 131 | 1,872 | 0.0105 | 178.3 | — |
| 3 | 50 | 1.4 | 127 | 1,808 | 0.0093 | 194.4 | 0.26 |
| 4 | 50 | 1.4 | 134 | 1,908 | 0.0114 | 167.4 | — |
| 5 | 50 | 1.4 | 130 | 1,863 | 0.0103 | 180.9 | — |
| 6 | 50 | 1.4 | 131 | 1,871 | 0.0105 | 178.2 | — |
| Average | 50 | 1.4 | 131 | 1,870 | 0.0106 | 177.6 | — |
aAverage thickness of epoxy + CFRP.
CFRP mechanical properties.
Eight RC beams were tested under a flexural machine test, and the results have been listed and analyzed. The design of the samples ensured that flexural failure would occur before any shear failure. The flexural behavior of the RC beams is summarized in Table 5.
Results of RC beams critical in flexural (F1–F11).
| Beam ID | P cr (kN) | M cr (kN m) | V cr (kN) | Δ cr (mm) | P y (kN) | M y (kN m) | V y (kN) | Δ y (mm) | P u (kN) | P u/P u.control | M u (kN m) | V u (kN) | Δ u (mm) | Failure mode |
|---|---|---|---|---|---|---|---|---|---|---|---|---|---|---|
| F1 | 9 | 3.0 | 4.5 | 0.76 | 48.4 | 16.1 | 24.2 | 6.7 | 51 | — | 17.0 | 25.5 | 16 | Flexural tension failure |
| F2 | 22 | 7.3 | 11.0 | 2.06 | 58.2 | 19.4 | 29.1 | 7 | 73.4 | 43.9% | 24.5 | 36.7 | 10.8 | Concrete cover separation and flexural tension failure |
| F3 | 14 | 4.7 | 7.0 | 1.33 | 46 | 15.3 | 23.0 | 5.9 | 73.4 | 43.9% | 24.5 | 36.7 | 20.1 | CFRP plate debonding and concrete cover separation and flexural tension failure |
| F4 | 12.5 | 12.6 | 4.2 | 0.91 | 67.2 | 67.2 | 22.4 | 6.4 | 76.4 | 62.7% | 27.7 | 41.5 | 17.6 | CFRP plate debonding and flexural tension failure |
| F5 | 23 | 7.7 | 11.5 | 1.9 | 104 | 34.7 | 52.0 | 7.2 | 111.8 | 119.2% | 37.3 | 55.9 | 18.6 | CFRP plate debonding and flexural tension failure |
| F6 | 16.5 | 5.5 | 8.2 | 1.91 | 60.8 | 20.3 | 30.4 | 11.1 | 71.6 | 40.4% | 23.9 | 35.8 | 30.2 | CFRP plate debonding and flexural tension failure |
| F7 | 22 | 7.6 | 11.4 | 2.69 | 67 | 22.3 | 33.5 | 10.7 | 78.2 | 53.3% | 26.1 | 39.1 | 22.8 | CFRP plate debonding and flexural tension failure |
| F8 | 24 | 8.1 | 12.1 | 2.38 | 60.6 | 20.2 | 30.3 | 6.1 | 72.8 | 42.7% | 24.3 | 36.4 | 11.3 | CFRP plate debonding and flexural tension failure and flexural compression failure |
Eight RC beams were designed to be weak in flexural strength and were cast with LSCO (F1–F8). F1 served as a control sample. F2, F3, F4, F5, F6, F7, and F8 represent strengthened RC beams with different CFRP strengthening schemes. The load–deflection curves were recorded at mid-span with dial gauges as described earlier in the test set-up section. The load–deflection curves at mid-span are presented in Figure 6.
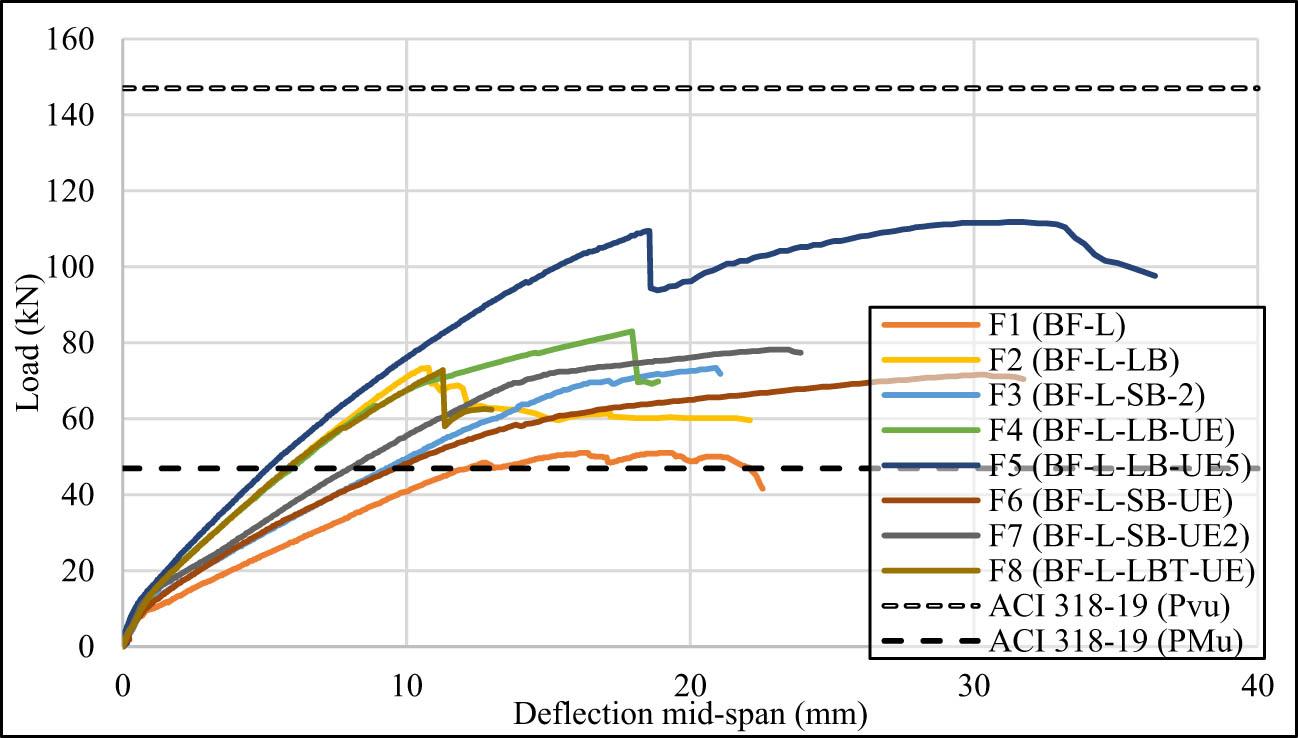
Load–deflection curves.
The load–strain relationships for the steel reinforcement, concrete, and CFRP were recorded at mid-span, with strain gauges positioned along the CFRP strips. Figure 7 presents these relationships, showing that the steel strain increased progressively with the applied load until reaching the ultimate capacity. A comparable trend was observed for the CFRP, indicating that both materials effectively shared the flexural stresses during loading. This similarity in behavior confirms the efficiency of the strengthening system, as the CFRP contributed significantly to resisting tensile strains that would otherwise be concentrated in the steel reinforcement. Moreover, the smooth transfer of strain between the CFRP and steel suggests good bonding performance and adequate composite action, which is essential for achieving the desired flexural enhancement.
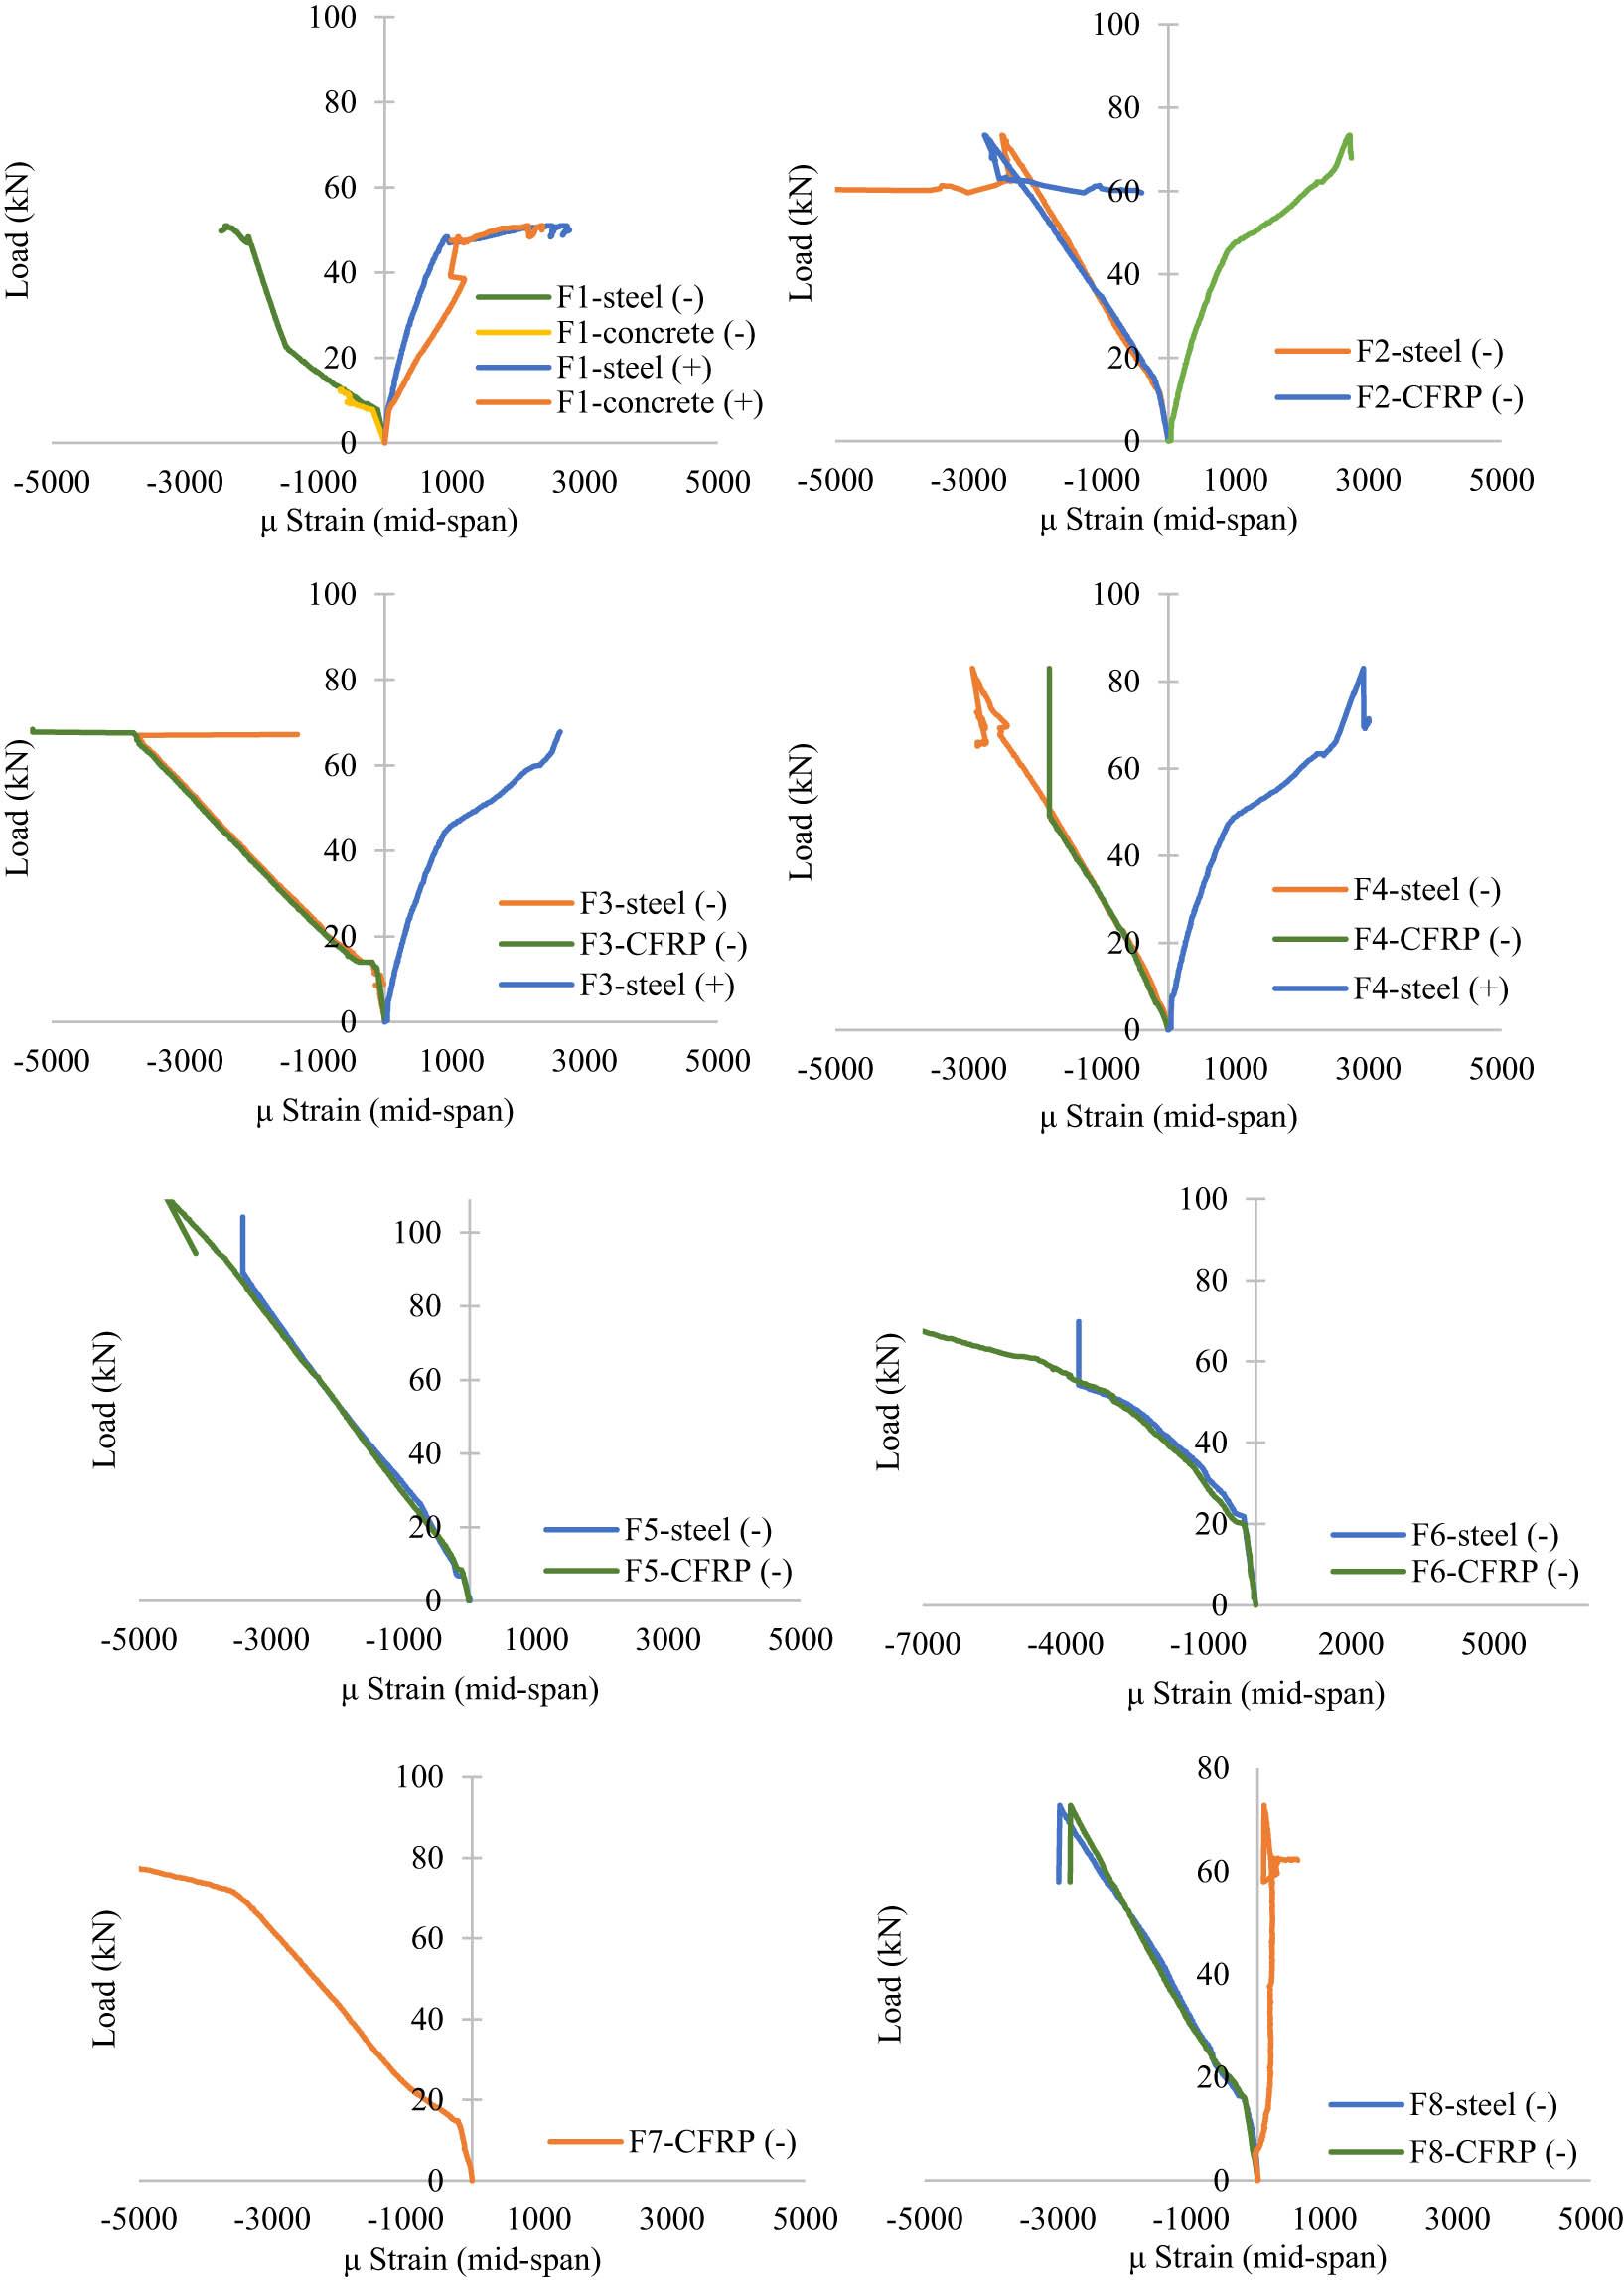
Strain–load relationship at mid-span.
The failure modes of all RC beams critical in flexural are illustrated in Figure 8. The figure demonstrates the crack patterns and associated failure modes observed in the specimens. The figure highlights the main failure mechanisms, the paths and distribution of cracks, and the number of cracks developed under loading. This visual representation helps to better understand the structural response and the progression of damage leading to failure. Control RC beams critical in flexural F1 (BF-L) failed in typical flexural tension failure. Flexural failure happened in a ductile manner, as was supposed by the design. Sample F1 (BF-L) suffered from flexural-compression block failure. Flexural failure, in all RC beams critical in flexural, happened gradually as the flexural stresses were resisted by steel reinforcement, and this led to steel yielding, and ductile failure was observed. This failure mode occurs when the steel reinforcement reaches its yielding point, leading to excessive deflection and potentially compromising the beam's load-carrying capacity.
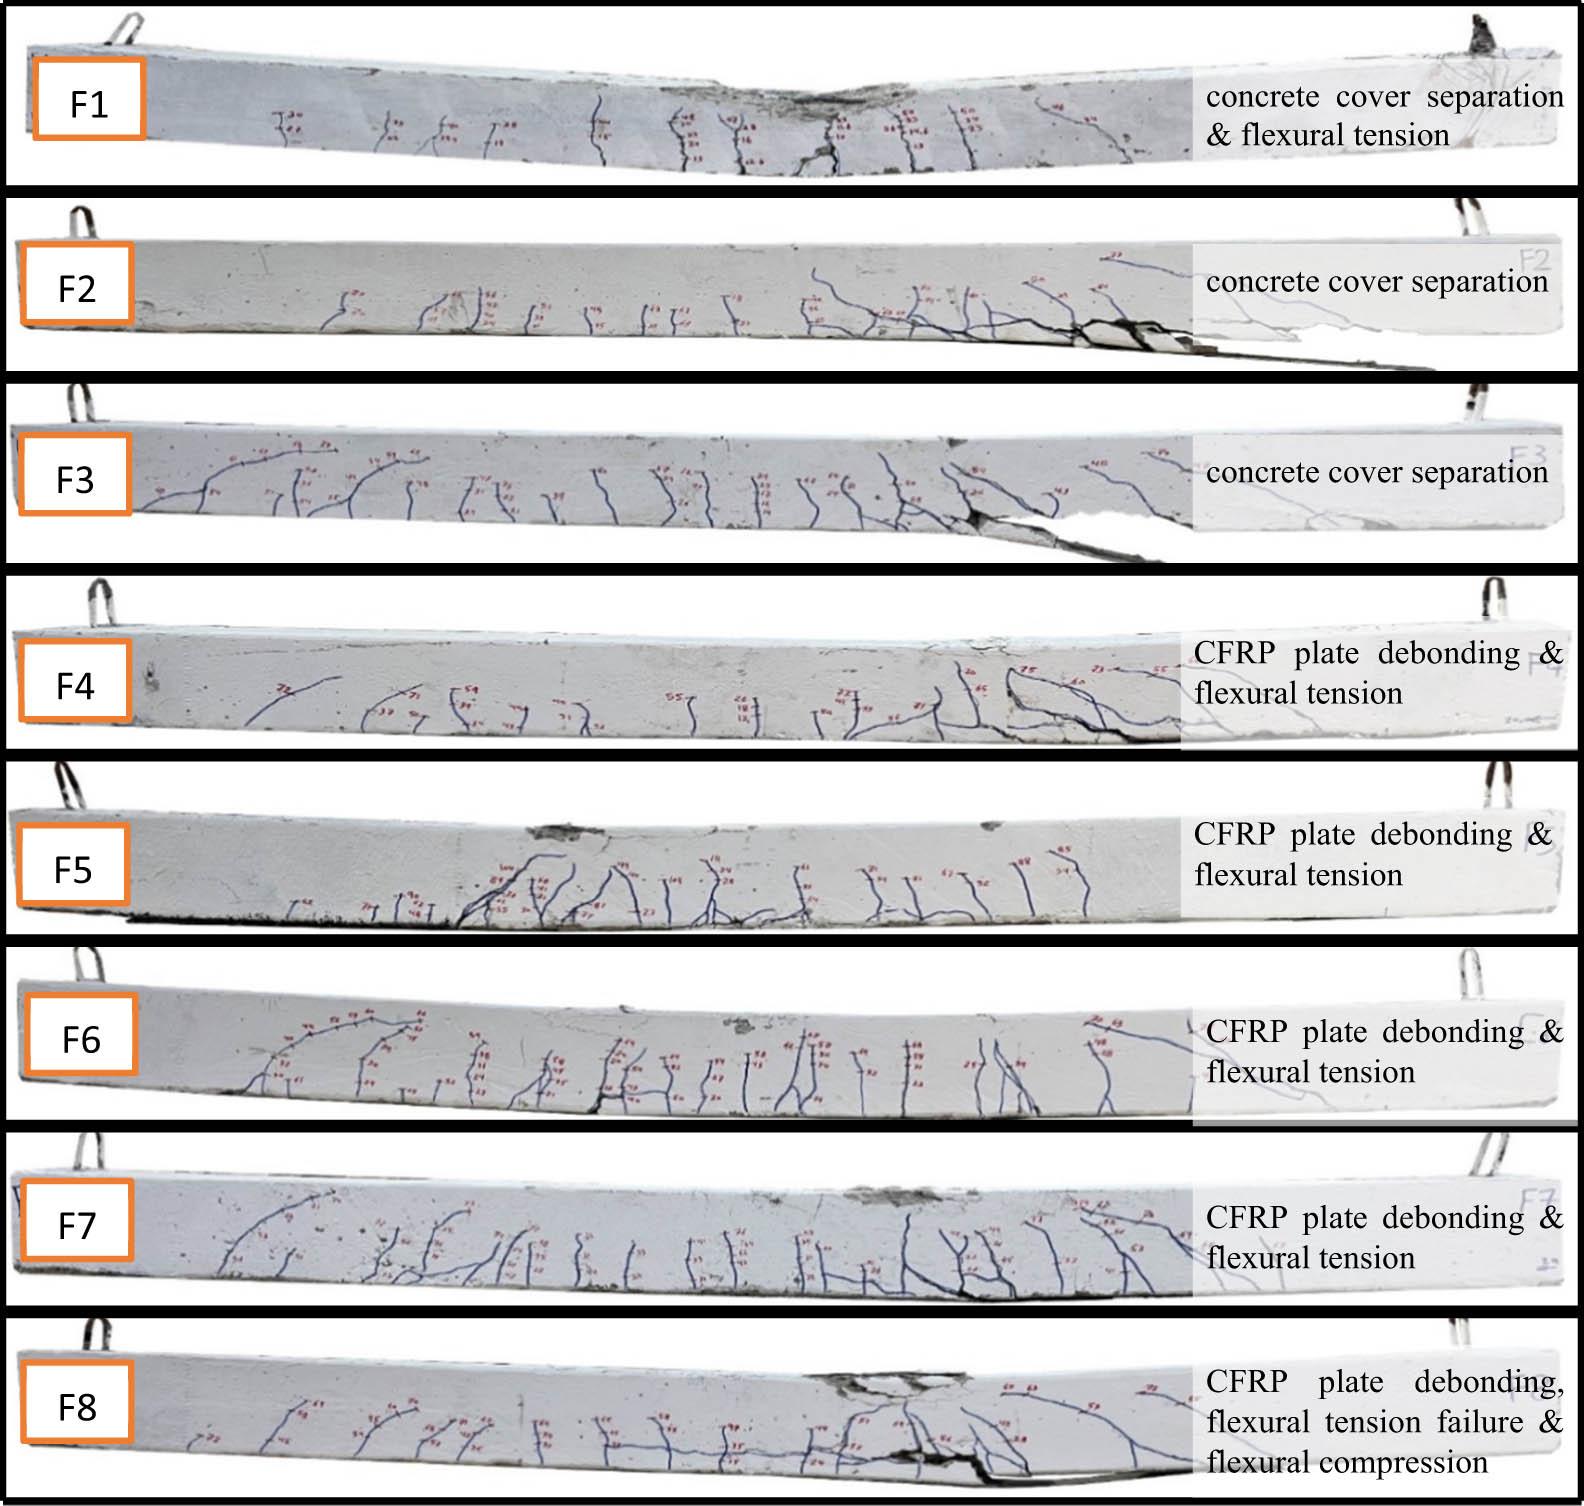
Crack pattern and associated modes of failure.
Flexural failure, in strengthened RC beams, failed due to CFRP debonding or cover separation, which agrees with the common failure mode in CFRP-strengthened RC beams described in detail in Section 3.3.2 [22]. The strengthened RC beams showed excellent performance under applied load in terms of escalating ultimate load and ductility (Table 5).
DIC testing is used, as described earlier in Section 3.2.9, to measure deflection and strain at mid-span. Recorded data were analyzed using GOM Correlate software. Figure 9-a1 presents the first crack initiation when the load reached 11 kN in sample F1 (BF-L), while Figure 9-a2 illustrates crack widening at the ultimate load when the load reached 51 kN.
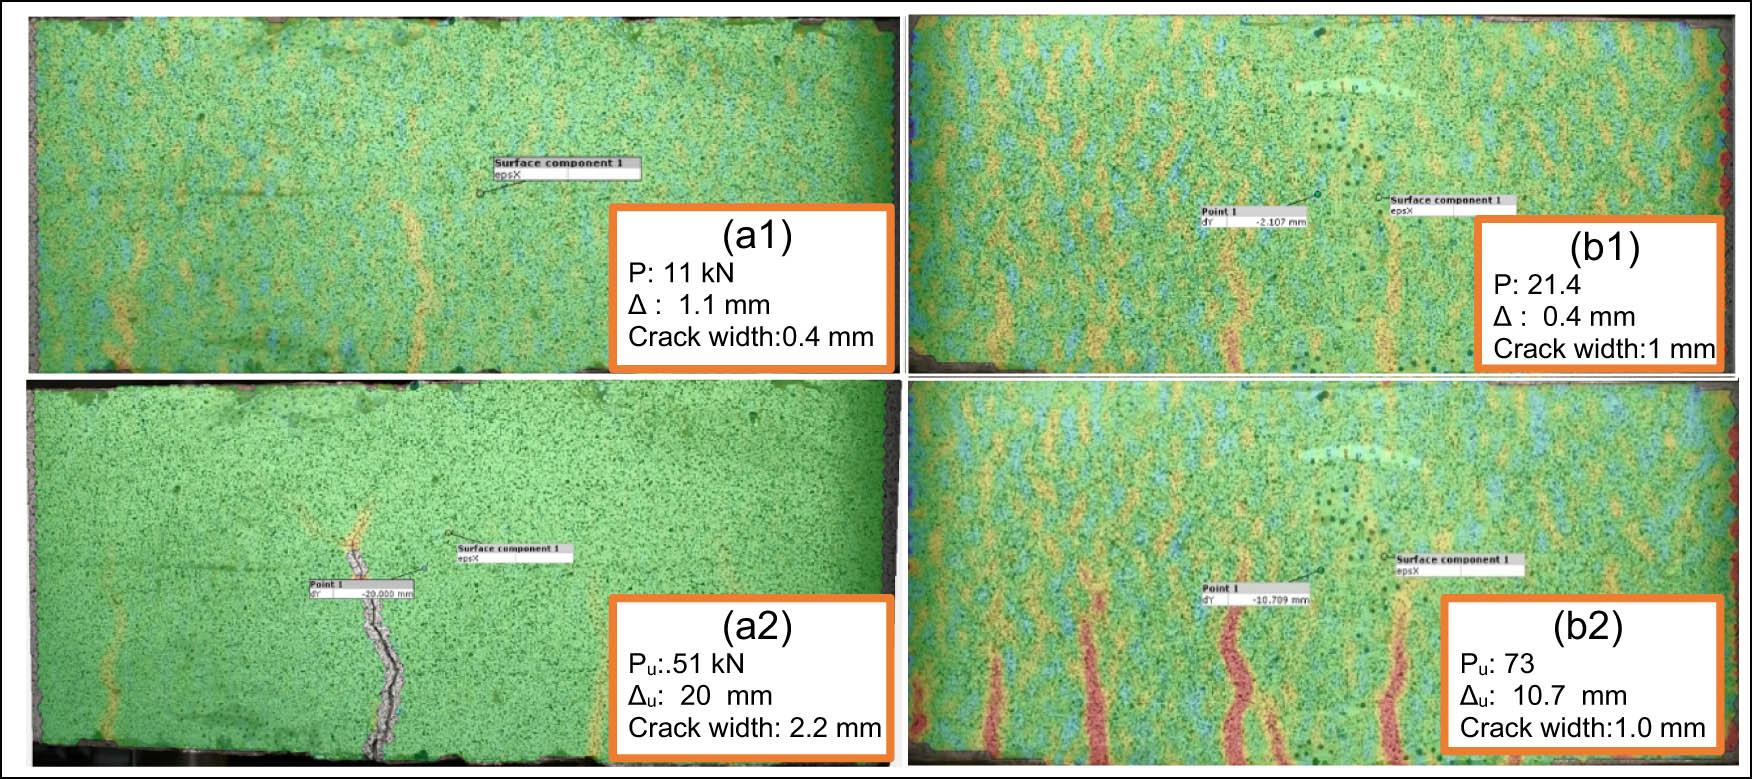
DIC frame illustrates crack initiating at different stages; (a) sample F1 (BF-L); and (b) sample F2 (BF-L-LB).
According to the data from DIC in Figure 9, F2 (BF-L-LB) sample first flexural crack was 21 kN compared to 11 kN in the F1 (BF-L) sample. This result is normal as the flexural capacity of the strengthened RC beam increased after CFRP application. This result clarifies the experimental results in Table 5, in which the first flexural crack was 22 kN in the F2 (BF-L-LB) sample and 9 kN in the F1 (BF-L) sample. The first crack in the experimental result was observed by eye, simultaneously on another side of the sample, using DIC, cracks were recorded; the results showed excellent agreement between the two results. Deflection at first crack was also compared between DIC and experimental results, in which in the sample F1 (BF-L), Δ DIC was 1.1 mm while it was 0.7 mm in the experimental result, and in the sample F2 (BF-L-LB), Δ DIC was 2 mm while it was 2 mm in the experimental result. This close agreement between the DIC records and experimental results strengthens the data obtained and makes it more realistic (Figure 10).
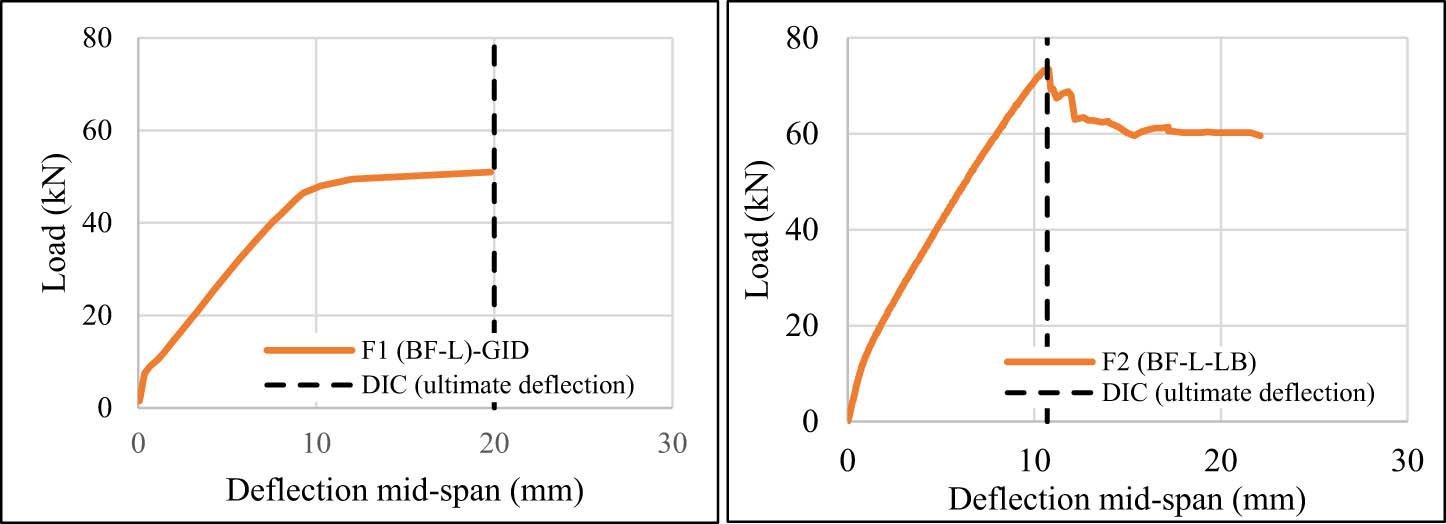
Comparison in ultimate deflection between experimental and DIC test for samples F1 (BF-L) and F2 (BF-L-LB).
Strengthened RC beams that were critical in flexural and cast with LSC (groups 2 and 4) showed excellent performance after CFRP strengthening. The total increase in ultimate load increased by 42–119% depending on the specific strengthening scheme, as presented in Table 5. The failure of the strengthened RC beam showed flexural failure similar to the control samples. This unchanging failure from flexural failure to shear failure was expected as the section was designed to have an ultimate shear capacity load P vu equal to 147 kN. The reason to achieve such capacity was to have the section fail in flexural even after being strengthened to undercover the flexural behavior of strengthened RC beams. Comparing P vu with the P u values in Figure 6 explains why all strengthened RC beams failed in flexural prior to reaching the ultimate shear capacity limit.
Strengthened RC beams critical in flexural, cast with LSC, exhibited remarkable performance post CFRP strengthening. The overall increase in ultimate load ranged from 42 to 119%, depending upon the specific strengthening scheme, as presented in Table 5. Notably, the failure mode of the strengthened RC beams remained a flexural failure, similar to the control samples. This type of flexural failure was expected, given that the section was designed to withstand an ultimate shear capacity load P vu of 147 kN. The objective was to ensure that the section would fail in flexure even after the CFRP strengthening, thereby revealing the flexural behavior of the strengthened RC beams, in which CFRP rupture or concrete cover separation may be achieved. A comparison of P vu with the P u values in Figure 6 explains why all strengthened RC beams failed in flexural prior to reaching the ultimate shear capacity limit.
Strengthened RC beams that were critical in flexural and cast with LSC showed an increase in the ultimate moment and shear capacities after CFRP strengthening, in which the total increase in the ultimate moment and shear capacities increased by 40–120% depending on the specific scheme used. Moment and shear behavior were extremely affected by the scheme of the CFRP strengthening, as presented in Figure 11.
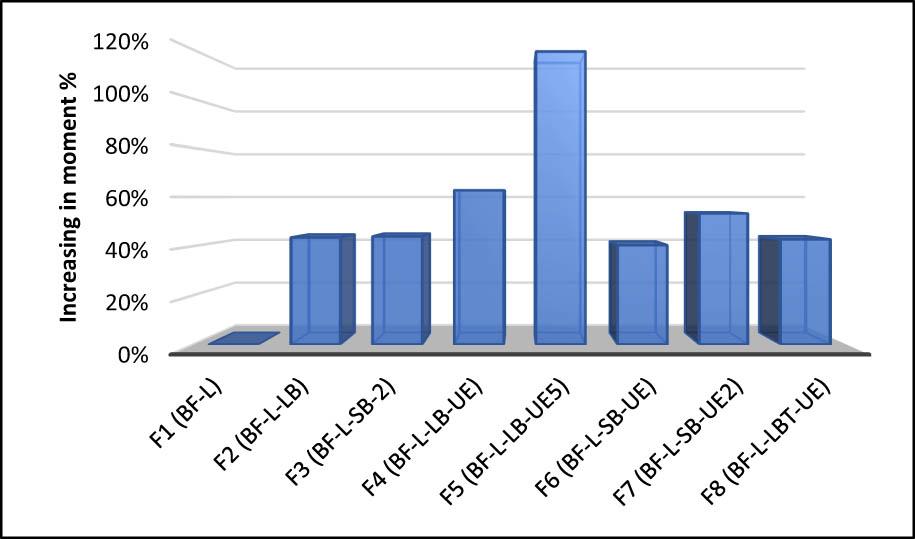
Increase in ultimate moment capacity according to different CFRP schemes.
Figure 12 presents a comparison of the moment and shear between samples F2 and F3. Results reveal that in flexural application, both the CFRP sheet and CFRP laminate got close upgrade value in total load capacity. However, CFRP laminate increases RC beam stiffness while CFRP sheets increase beam ductility.
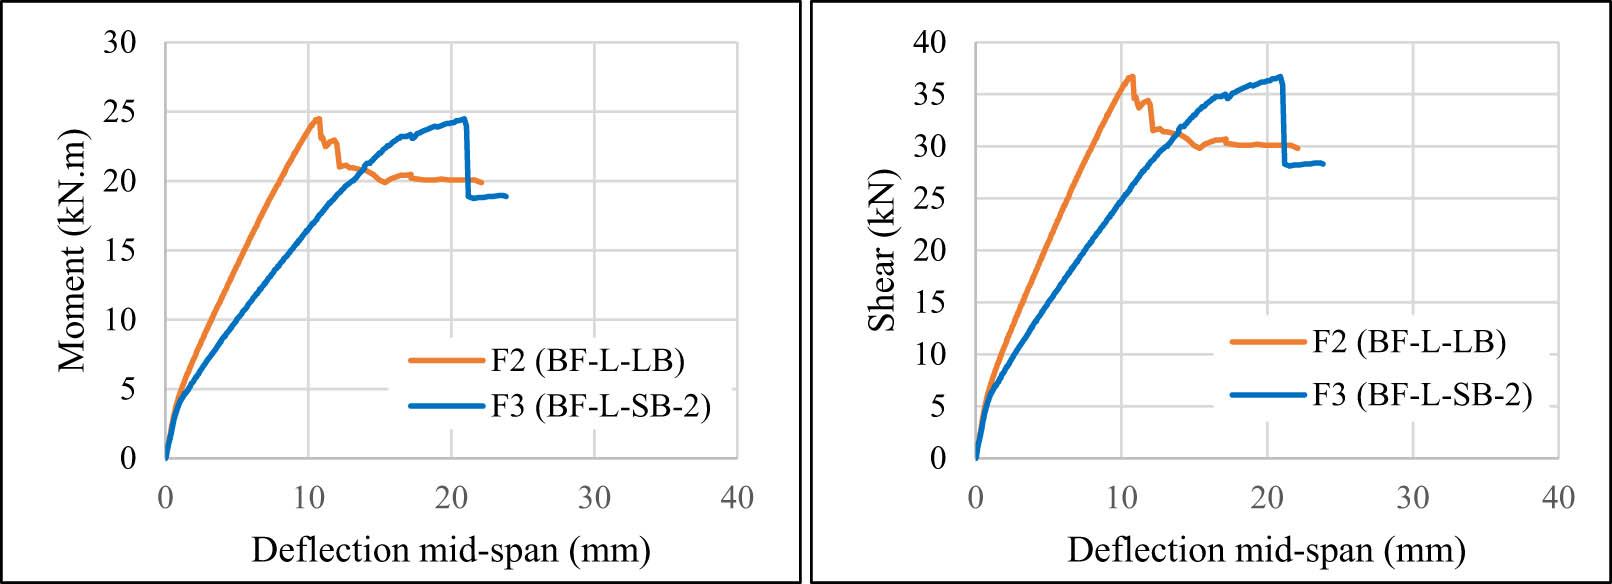
Comparison between F2 (BF-L-LB) and F3 (BF-L-SB-2) in moment and shear vs deflection.
Adding a two-layer CFRP sheet at the bottom of the beam increased the ultimate moment and shear capacity. It also increased the stiffness of the strengthened beam, leading to a reduction in total deflection. Figure 13 presents a comparison between two different CFRP applications: the F6 sample, which features one CFRP layer at the soffit, and the F7 sample, which has two CFRP layers.
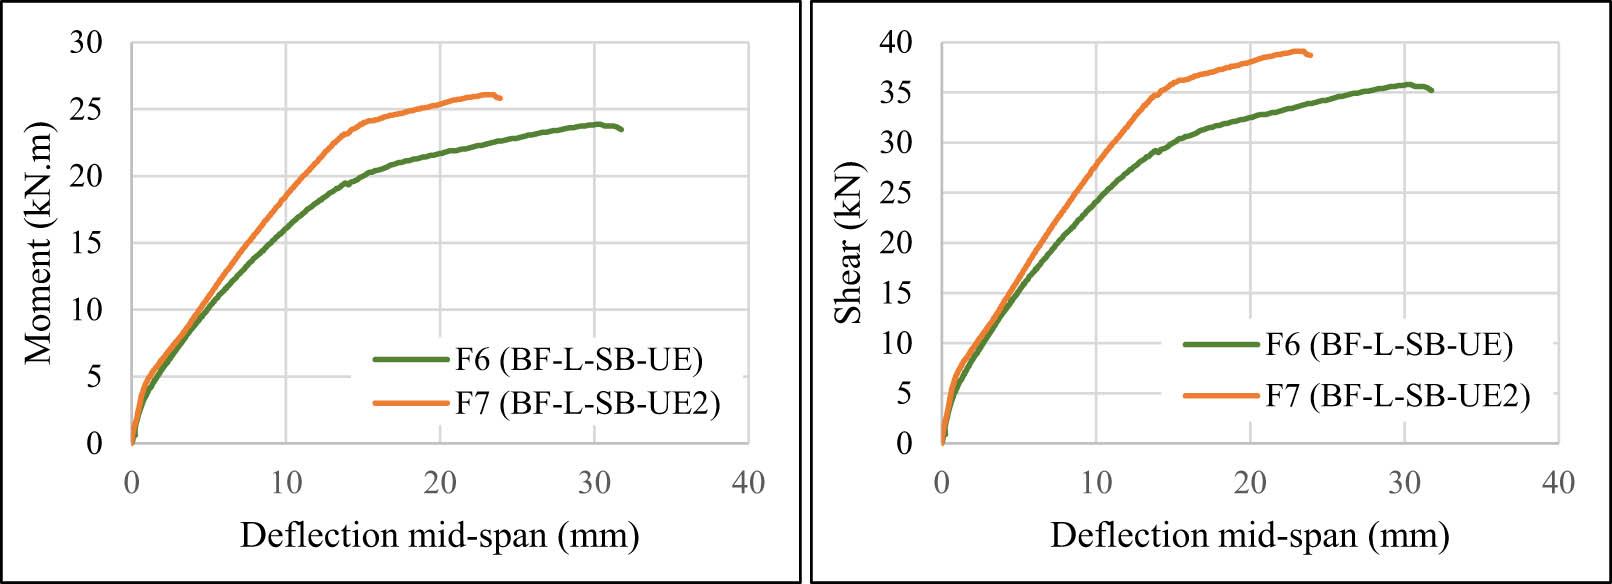
Comparison between F6 (BF-L-SB-UE) and F7 (BF-L-SB-UE2) in moment and shear vs deflection.
Adding a two-layer CFRP sheet at the bottom of the beam results in an increase in the ultimate moment and shear capacity. Additionally, it enhances the stiffness of the strengthened beam, resulting in a reduction in total deflection. Figure 13 presents a comparative analysis between two different CFRP applications: the F6 sample with one CFRP layer at the soffit and the F7 sample incorporating two CFRP layers.
As mentioned in the literature, CFRP debonding and separation of concrete cover are the most common flexural failures when an RC beam is strengthened with CFRP composite. Thus, in this research, several types of anchorage were investigated to study the effects of anchorage on the load-carrying capacity of strengthened RC beams. Figure 14 presents a comparison between different types of anchorage, in which load-carrying capacity increased with the presence of CFRP laminate at the RC beam soffit without CFRP U anchorage by 44%, by 63% when anchored at both ends with a 100 mm CFRP U jacket, and by 119% when anchored at both ends with a 500 mm CFRP U jacket. In the case of strengthening with a two-layer of CFRP sheets without anchorage, the ultimate load capacity increased by 44% while it went to 53% when anchored at both ends using 100 mm wide CFRP U jackets. These findings are significant as they reveal the effects of adding an anchorage system to the flexural strengthening program using CFRP.
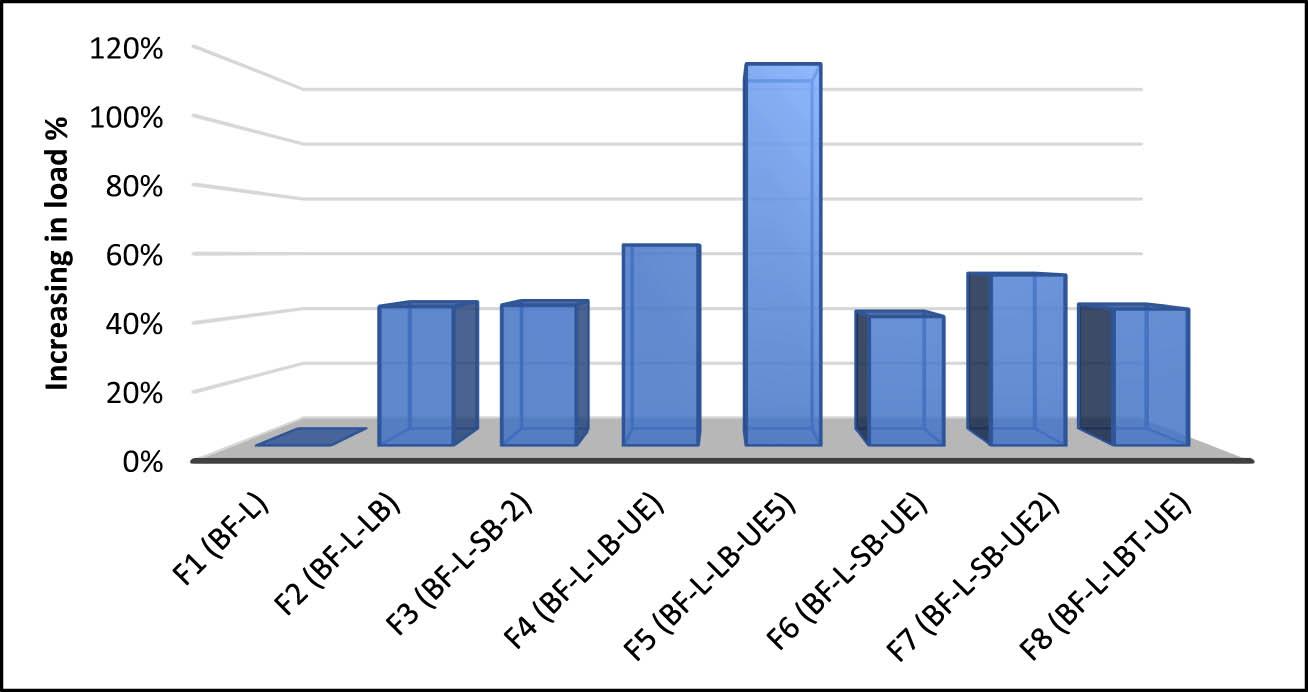
Increase in ultimate load capacity according to different CFRP schemes.
The ductility index, according to the experimental results for all RC beams, is presented in Table 6. Ductility was found using the ductility index factor (μd) method and the area under the curve at ultimate load (P u). The area under the curve was calculated using SketchAndCalc software.
Ductility index.
| Beam symbol | Beam ID | P y (kN) | Δ y (mm) | P u (kN) | Δ u (mm) | μ ε u (steel-tension) | P u /Δ u | Ductility index Δ u /Δ y (μd) | Increase in μd % | Area under curve (kN mm) | Increase in area under curve % |
|---|---|---|---|---|---|---|---|---|---|---|---|
| BF-L | F1 | 48.4 | 6.7 | 51 | 16 | 2,364 | 3.2 | 2.39 | — | 138 | — |
| BF-L-LB | F2 | 58.2 | 7 | 73.4 | 10.8 | 3,398 | 6.8 | 1.54 | −36% | 192 | 39% |
| BF-L-SB-2 | F3 | 46 | 5.9 | 73.4 | 20.1 | 2,871 | 3.7 | 3.41 | 43% | 413 | 199% |
| BF-L-LB-UE | F4 | 67.2 | 6.4 | 76.4 | 17.6 | 2,942 | 4.7 | 2.75 | 15% | 411 | 198% |
| BF-L-LB-UE5 | F5 | 104 | 7.2 | 111.8 | 18.6 | 3,580 | 6.0 | 2.58 | 8% | 510 | 270% |
| BF-L-SB-UE | F6 | 60.8 | 11.1 | 71.6 | 30.2 | 2,900 | 2.4 | 2.72 | 14% | 696 | 404% |
| BF-L-SB-UE2 | F7 | 67 | 10.7 | 78.2 | 22.8 | — | 3.4 | 2.13 | −11% | 547 | 296% |
| BF-L-LBT-UE | F8 | 60.6 | 6.1 | 72.8 | 11.3 | 2,872 | 6.4 | 1.85 | −23% | 195 | 41% |
Ductility can be measured by finding the area under the curve at ultimate load, as illustrated in Table 6. The ductility index reference is the area under the curve of the F1 (BF-L) sample. The ductility of RC beams with fiber addition increased by 291% compared to RC beams without fiber additions, which agreed with the study by Al-Hadithi et al. [37]. Moreover, RC beams strengthened with CFRP composite showed a significant increase in ductility, ranging from 39% in sample F2 to 404% in sample F6. Figure 15 illustrates the area under the curve for all RC beams critical in flexural.
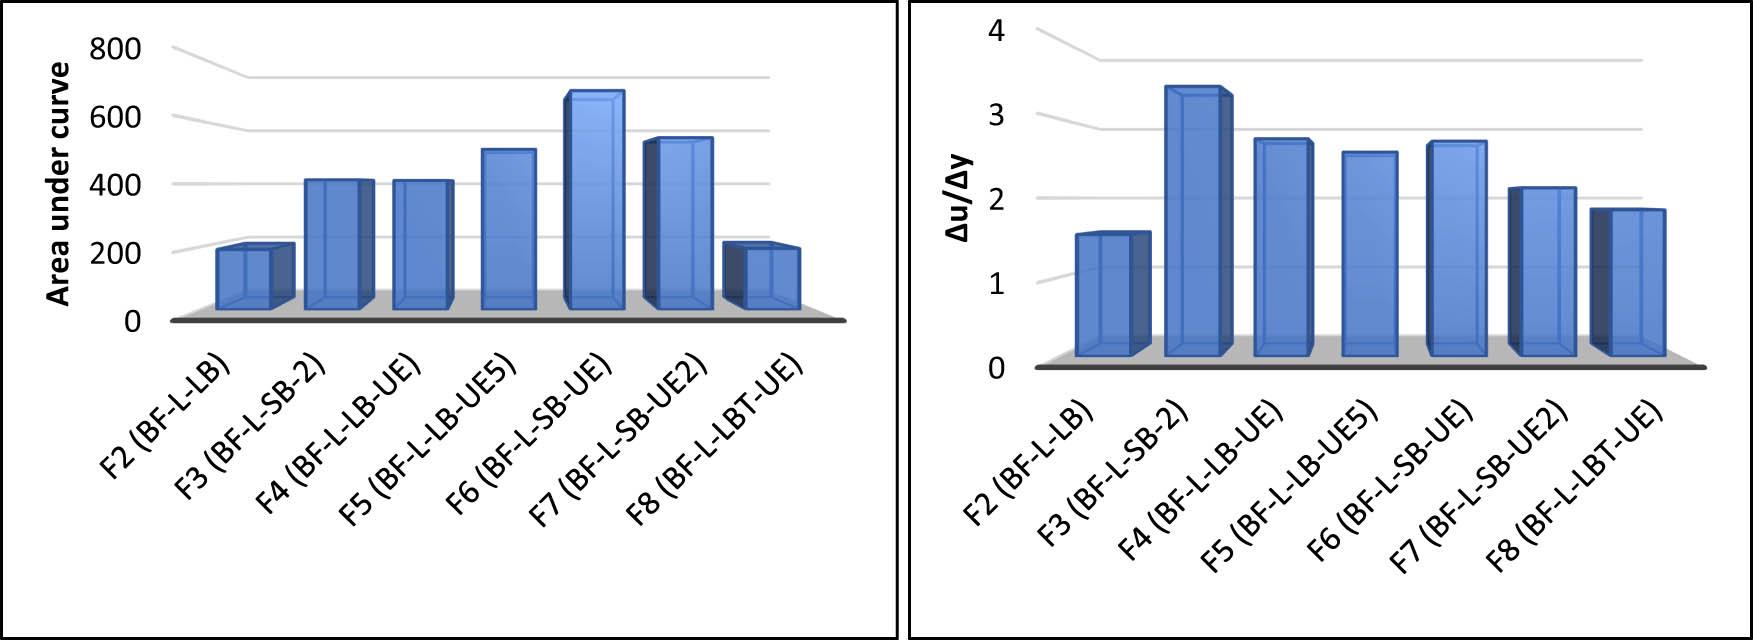
Ductility index.
The observed increase in ductility, up to 400% compared with the control beam, has significant implications for practical structural performance. Such an improvement means that the strengthened beams can undergo substantially greater deformations before failure, indicating enhanced energy absorption and post-yield behavior. In real structures, this translates to improved warning before collapse, greater resilience under overload or seismic actions, and a shift from a brittle to a more ductile failure mode. From a design standpoint, this level of ductility improvement suggests that CFRP strengthening not only restores or increases flexural capacity but also enhances the deformation capacity and safety margin, allowing engineers to achieve more reliable and damage-tolerant structural systems.
Another ductility indication is the ductility index factor (μd). In order to find the index factor, the yielding of the steel was significant to record. Yielding of the steel was found based on the data from strain gauges bonded to the steel rebar (Table 6). Yield steel strain was estimated to be equal to (0.67ε u = 0.23%). Samples F1 (BF-L) and F9 (BF-LP) behave as a ductile beam. All strengthened RC beams showed an increase in ductility index according to the index factor (μd) except F2, F7, and F8, in which ductility was reduced by 36 and 23%, respectively. The increasing range is between 8% in the F5 sample and 43% in the F3 sample. Figure 15 illustrates the index factor for all RC beams critical in shear. The results of the ductility index from the area under the curve and ductility factor showed an increase in ductility.
Control RC beams F1 (BF-L) and F9 (BF-LP) showed flexural bending crack patterns along the span that penetrated upward, reducing the compression block as the load was increased. The strengthened RC beam with CFRP composite showed a similar crack pattern at the beginning of the loading, then CFRP debonding occurred, and failure was recorded as debonding of the CFRP layer or concrete cover separation. Finite element analysis (FEA) using GiD and Atena studio software showed crack propagation in every load step (real-time result). The results showed excellent agreement in crack pattern between experimental results and FEA results.
Control RC beam F1 (BF-L) failure was flexural in the tension zone, as shown in Figure 8. Samples F2 and F3, which were strengthened without anchorage, failed due to concrete cover separation. This was due to the high stresses generated by the CFRP layer near the end-span that led to concrete separation. Sample F8 failure was a mix of concrete cover separation and CFRP debonding. The stiffness of the strengthened S8 sample increased after adding the CFRP laminate in the tension and compression zone, leading to such a result. All other strengthened RC beam failures were CFRP debonding near mid-span, as shown in Figure 8.
The number of cracks was also recorded, as illustrated in Table 7. According to the results, samples with U CFRP anchorage showed a reduction in the number of cracks by about 6%, regardless of the increment in ultimate capacity. All other RC beams showed an increase in the number of cracks due to the increase in load-carrying capacity. This led to the conclusion that crack width is reduced when the RC beam is strengthened with CFRP composite, as illustrated in Table 7.
Number of cracks at ultimate load.
| Beam symbol | Beam ID | Number of shear cracks diagonal | Number of flexural cracks | Crack width at failure-mid span (mm) | Failure mode |
|---|---|---|---|---|---|
| BF-L | F1 | 0 | 13 | 2.2 | Diagonal tension failure |
| BF-L-LB | F2 | 1 | 16 | 1.0 | Flexural compression failure |
| BF-L-SB-2 | F3 | 2 | 17 | 1.0 | Flexural compression failure |
| BF-L-LB-UE | F4 | 2 | 15 | 1.0 | Flexural tension failure and flexural compression failure |
| BF-L-LB-UE5 | F5 | 0 | 17 | 1.5 | Flexural compression failure |
| BF-L-SB-UE | F6 | 2 | 19 | 2.0 | Flexural tension failure and flexural compression failure |
| BF-L-SB-UE2 | F7 | 1 | 19 | 1.0 | Flexural tension failure |
| BF-L-LBT-UE | F8 | 0 | 15 | 1.0 | Flexural compression failure |
The failure moments (M u), cracking moment (M cr), and deflection (Δ) of two RC beams were calculated based on the ACI 318M-14 [38] and ACI 440.2R-17 [24]. The analyzed beams were F1 and F2). A bi-linear stress–strain curve was adopted for modeling steel and CFRP reinforcement. Stress and strain distributions were drawn, as in Figure 16. Whitney rectangular stress block was used to model the concrete compressive block. For accurate analysis, compression block coefficients (α 1 and β 1) were computed based on Collins and Mitchell [39] and Park and Paulay [40]. Compressive concrete cylinder strength (f c′) and failure compressive concrete strains (ε cu) were measured based on test results of concrete cylindrical samples.
-
E c is calculated according to ACI 318M-14 [38].
-
Maximum compressive concrete strain ε cu is computed from experimental test results.
-
α 1 and β 1 were calculated based on equations (1) and (2).
-
Based on the linear relationship, strains of compression steel, tension steel, and CFRP are given by
(1) {\varepsilon }_{{\rm{st}}}={\varepsilon }_{{\rm{cu}}}\left(\frac{d-c}{c}\right), (2) {\varepsilon }_{{\rm{sc}}}={\varepsilon }_{{\rm{cu}}}\left(\frac{{d}_{{\rm{sc}}}-c}{c}\right), (3) {\varepsilon }_{{\rm{fe}}}={\varepsilon }_{{\rm{cu}}}\left(\frac{{d}_{{\rm{f}}}-c}{c}\right)-{\varepsilon }_{{\rm{bi}}}\le {\varepsilon }_{{\rm{fd}}}. -
Determine FRP strain to prevent intermediate crack-induced debonding failure ACI 440.2R-17 [24].
(4) {\varepsilon }_{{\rm{fd}}}=0.41\sqrt{\frac{{f}_{{\rm{c}}}^{^{\prime} }}{n{t}_{{\rm{f}}}{E}_{{\rm{f}}}}}\le 0.9{\varepsilon }_{{\rm{fu}}}. -
Computing maximum steel and CFRP stresses that are equal to the maximum level of stress at the failure of section 440.2R-17 [24].
(5) {f}_{{st}}={E}_{{st}}{\varepsilon }_{{st}}({\varepsilon }_{{st}}\lt {\varepsilon }_{y}),{\rm{\ }}{f}_{{st}}={f}_{y}({\varepsilon }_{{st}}\ge {\varepsilon }_{y}), (6) {f}_{{sc}}\left={E}_{{sc}}{\varepsilon }_{{sc}}({\varepsilon }_{{sc}}\left\lt {\varepsilon }_{y}),{\rm{\ }}{f}_{{sc}}={f}_{y}({\varepsilon }_{{sc}}\ge {\varepsilon }_{y}), (7) {f}_{{fe}}\left={E}_{f}{\varepsilon }_{{fe}}\hspace{1em}({\varepsilon }_{{fe}}\left\lt {\varepsilon }_{{fu}}),{\rm{\ }}{f}_{{fe}}={f}_{{fu}}({\varepsilon }_{{fe}}\ge {\varepsilon }_{{fu}}). -
Neutral axis (c) is computed based on equilibrium using second-degree equations ACI 318M-14 [38] and 440.2R-17 [24].
(8) {\alpha }_{1}{f}_{c}^{^{\prime} }{\beta }_{1}{bc}+{A}_{{sc}}{f}_{{sc}}={A}_{{st}}{f}_{{st}}+{A}_{f}{f}_{{fe}}. -
Determine moment failure based on the following equation, where ψ f is the additional reduction factor assigned by 440.2R-17 [24] equal to 0.85.
(9) {M}_{n}={A}_{{\rm{st}}}{f}_{{\rm{st}}}\left(d-\frac{{\beta }_{1}c}{2}\right)+{\Psi }_{f}{A}_{f}{f}_{{\rm{fe}}}\left({d}_{f}-\frac{{\beta }_{1}c}{2}\right)-{A}_{{\rm{sc}}}{f}_{{\rm{sc}}}\left(\frac{{\beta }_{1}c}{2}-{d}_{{\rm{sc}}}\right). -
Computing load failure based on the bending moment formula for a simply supported beam
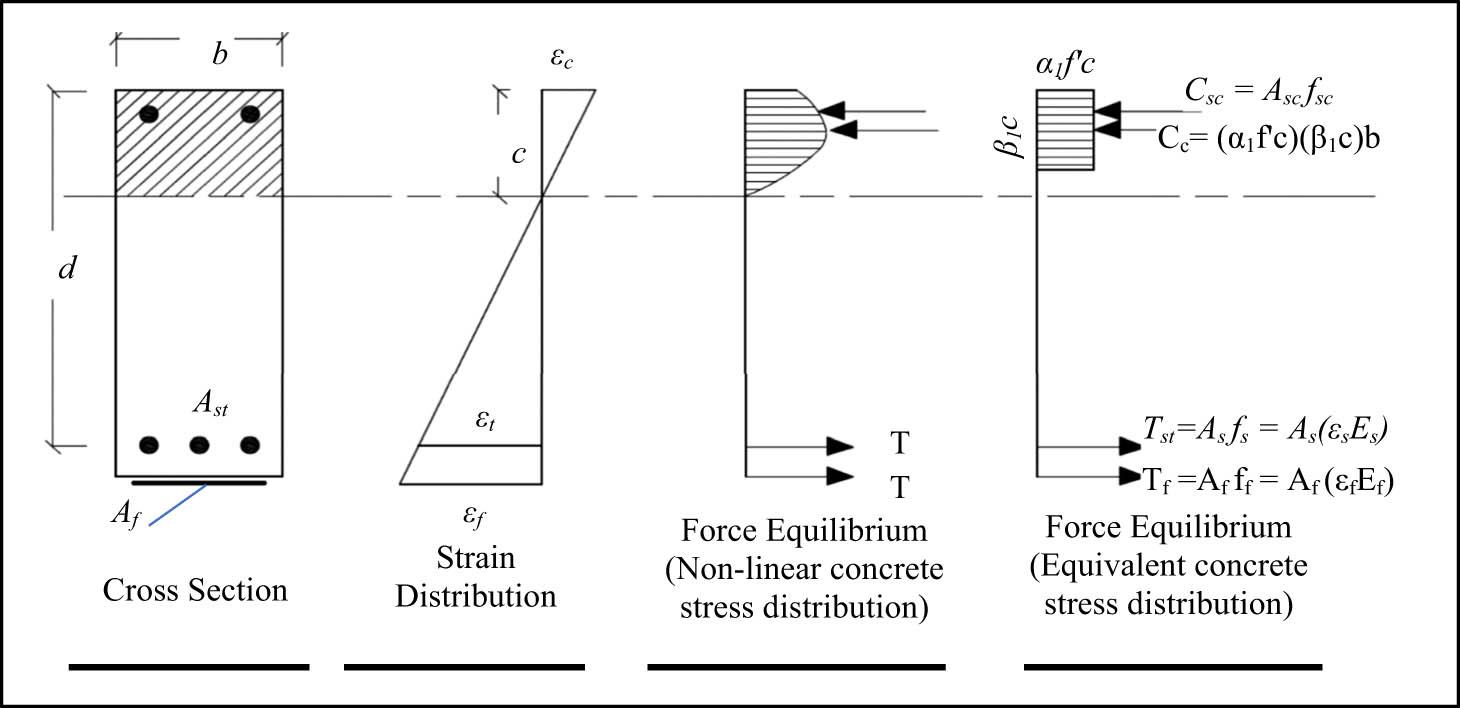
Section force distribution without CFRP.
Numerical analysis was carried out using GiD and ATENA software. The main parameters obtained from numerical analysis were load vs deflection at mid-span, crack pattern, fracture strain, strains, and stresses in entities. Additionally, an analytical analysis was conducted, and load vs deflection curves were obtained. All materials were assigned in the software (Figure 17).
GiD 3D model.
Load versus deflection was obtained from ATENA software and analytical analysis (Figures 18–20). The maximum applied load was well-matched curve obtained by experimental results. The variation was less than 5% with exceptional precision. The initial slope showed that the model had the same stiffness behavior as the experimental sample stiffness. However, the total displacement in the finite element (FE) model was about 20% less compared with the experimental sample. This result agrees with previous studies [1,41], which claim FE models show about 5–10% more stiffness and 5–20% less total deflection. The deflection at maximum load was predicted. The FE load–deflection and load–strain curves and the experimental findings matched rather well, as did the initial slope of the rising section of the curves. An analytical analysis was also conducted, and the results showed excellent agreement between both experimental and GiD results; the experimental strain–load curve beyond 22.4 kN went vertical due to strain gauge rupture.
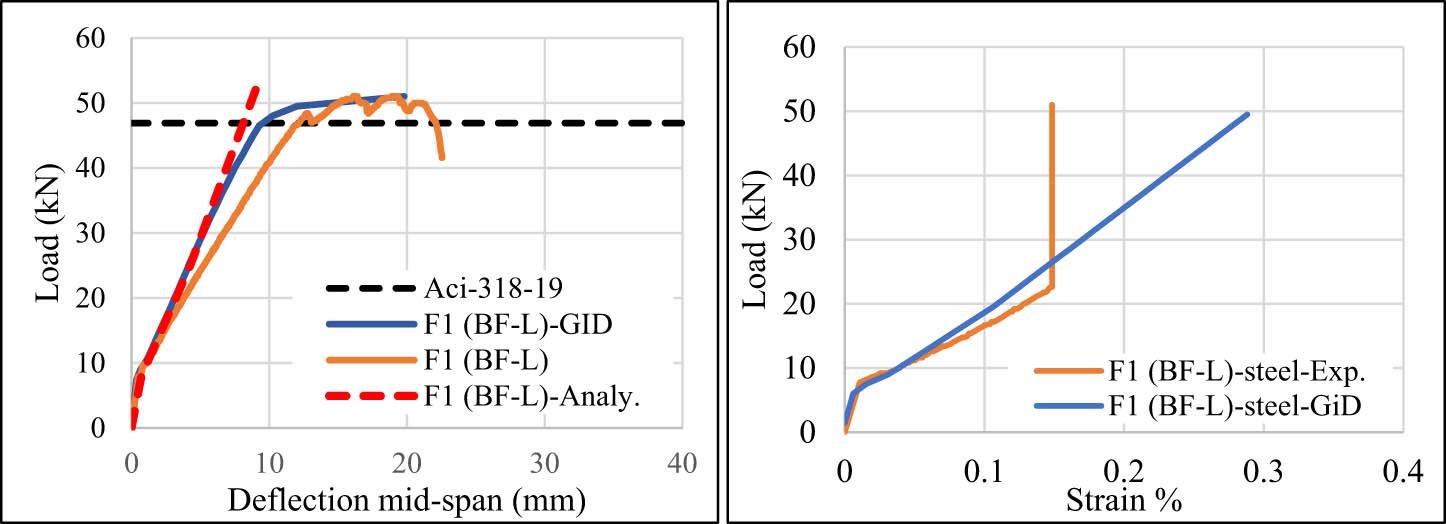
Load–deflection comparison between experimental, analytical, and GiD results for sample F1 (BF-L).
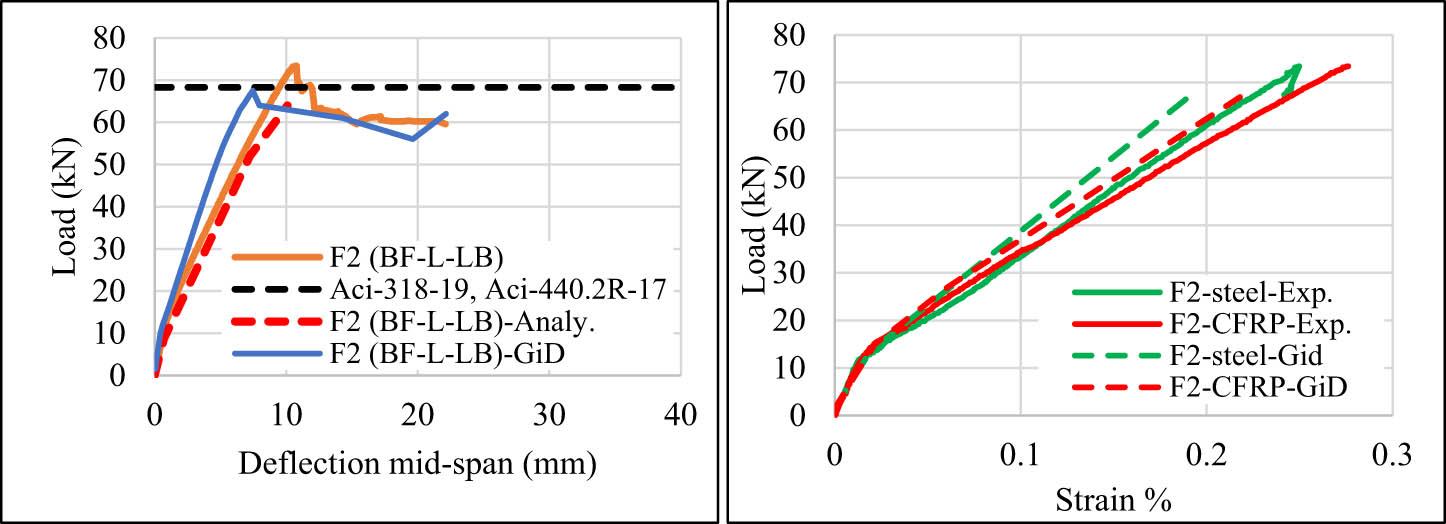
Load–deflection comparison between experimental, analytical, and GiD results for sample F2 (BF-L-LB).
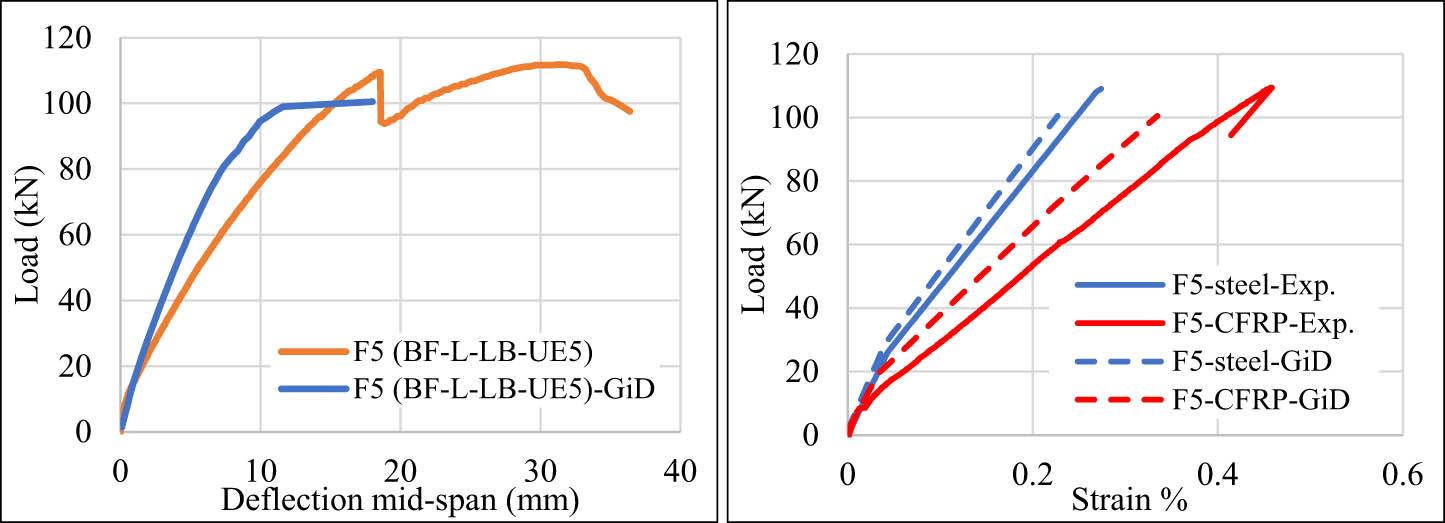
Load–deflection comparison between experimental, analytical, and GiD results for sample F5 (BF-L-LB-UE5).
GiD and ATENA software were used to capture and obtain crack patterns. A comparison of the crack pattern between the experimental and nonlinear finite element software results is shown in Figure 21. It is evident that the finite element model and the one from the lab result accord rather well. All modeled samples indicated flexural cracks due to high flexural stresses near mid-span. In sample F1 (BF-L), the model showed compression cracks at mid-span, which validated the results because the control sample, in the experimental study, suffered from compression failure after bending cracks.
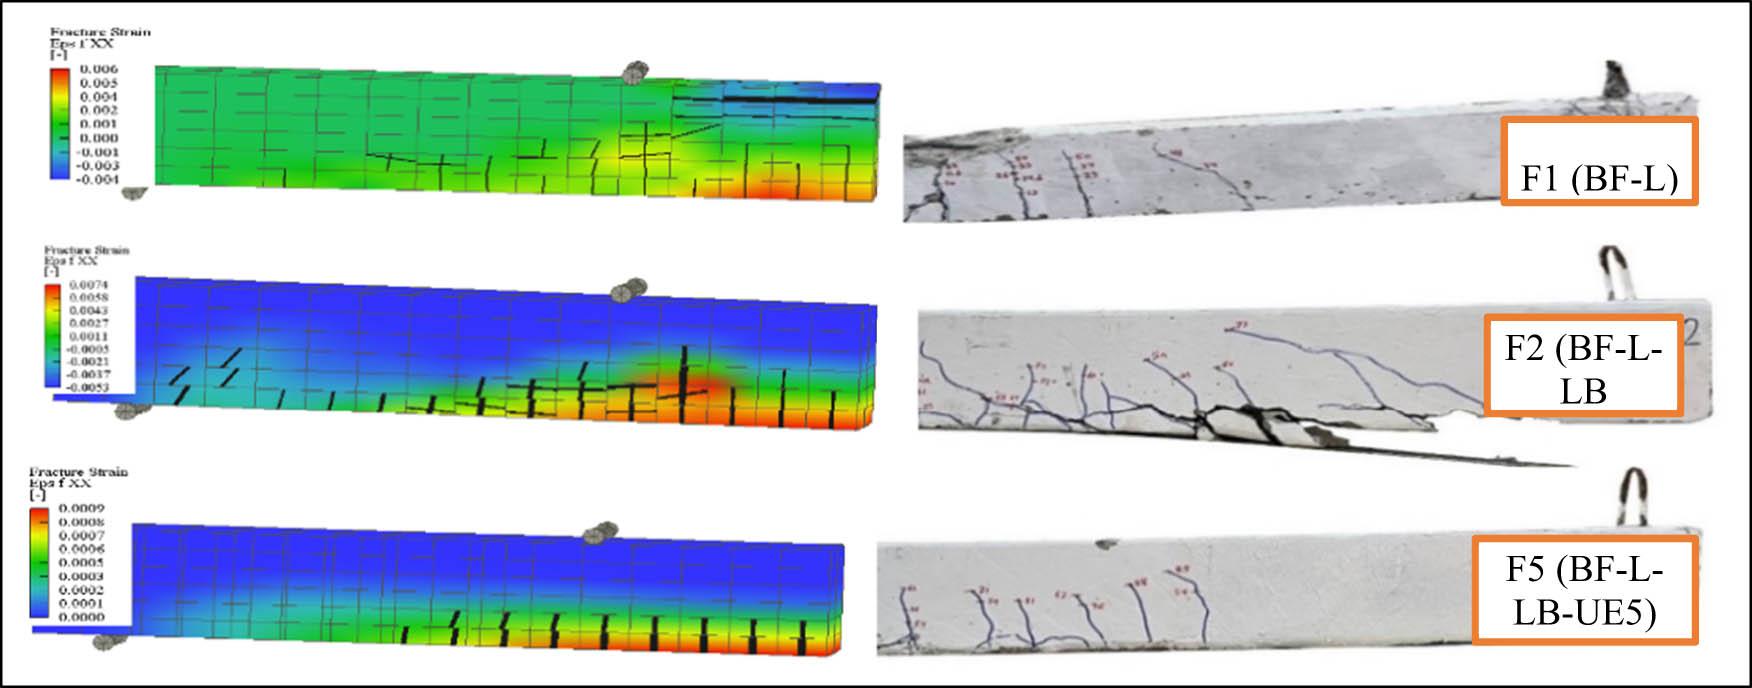
Crack pattern comparison between experimental and GiD.
Experimental results were verified with numerical finite element model (FEM) and analytical studies. A summary of the results is presented in Table 8. There were close agreements between the experimental and theoretical studies with respect to ultimate load, whereas numerical and analytical analyses underestimated total displacement Δ u. Results presented from the FEM validated experimental results. The difference in ultimate load ranged between 1 and 3% in shear critical samples and between 2 and 9% in flexural critical samples. On the other hand, total displacement was underestimated by 10–40%. Furthermore, analytical analysis based on ACI 318-19 and ACI 440.2R-17 showed close structural behavior to experimental results, in which the analysis underestimated the ultimate load by 4% and underestimated total displacement by 11% in samples without CFRP composite and by 40–70% in CFRP strengthening samples.
Comparison between experimental, numerical, and analytical analysis.
| Exp. | GiD | Analy. | Evaluation | |||||||||||||
|---|---|---|---|---|---|---|---|---|---|---|---|---|---|---|---|---|
| Beam ID | P u (kN) | M u (kN m) | V u (kN) | Δ u (mm) | P u (kN) | M u (kN m) | V u (kN) | Δ u (mm) | P u (kN) | M u (kN m) | V u (kN) | Δ u (mm) | P u.Exp./P u.GiD | P u.Exp./P u.Analy. | Δ u.Exp./Δ u.GiD | Δ u.Exp./Δ u.Analy. |
| F1 | 51 | 17.0 | 25.5 | 13 | 49.8 | 17 | 25.5 | 12 | 54.2 | 15.4 | — | 9.4 | 1.024 | 0.941 | 1.08 | 1.38 |
| F2 | 61.4 | 20.5 | 30.7 | 10.8 | 67.5 | 22.5 | 33.8 | 7.5 | 64 | 21.4 | — | 10.1 | 0.909 | 0.959 | 1.44 | 1.07 |
| F5 | 111.8 | 37.3 | 55.9 | 18.5 | 100.5 | 33.5 | 50.3 | 18 | — | — | — | — | 1.112 | — | 1.03 | — |
Based on the literature reviewed regarding the strengthening of RC beams in flexural, it is evident that few studies have specifically addressed the strengthening of RC beams with concrete strengths of less than 20 MPa. Furthermore, there has been limited exploration into the flexural characteristics of RC beams, and only a few studies have comprehensively examined various strengthening techniques for flexural application. This identified gap reveals the need for further investigation into this area. The RC beams were strengthened in flexural, with seven different schemes. For flexural strengthening, the feasibility of utilizing CFRP fabric and laminate, along with the effectiveness of U CFRP jacketing, was examined. The experimental findings were further validated through theoretical analyses conducted via numerical and analytical methods. The main findings are addressed below:
-
Strengthened RC beams critical in flexural exhibited flexural failure, as the flexural capacity load remained lower than the shear capacity load, leading to flexural failure occurring before shear failure.
-
The failure mode observed in strengthened RC beams critical in flexural was either concrete cover separation failure or CFRP debonding failure, which agreed with typical failures defined in the literature.
-
In flexural strengthening applications, the incorporation of CFRP laminate in the tension zone results in a notable reduction in flexural deformation and an increase in strain resistance, as the high tensile strength and stiffness of carbon fibers reinforce the resistance to flexural stresses.
-
RC beam critical in flexural that strengthened with CFRP laminate and anchored with U fabric CFRP jacket 500 mm on both sides (F5), showed excellent performance with an increase of 220% in ultimate load compared to the control sample F1. Ductility was also enhanced compared to the control sample. The reason for this increment returns to the contribution of the CFRP U jacketing in postponing CFRP debonding.
-
In flexural strengthening applications, the CFRP plates played a significant role in enhancing the flexural behavior and strain characteristics of the tested RC beam. CFRP laminate effectively distributed and transferred flexural forces, leading to an increase in load-carrying capacity and improved overall structural performance.
-
In a flexural strengthening application, a high level of CFRP strain reveals that the strengthening technique was effective, with the CFRP composite serving as the primary reinforcement.
-
Ductility and elastic behavior increased in all flexural critical RC beams strengthened with CFRP composite by 8–43% concerning the ductility factor μd.
-
Crack width is reduced when the RC beam that is weak in flexural strength is strengthened with CFRP composite.
It should be noted that the findings of this study are based on tests conducted under controlled laboratory conditions, which may not fully represent real-scale structural behavior. The specimens were tested at a small scale, and thus, potential scale effects on load transfer and failure mechanisms were not investigated. In addition, long-term durability aspects, such as environmental exposure, creep, and fatigue performance of the CFRP–concrete interface, were not evaluated in this work. Future research should address these aspects through full-scale and long-term experimental studies to further validate the applicability of the proposed strengthening approach in field conditions.
Authors state no funding involved.
Mand Kamal Askar: writing, experimental, analysis; Yaman Sami Shareef: guidance, reviewing, editing.
Authors state no conflict of interest.