Inorganic red pigments are widely used in various materials such as ceramics, plastics, and glass due to their bright colors, strong coloring ability, and good dispersion properties [1]. However, the popular inorganic bright red pigments currently on the market are cadmium sulfur selenide [2,3,4,5] (CdS x Se1–x ), HgS–CdS, PbCrO4, etc., and most of them contain elements like Cd, Hg, or Pb that are harmful to the environment and human health, which results in several restrictions on their production and application. Thus, the development of green and eco-friendly inorganic red pigments is imperative. γ-Ce2S3 stands out among many inorganic red pigments and is considered the best choice to replace harmful inorganic red pigments because of its strong anti-ultraviolet radiation capacity, environmental protection, and outstanding chromogenic properties [6,7,8]. γ-Ce2S3 is typically prepared by reacting CeO2 with H2S or CS2 as a sulfur source under high temperature of 1,300°C and in an Ar gas protection atmosphere. However, the high preparation temperature leads to the formation of coarsely sized and impure pigment particles. Additionally, H2S is also toxic, and CS2 decomposes at high temperatures to generate simple substances S and C [9,10], which will attach to the surface of the sample and lead to the dark color of the final pigment. Due to the presence of Ce3+ vacancies in the γ-Ce2S3 phase [11], the synthesis temperature of γ-Ce2S3 can be reduced by doping with metal ions [12]. Song et al. [13] prepared a Li+ -doped γ-Ce2S3 pigment by mixing and grinding Li2CO3 and CeO2, and then decreasing the temperature to 900°C in a CS2 sulfurizing atmosphere. Liu et al. [14] prepared a Sr2+-doped γ-Ce2S3 pigment at 900°C by the co-precipitation method. However, the γ-Ce2S3 prepared by these methods has problems, such as a coarse particle size, serious agglomeration, low brightness, and redness values of the pigment.
Wu et al. [15] attempted to solve these problems by using a low-temperature combustion synthesis (LCS) method to prepare the γ-Ce2S3 pigment. The LCS method produces a gel by the reaction of organic complexing agents (citric acid [CA], ethylenediamine tetraacetic acid [EDTA], etc., as fuel) and soluble metal nitrates (NO3− as an oxidant). The redox reaction after gel ignition releases a large amount of gas, which makes the product a loose and porous ultrafine powder. Furthermore, the porous skeleton reduces the adhesion between powders and easily forms steric hindrance between powders, thereby reducing the agglomeration of powders during high-temperature calcination [16,17,18,19]. The advantages of the LCS method compared with the solid state method, hydrothermal method, and coprecipitation method are that it can accurately control the stoichiometric ratio of raw materials, ensure the uniformity of components, synthesize powders with high specific surface area, and control the properties of products by adjusting the reaction parameters. In the LCS method, the morphology, particle size, properties, and other characteristics of the product can be controlled by adjusting the pH of the solution, the type and dosage of the complexing agent, and the ratio of the oxidant to fuel. For example, Wu et al. [20] used the sol–gel combustion method to prepare iron oxide powder with glycine, hydrazine, and CA as complexing agents, and finally, obtained the smallest particle size of the product when CA was the complexing agent. Kishori et al. [21] found that changing the ratio of the oxidizer to fuel had significant effects on the crystal structure, crystallization degree, and surface properties of the product. Mali and Ataie [22] studied the effect of the ratio of metal nitrate to CA on the LCS process and the synthesis of barium hexaferrite. It was found that with the increase of the molar ratio of metal nitrate to CA, the self-propagating combustion rate of xerogel increased, and the synthesis temperature of barium hexaferrite decreased significantly. In addition, a single complexing agent has limited ion complexing ability and is prone to metal ion segregation. The researchers found that using two complexing agents simultaneously prevented metal ions from segregating. Ganesan et al. [23] used CA, CA–ethylene glycol, and CA–polyethylene glycol as complexing agents to prepare Th3+-doped Y2O3 powder, and found that the powder with high purity and high sintering density was obtained in the CA–ethylene glycol system. On the one hand, the addition of ethylene glycol can complex metal ions with CA to form a more stable complex. On the other hand, it can undergo an esterification reaction with CA to complicate the structure of the colloid, forming a macromolecular skeleton between the molecules. It can burn fully during combustion and reduce the agglomeration of molecules after combustion.
In this work, based on n(Na)/n(Ce) = 0.2, the Na+ ion-doped γ-Ce2S3 red pigment was synthesized using the self-propagating combustion method at a low temperature with CA–ethylene glycol as a complexing agent. The effects of different process parameters on the product morphology of the CeO2 precursor and the product morphology, chromaticity, and particle size of the γ-Ce2S3 pigment were investigated.
In this study, all raw materials used were analytically pure. Cerium nitrate (Ce(NO3)3·6H2O, 99.0%), sodium nitrate (NaNO3, 99.0%), CA (99.0%), EDTA (99.0%), ammonia (NH3·H2O, 99.0%), nitric acid (HNO3, 99.0%), and polyethyleneglycol (99.0%) were purchased from China National Medicine Chemical Reagent Co., Ltd. The molar ratio of each substance was calculated using thermochemistry theory in propellant chemistry, and the valence was balanced. The precursor reaction process was as follows:
The corresponding molar amounts of NaNO3, Ce(NO3)3·6H2O, and CA were weighed according to formula (1), and HNO3 was added to completely complex them. The pH was adjusted to 7 with NH3·H2O. The solution was stirred in a water bath at 80°C for 2 h to obtain a viscous gel, and then it was dried in an oven at 80°C for 12 h to obtain a xerogel. The xerogel was placed into a muffle furnace and heated at 600°C for 1 h to obtain precursor powder. The ratio of CA to metal nitrate (hereinafter referred to as CA/M) was adjusted to 1.0, 1.5, 2.0, and 3.0 to ensure that metal nitrate could be completely complexed, and based on this, the ratio of oxidant to fuel (hereinafter referred to as H/CA) was changed (0.5, 1.0, 1.5, 2.0). By introducing different proportions (0.5, 1.0, 1.5, 2.0) of ethylene glycol and citric acid (hereinafter referred to as EG/CA) into the optimum formula, ethylene glycol and CA were esterified. The CeO2 precursor obtained had a larger specific surface area, which was beneficial to vulcanization and improved the particle size and chromaticity of the pigment.
The precursor powder was slightly ground and placed in an alumina crucible and fixed in a tubular atmosphere furnace. With CS2 as the sulfur source and Ar gas as the protective atmosphere, the tube furnace was vacuumized many times, and then the Ar gas was continuously introduced at a flow rate of 150 mL/min. After the temperature was increased to 150°C at 5°C/min, CS2 was brought into the furnace in the form of gas, bubbling by switching Ar to vulcanize the Na+-CeO2 precursor, and then the temperature was raised to 900°C and kept for 2 h. When the temperature was cooled to 300°C, the mixed atmosphere was switched to Ar gas, the atmosphere was turned off at 200°C, and the sample was taken out after cooling to room temperature.
Fourier transform infrared spectroscopy (FT-IR, Nicolet 5700, USA) was used to determine the surface functional groups of the xerogel. The pore volume and pore diameter of the precursors were characterized by the Brunauer–Emmett–Teller N2 adsorption–desorption test (BET, ASAP2020, Micromeritics, USA). Field emission scanning electron microscopy (FE-SEM, JSM-6700 E, JEOL, Japan) was used to analyze the micro-morphology of the precursors and pigments. The chromaticity of the samples was characterized by an automatic colorimeter (YT-ACM402, Hangzhou Yante Technology Co., Ltd, China), and geometric conditions were observed by d/0 illumination. ptThe diameter of the diffusion ball was 150 mm, the diameter of the test hole was 30 mm, and the test wavelength range was 400–700 nm. The light reflection characteristics of the sample were tested by a dual-beam UV-visible photometer (Lambda850, PerkinElmer, USA), and the reference materials were BaSO4, the light sources were tungsten and protium lamps, and the wavelength range was 350–900 nm. The temperature stability of the samples was analyzed by a thermogravimetric differential thermal analyzer (STA-449C, NETZSCH Instrument Manufacturing Co., Ltd, Germany) from room temperature to 1,000°C at a heating rate of 10°C/min in air.
Figure 1 shows the FT-IR images of xerogels with different proportions of citric acid and metal nitrate (CA/M). According to the figure, the xerogels without any doping are consistent with those doped with Na+, indicating that the introduction of Na+ only increases the molar amount of metal ions and will not change the groups in the xerogels. The corresponding citrate −OH vibration bands appeared near 3,142 cm−1. An absorption peak appears at 1,720 cm−1 when CA/M = 3.0, which is the C═O stretching vibration peak on the free carboxyl group in CA [24], indicating that some CA is not coordinated with metal ions, while no similar peak appears at CA/M = 1.0, CA/M = 1.5, and CA/M = 2.0. All of the infrared absorption spectra of dry gel were around 1,580 cm−1 with a strong absorption peak, corresponding to the carboxylic acid salt of the antisymmetric stretching vibration band. This is the result of the movement of the vibratory absorption band of the carbonyl group (C═O) in COOH of CA to the low frequency [25], indicating that the carbonyl group is coordinated to the metal atom, and the metal ion in nitrate has undergone a complex reaction with the citric acid. Therefore, it can be shown that the ratio of CA/M = 2.0 can ensure the complete complexation of metal ions with CA, and ensure that CA will not remain after the precursor is burnt. The characteristic vibration absorption bands at 1,380 and 830 cm−1 correspond to

FT-IR images of the xerogels with different CA contents (CA/M).
When the xerogel with CA as a complexing agent is placed in a muffle furnace for heating, the xerogel will have a violent combustion reaction in a short time and emit a lot of white smoke, and finally form a fluffy powder. Figure 2 shows the TG-DTA curve of the xerogel. It can be seen that the sample has three smaller endothermic peaks at 128.2, 163.2, and 236.1°C, which, respectively, correspond to the evaporation of a small amount of free water remaining on the surface of the xerogel, the evaporation of crystalline water inside the xerogel, and the thermal decomposition of NH4NO3. At this time, the TG curve shows that the quality of the xerogel has decreased by 10%. There is an obvious exothermic peak near 271.9°C, which is accompanied by a rapid decrease in the quality of the xerogel (approximately 81.99% decrease) on the TG curve. This exothermic peak represents the spontaneous combustion reaction of the xerogel after it is ignited, and then the tiny exothermic peak at 331.4°C represents the combustion of excess organic matter in the xerogel; however, the loss of xerogel quality on the TG curve is not obvious. To ensure complete oxidation–reduction reactions in the xerogel, the ignition temperature for combustion is set at 600°C.

TG-DTA curve of xerogel decomposition.
The SEM images of different H/CA precursors are shown in Figure 3. It can be seen that the undoped xerogel precursor (Figure 3e) shows the morphology of small particles gathering and adhering to the bulk. With an increase in the H/CA ratio, the morphology of the precursor changes from pore structures formed by aggregated particles to a bulk-like structure where a large number of particles adhere to each other, which is unfavorable for sulfurization. Consequently, the morphology of the pigment gradually transitions into an adhesive state. When H/CA = 0.5, there is more CA, which can be fully burned, and the generated gas can completely separate the particles, making the precursors more fluffy and porous under a microscopic view, and the skeleton formed between them is loose. When H/CA = 1.0, the precursor still maintains a porous morphology. However, at H/CA ratios of 1.5 and 2.0, the increased concentration of HNO3 leads to fuel depletion, resulting in a gradual decrease in the self-propagating combustion rate. The gel’s instantaneous oxygen consumption increases sharply during combustion, resulting in an oxygen consumption that is lower than the theoretical value. Due to the slow-release rate of the gas, the instantaneous expansion of the gas cannot entirely separate the particles, and the xerogel is not burned completely the first time, producing a smaller amount of gas after burning. Consequently, some holes occur, and the precursor still exhibits some monolithic morphology.

SEM images of the precursors with different H/CA ratios: (a) 0.5, (b) 1.0, (c) 1.5, (d) 2.0, and (e) undoped.
The adsorption–desorption isotherm of the BET N2 is shown in Figure 4. It shows that the undoped xerogel appears as an H4 hysteresis loop in the middle and high-pressure regions, which indicates that there are many micropores and narrow mesopores in its precursor. With increasing HNO3 content, the isotherm of the precursor begins to rise rapidly when the relative pressure approaches the saturated vapor pressure. This indicates that the substance consists of numerous flaky particles loosely arranged, resulting in the formation of a multitude of cracks and pores due to the loose accumulation between these particles. Additionally, the presence of a large volume of mesopores in the material provides ample space for gas molecules to be adsorbed, making it easier for the gas molecules to be adsorbed into the interior of the material under high-pressure conditions. On the other hand, compared to the loose accumulation of plate-like particles in the precursor, the number of micropores and small volume mesopores formed is relatively low. This is also the reason why the adsorption capacity of the precursor is concentrated in the high-pressure range [26].

N2 adsorption–desorption isotherms of precursor BET at different H/CA ratios: (a) 0.5, (b) 1.0, (c) 1.5, (d) 2.0, and (e) undoped.
Table 1 shows the pore volume, pore diameter, and specific surface area of different H/CA precursors. The specific surface area and micropore volume of the undoped precursor are lower than H/CA = 0.5, and the average micropore size is 10.45 nm. With an increase of the H/CA ratio, the specific surface area and micropore pore volume of the precursor samples decreased from 13.8358 m2/g and 0.078 cm3/g with H/CA = 0.5–3.7390 m2/g and 0.023 cm3/g with H/CA = 2. The average pore size of the micropores increased from 0.21 nm with H/CA = 0.5–31.67 nm with H/CA = 2, which indicated that with an increase of HNO3 dosage, the gas cannot expand rapidly at the first during combustion, and the decrease of pore volume in the sample leads to the decrease of specific surface area. At the same time, the exhaust of gas cannot wash away the sample particles, which makes the sample dense and the average pore size of micropores increases gradually. To sum up, when H/CA is 0.5, the specific surface area and pore volume of the precursor are larger, which is more conducive to vulcanization and obtaining pigment samples with a small particle size.
Specific surface area, pore volume, and pore diameter of the precursors under different H/CA conditions
| H/CA | BET surface area (m2/g) | Pore volume (cm3/g) | Average pore size (nm) |
|---|---|---|---|
| Undoped | 8.5823 | 0.036 | 10.45 |
| 0.5 | 13.8358 | 0.078 | 20.21 |
| 1.0 | 11.4443 | 0.042 | 21.32 |
| 1.5 | 8.9939 | 0.030 | 29.25 |
| 2.0 | 3.7390 | 0.023 | 31.67 |
Figure 5 shows the SEM images and particle size distribution diagram of the pigment at different H/CA ratios. It can be seen from Figure 5(a)–(d) that the particle morphology of the vulcanized sample is coral-like, and there is a slight tendency of adhesion and agglomeration. From Figure 5(e)–(h), it can be seen that when H/CA = 0.5, the average particle size of the sample particles is 460 nm, of which the particle size of around 400 nm accounts for 50% at the highest, showing a normal distribution, indicating that the particle size of the product is relatively concentrated. The average particle size of the sample with H/CA = 1.0 is 560 nm, and the particle size between 400 and 600 nm accounts for 87%, which shows that the particle size range of the sample is wide and the particle distribution is not concentrated. However, the average particle sizes of the samples with H/CA = 1.5 and 2.0 are 510 and 470 nm, respectively, and the particle size distribution range suddenly widens, accompanied by the appearance of large particles. From the SEM image, it can be seen that compared with H/CA = 0.5, the samples tend to be stacked and adhered, which leads to a decrease of particle dispersion.

SEM images of the pigments with different H/CA ratios and particle size distribution maps: (a)–(d) H/CA = 0.5, 1.0, 1.5, and 2.0; (e)–(h) H/CA = 0.5, 1.0, 1.5, and 2.0.
Figure 6(a) and (b) shows chromaticity and CIE color gamut coordinates of the γ-Ce2S3 pigments prepared at different H/CA ratios, and the corresponding data are shown in Table 2. From Figure 6(a), it can be observed that as the H/CA ratio increases, the obtained pigments exhibit a gradual decrease in the lightness values (L*) and redness values (a*), although the magnitude of this decrease is not significant. However, when H/CA = 2.0, the brightness of the pigment drops sharply, which corresponds to the color gamut coordinates in Figure 6(b). Therefore, the pigment prepared when H/CA = 0.5 has the best color: L* = 36.12, a* = 37.88, and b* = 27.65.
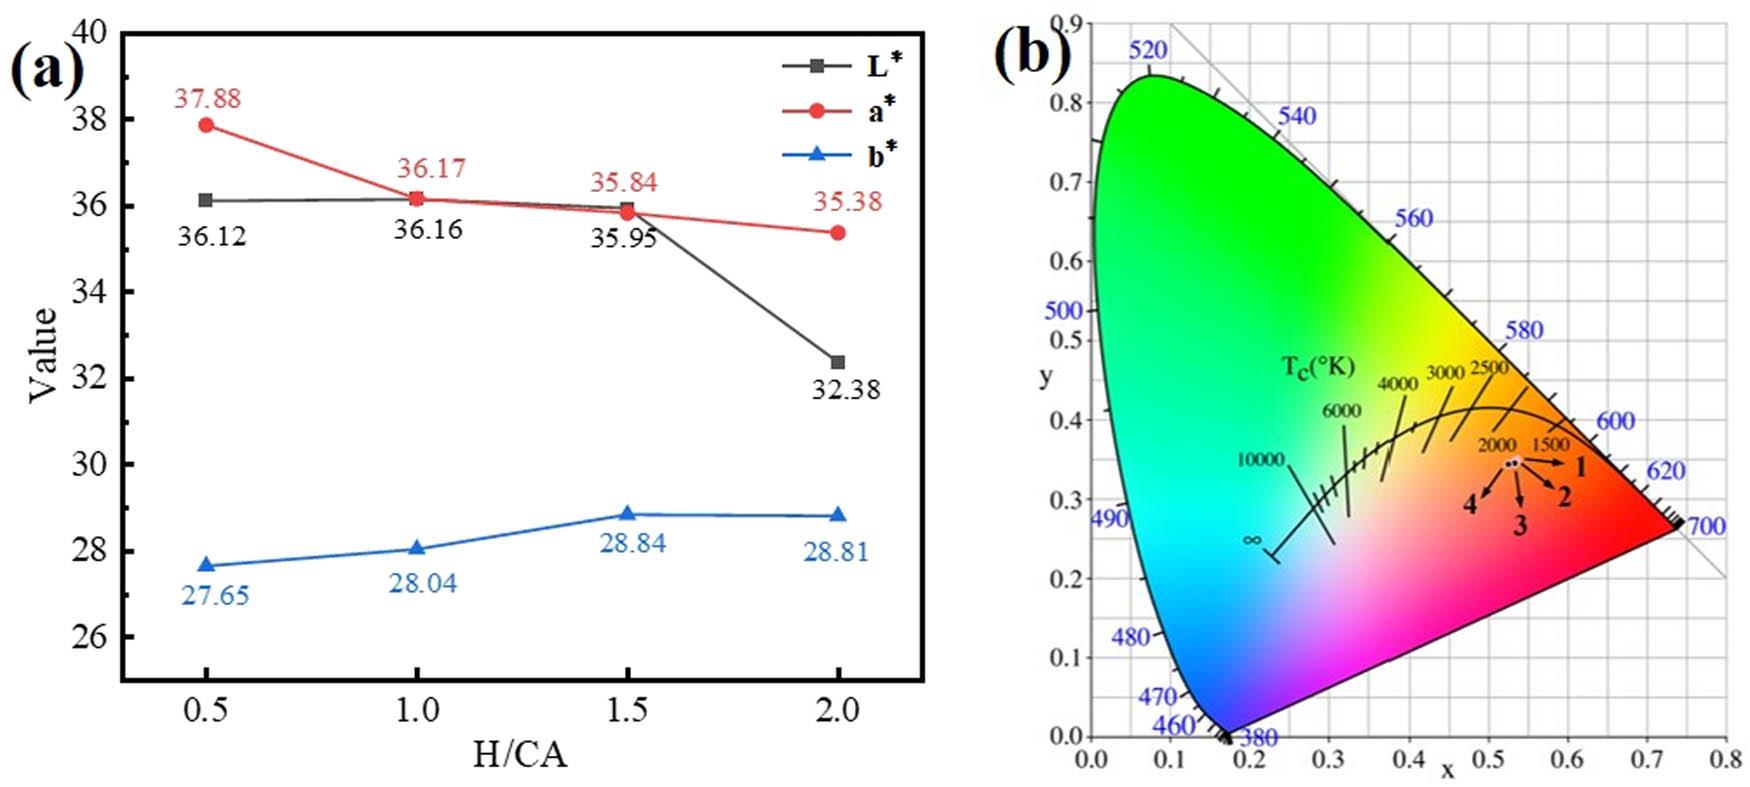
γ-Ce2S3 pigment prepared at different H/CA ratios: (a) chromaticity pattern and (b) CIE color gamut coordinates.
Chromaticity values and coordinates of the γ-Ce2S3 pigment prepared at different H/CA ratios
| H/CA | L* | a* | b* | (x, y) | Sample |
|---|---|---|---|---|---|
| 0.5 | 36.12 | 37.88 | 27.65 | (0.5354, 0.3491) |
|
| 1.0 | 36.16 | 36.17 | 28.04 | (0.5346, 0.3477) |
|
| 1.5 | 35.95 | 35.84 | 28.84 | (0.5338, 0.3459) |
|
| 2.0 | 32.38 | 35.38 | 28.81 | (0.5256, 0.3439) |
|
Figures 7 and 8 show the SEM images of the precursor before and after the addition of ethylene glycol, as well as the N2 adsorption–desorption isotherms analyzed using BET. From Figures 7 and 8, the adsorption capacity of the precursor isotherms prepared before and after the addition of ethylene glycol is concentrated in the high-pressure section, which indicates that there are a few micropores and small-volume pores in the material, and there are many large-volume mesopores with irregular pore structures. Table 3 reveals the specific surface area, pore volume, and pore diameter of the precursors at H/CA = 0.5 and EG/CA = 0.5. It can be observed that after the addition of ethylene glycol, the specific surface area of the precursor sample increased from 13.8358 to 22.3857 m2/g. The micropore volume increased from 0.078 to 0.092 cm3/g, while the average micropore diameter decreased from 20.21 to 17.20 nm. This indicates that under the conditions of complexation between ethylene glycol and CA, esterification reactions occurred concurrently. The resulting gel possesses a three-dimensional network structure, increasing the distance between particles. During the combustion, the molecules are easy to break off to accelerate the disintegration of the colloid, which reduces the agglomeration and adhesion ability of the powder, so that the precursor contains more and smaller mesopores, with a larger specific surface area and pore volume, which is more conducive to vulcanization. During the combustion, the molecules are easy to break off to accelerate the disintegration of the colloid, which reduces the agglomeration and adhesion ability of the powder, so that the precursor contains more and smaller mesopores, with a larger specific surface area and pore volume, which is more conducive to vulcanization.

SEM images of the precursors before and after adding ethylene glycol: (a) H/CA = 0.5 and (b) EG/CA = 0.5.

N2 adsorption–desorption isotherms of precursor BET before and after the addition of ethylene glycol: (a) H/CA = 0.5 and (b) EG/CA = 0.5.
Specific surface area, pore volume, and pore diameter of the precursors at H/CA = 0.5 and EG/CA = 0.5
| EG/CA | BET surface area (m2/g) | Pore volume (cm3/g) | Average pore size (nm) |
|---|---|---|---|
| H/CA = 0.5 | 13.8358 | 0.078 | 20.21 |
| EG/CA = 0.5 | 22.3857 | 0.092 | 17.20 |
Figure 9 shows the SEM images and particle size distribution diagram of the pigment with different EG/CA ratios. It can be seen from Figure 9(a)–(d) that with an increase in ethylene glycol, the particle morphology of vulcanized samples is coral-like, and the particle size is gradually increasing. From Figure 5(e)–(h), the average particle sizes of the samples with EG/CA = 0.5, 1.0, and 1.5 are 380, 410, and 460 nm, respectively, and they increase with an increase of ethylene glycol. All samples have good dispersibility. When EG/CA = 0.5, the particle size in the range of 300–400 nm accounts for 73%, and the particle size range distribution is narrow. When EG/CA = 1.0, the proportion of particle size in the range of 300–400 nm is close to that of EG/CA = 0.5, but it also accounts for 15% around 500 nm, and the particle size range presents a jump distribution, which is unfavorable to the uniformity of pigment dispersion. When EG/CA = 1.5, the particle size distribution of the sample is concentrated in the range of 350–550 nm. It can be seen from Figure 9(c) that the pigment particles gather in a small range, and larger particles appear compared with EG/CA = 0.5 and 1.0, which is not conducive to the dispersion of the pigment. When the ratio of EG/CA is 2.0, the average particle size of the sample is 720 nm, and the particle size range of the pigment suddenly widens, accounting for 83% in the range of 400–800 nm, accompanied by the increase of large particles. It can be seen from Figure 9(d) that the particle size distribution of the pigment particles is wide, and the large and small particles are staggered, which seriously deviates from the accuracy of the average particle size of the pigment and is unfavorable to the dispersibility of the pigment.

SEM images of the pigments with different EG/CA and particle size distribution maps: (a)–(d) EG/CA = 0.5, 1.0, 1.5, and 2.0; (e)–(h) EG/CA = 0.5, 1.0, 1.5, and 2.0.
Figure 10(a) and (b) shows chromaticity and CIE color gamut coordinates of γ-Ce2S3 pigments prepared at different EG/CA ratios, and the corresponding data are shown in Table 4. As shown in Figure 10(a) and Table 4, the gradual increase of ethylene glycol has little influence on the lightness L*, but it has great influence on the redness a*, which can be seen from the remarkable decline curve of redness a* in Figure 10(a), and the color gamut coordinate diagram in Figure 10(b) also corresponds to it. Therefore, when EG/CA = 0.5, the pigment chromaticity reaches the best value: L* = 37.99, a* = 40.21, and b* = 29.81.
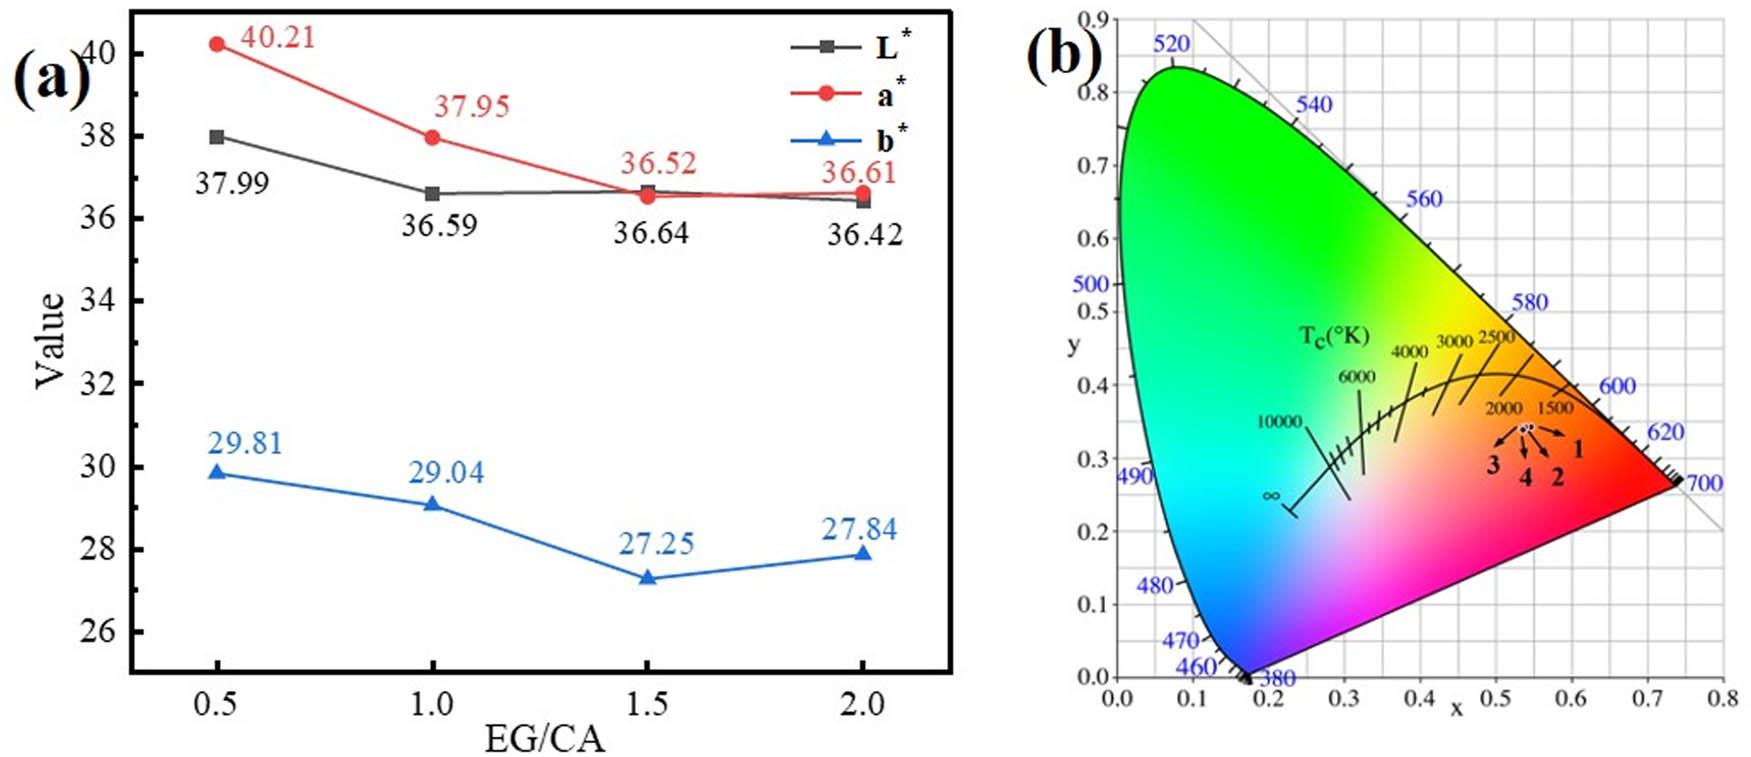
γ-Ce2S3 pigment prepared at different EG/CA ratios: (a) chromaticity pattern and (b) CIE color gamut coordinates.
Chromaticity values and coordinates of the γ-Ce2S3 pigment prepared at different EG/CA ratios
| EG/CA | L* | a * | b * | (x, y) | Sample |
|---|---|---|---|---|---|
| 0.5 | 37.99 | 40.21 | 29.81 | (0.5465, 0.3426) |
|
| 1.0 | 36.59 | 37.95 | 29.04 | (0.5388, 0.3427) |
|
| 1.5 | 36.64 | 36.52 | 27.25 | (0.5343, 0.3415) |
|
| 2.0 | 36.42 | 36.61 | 27.84 | (0.5365, 0.3387) |
|
Figure 11 shows the ultraviolet-visible light reflectance spectrum at H/CA = 0.5 and different EG/CA vulcanization products. It can be seen from the figure that in the 400–550 nm wavelength region, the reflectance of all samples for blue and green light is lower than 15%. Therefore, the pigment did not exhibit blue or green coloration. Among them, the reflectance of vulcanized products with EG/CA = 0.5 is 77% at 650–700 nm (red area) because the sample particle size is the smallest, which is beneficial to improve the diffuse reflectance of red light, leading to the increase of redness and lightness of the sample. When EG/CA = 1.0 and H/CA = 0.5, the reflectivity values of the vulcanized product at 650–700 nm (red area) are 71 and 69%, respectively, and the color of the sample is deep red; EG/CA = 1.5 and EG/CA = 2.0 make the visible light reflectance of the vulcanized products at 650–700 nm (red area) 64 and 65%, respectively. The samples’ lightness and redness decrease as a result of the coarse particles and more carbon remains after the combustion of CA and ethylene glycol.
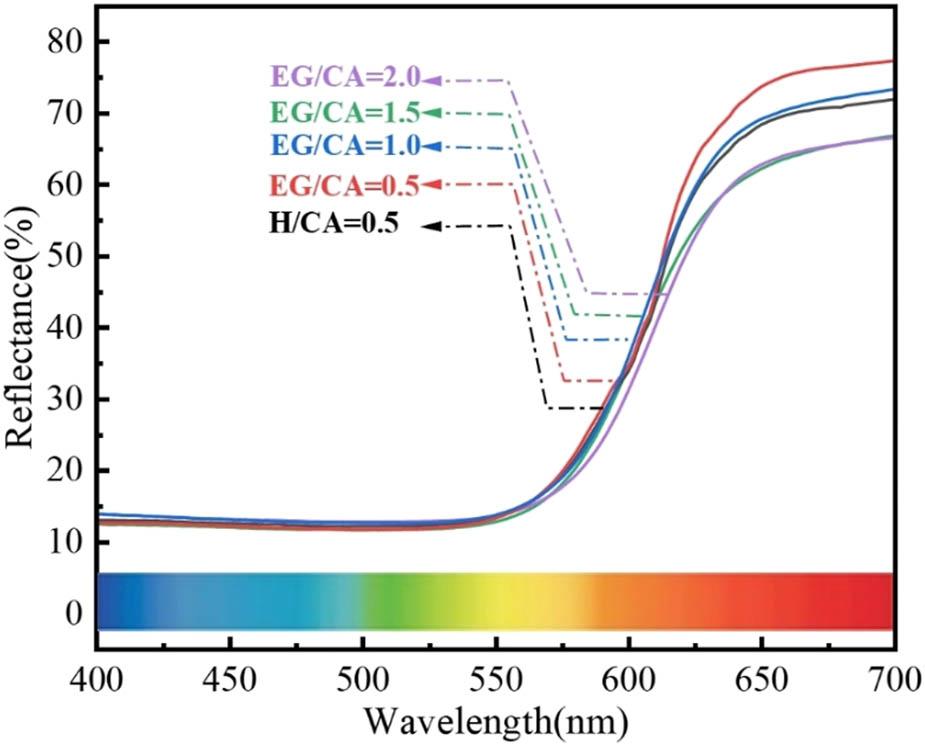
UV-Vis reflection spectra of vulcanized products with EG/CA and H/CA = 0.5.
The temperature stability of the products after vulcanization with H/CA = 0.5 and EG/CA = 0.5 was tested by thermogravimetric-differential thermal analysis (TG-DTA). The test range is from room temperature to 1,000°C (under air atmosphere), and the corresponding test curve is shown in Figure 12. No obvious exothermic peak was visible when all samples were below 400°C. Because the pigment samples reacted with oxygen to form sulfur oxides, the pigment samples with H/CA = 0.5 and EG/CA = 0.5 showed clear exothermic peaks at 491.4 and 484.6°C, respectively, and the sample mass increased by 16.89 and 18.93%. The sample quality then decreased as a result of the sulfur and oxygen compounds breaking down at a high temperature to produce SO2 gas and CeO2. The samples with H/CA = 0.5 and EG/CA = 0.5 have no mass loss below 400°C; however, pure γ-Ce2S3 has a temperature stability of only 350°C in an air atmosphere. Furthermore, the EG/CA = 0.5 sample has smaller particles than the H/CA = 0.5 sample, increasing the contact area between the pigment and oxygen during heating. This directly promotes the pigment-oxygen reaction, speeding up the oxidation process. Consequently, the sample’s thermal stability slightly decreased, indicating that a decrease in the particle size will result in a decrease in the pigment’s resistance to temperature changes.

TG-DTA curves of vulcanized products with (a) H/CA = 0.5 and (b) EG/CA = 0.5.
By modifying the amount of CA, the ratio of the oxidant to fuel, and adding ethylene glycol to form a complexing agent, the Na+-doped γ-Ce2S3 red pigment was produced with the chemical formula γ-Na0.5Ce2.5S4. The temperature was maintained at 900°C for 2 h while CS2 was used as a sulfur source. A bright red pigment (L* = 36.12, a* = 37.88, b* = 27.65) with a particle size of 460 nm was synthesized at pH = 7, CA/M = 2.0, and H/CA = 0.5 using CA as a complexing agent and a low-temperature combustion synthesis process. After the addition of ethylene glycol, the specific surface area of the sample precursor increased from 13.8358 to 22.3857 m2/g, which is more conducive to vulcanization. The vulcanization product’s particle size decreased to 380 nm, and the colorant’s redness value increased (L* = 37.99, a* = 40.21, b* = 29.81). The red area’s reflectivity increased from 67 to 77%, making the sample more vivid and bright, but the color material’s temperature stability slightly decreased.
This work was supported by the Project supported by National Natural Science Foundation of China (51462010), Natural Science Foundation of Jiangxi, China (No. 20212BAB203024, 20202BABL204015, 20171ACB20022).
Boyuan Wu: Conceptualization, Methodology, Writing-original draft; Yueming Li: Supervision, Resources, Data curation; Fusheng Song: Writing–review & editing; Haining Wang and Yi Sun: Investigation; Kai Li: Visualization; Zhumei Wang: Methodology, Investigation. All authors read and approved the manuscript.
The authors declare that they have no known competing financial interests or personal relationships that could have appeared to influence the work reported in this paper.
All data generated or analyzed during this study are included in this published article. The data incorporated in this study are available upon request from the corresponding author.