
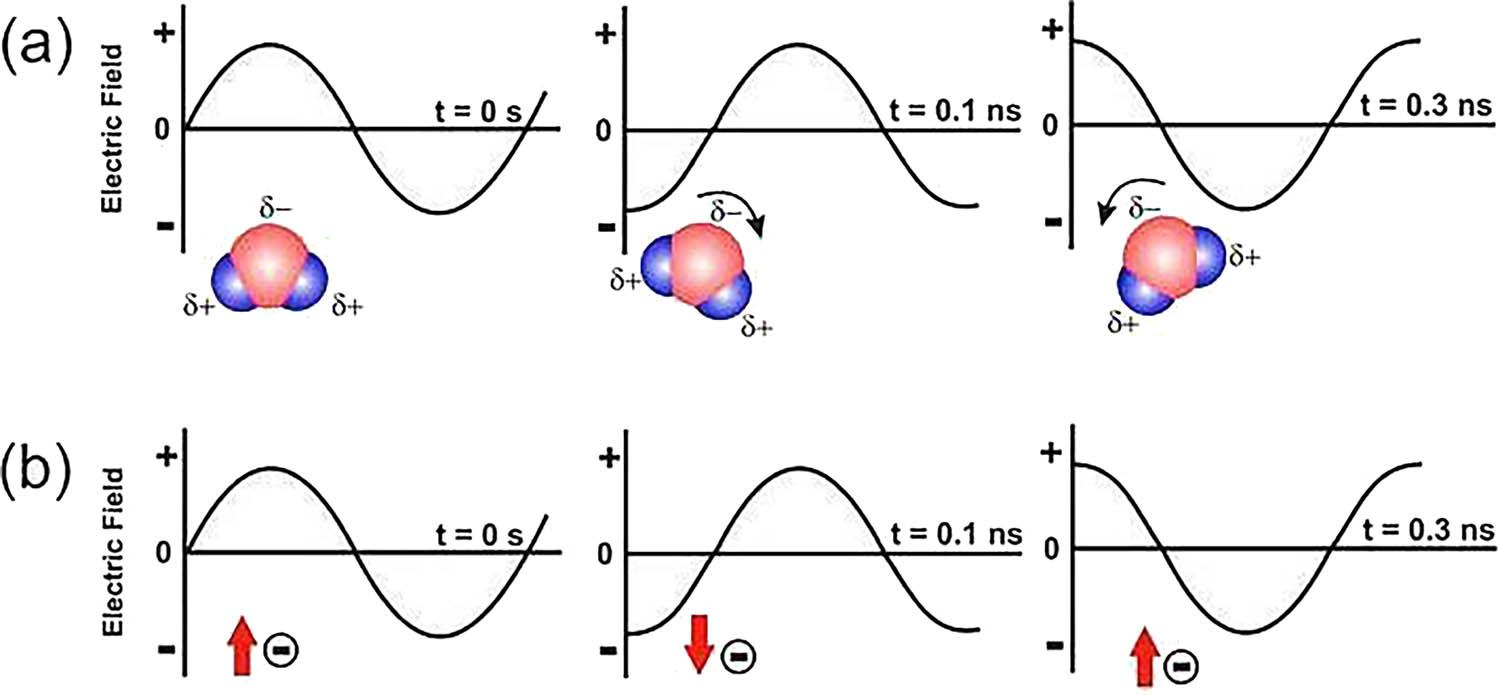
Figure 1
MW heating mechanism corresponding to (a) dipolar polarisation and (b) ionic conduction.
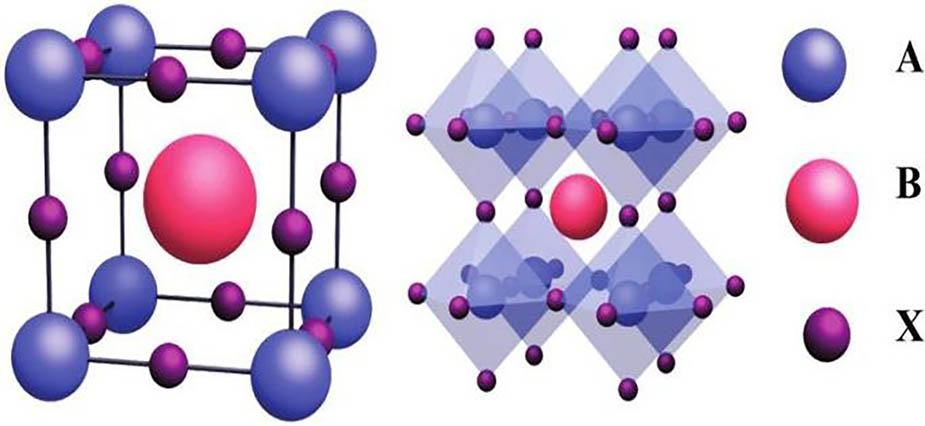
Figure 2
Ideal cubic perovskite structure (ABO3).
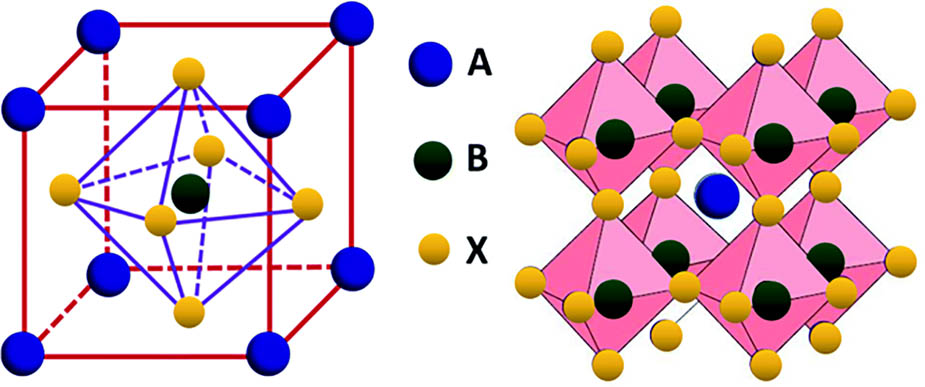
Figure 3
Perovskite structure.
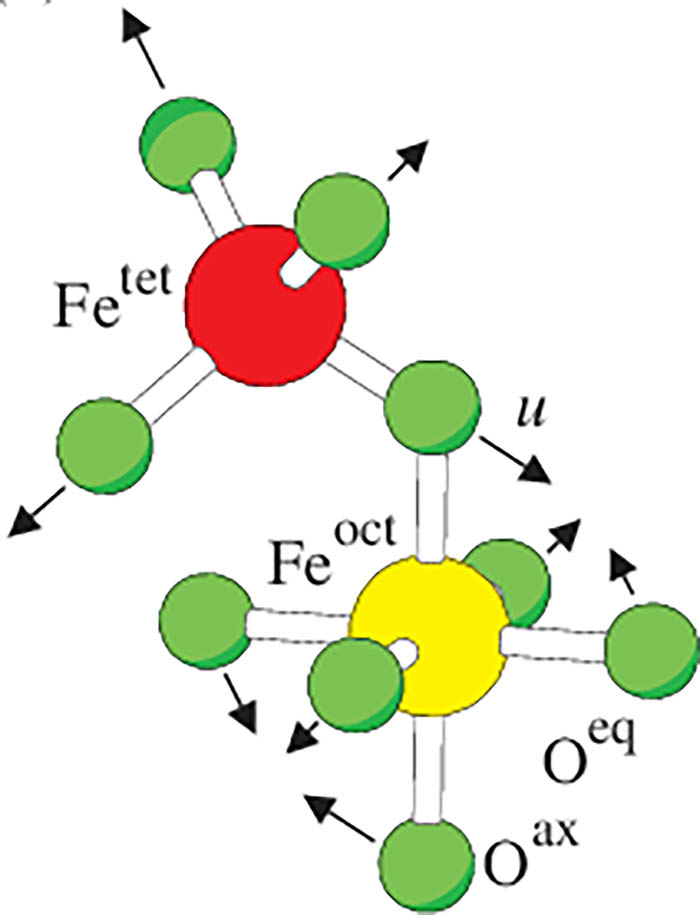
Figure 4
Image of spinel oxide.
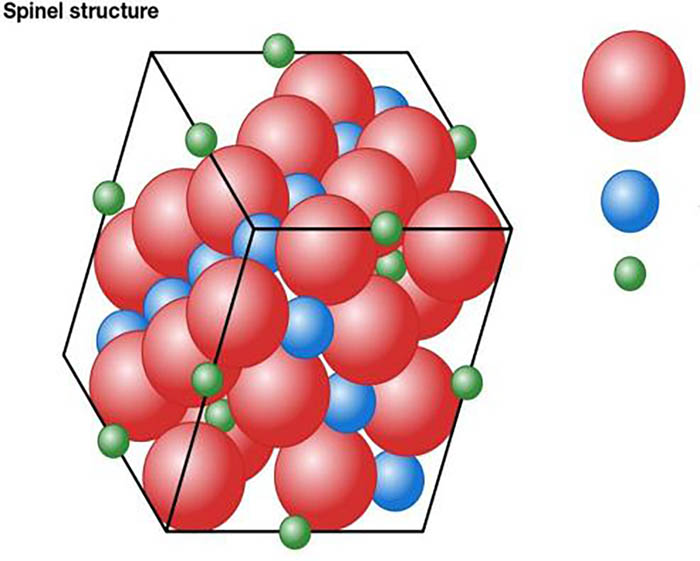
Figure 5
Spinel crystal.
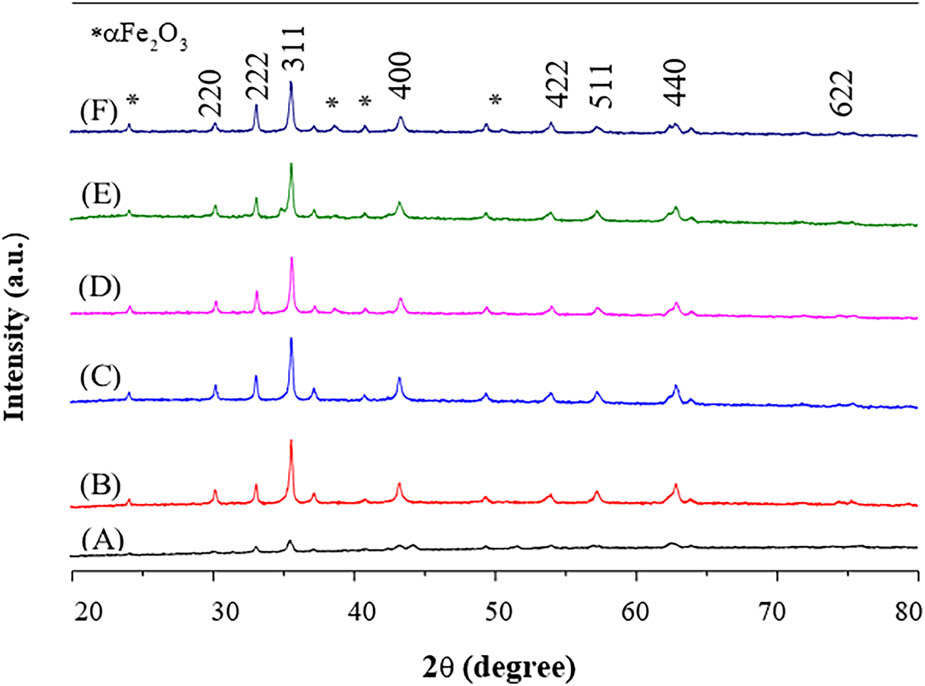
Figure 6
XRD plot of Ni1−x Mg x Fe2O4 (0 ≤ x ≤ 0.5) samples.
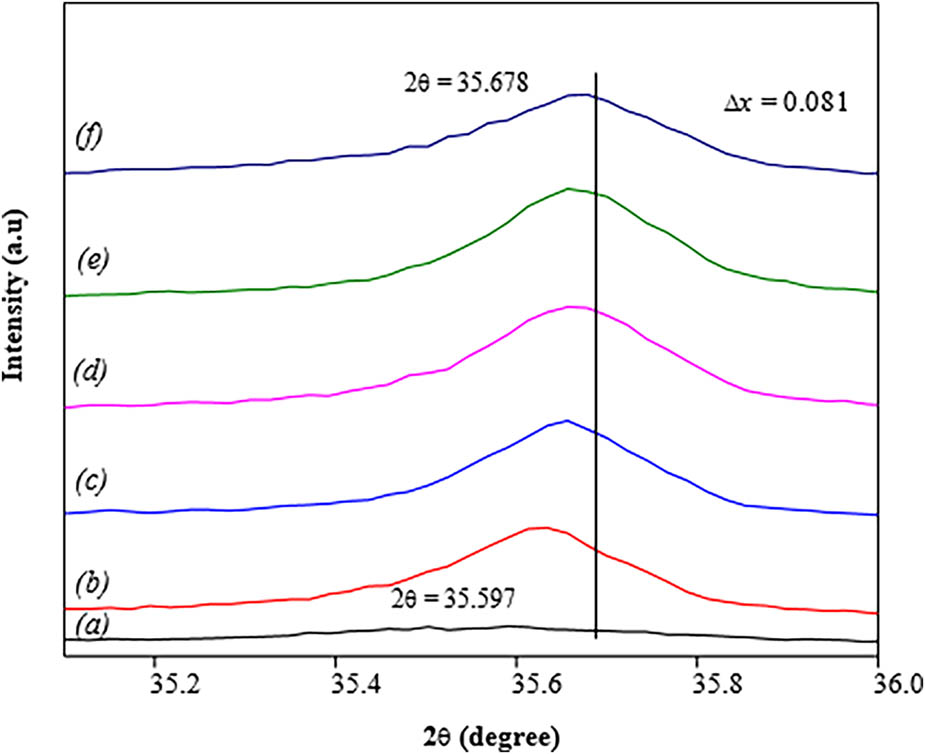
Figure 7
Peak shift of Ni1−x Cu x Fe2O4 (0 ≤ x ≤ 0.5) samples.
Table 1
Sample code, crystallite size, lattice parameter, and band gap values of Ni1−x Mg x Fe2O4 (0 ≤ x ≤ 0.5) samples.
| Sample | Sample code | L (nm) | D (nm) | a (Å) | Eg (eV) |
|---|---|---|---|---|---|
| NiFe2O4 | A | 20 | 20 | 8.380 | 3.35 |
| Ni0.9Mg0.1Fe2O4 | B | 22 | 21 | 8.377 | 3.29 |
| Ni0.8Mg0.2Fe2O4 | C | 24 | 23 | 8.374 | 3.25 |
| Ni0.7Mg0.3Fe2O4 | D | 27 | 25 | 8.371 | 2.97 |
| Ni0.6Mg0.4Fe2O4 | E | 29 | 27 | 8.368 | 2.73 |
| Ni0.5Mg0.5Fe2O4 | F | 31 | 30 | 8.365 | 2.32 |
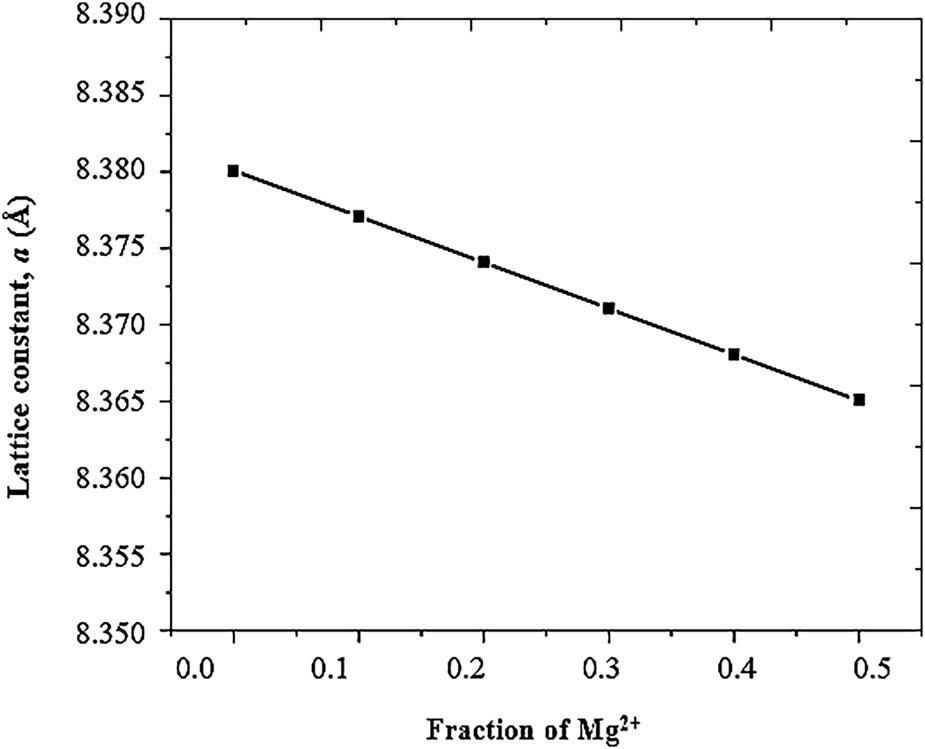
Figure 8
Lattice parameter variation in Ni1−x Cu x Fe2O4 (0 ≤ x ≤ 0.5) samples.
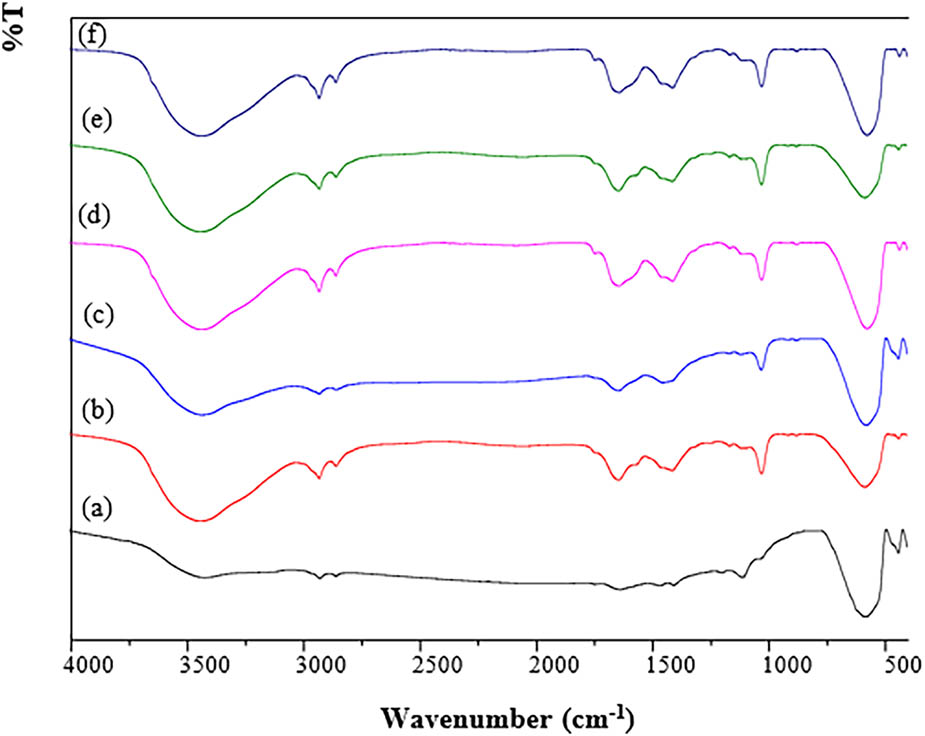
Figure 9
FTIR spectra of Ni1−x Mg x Fe2O4 (0 ≤ x ≤ 0.5) samples.
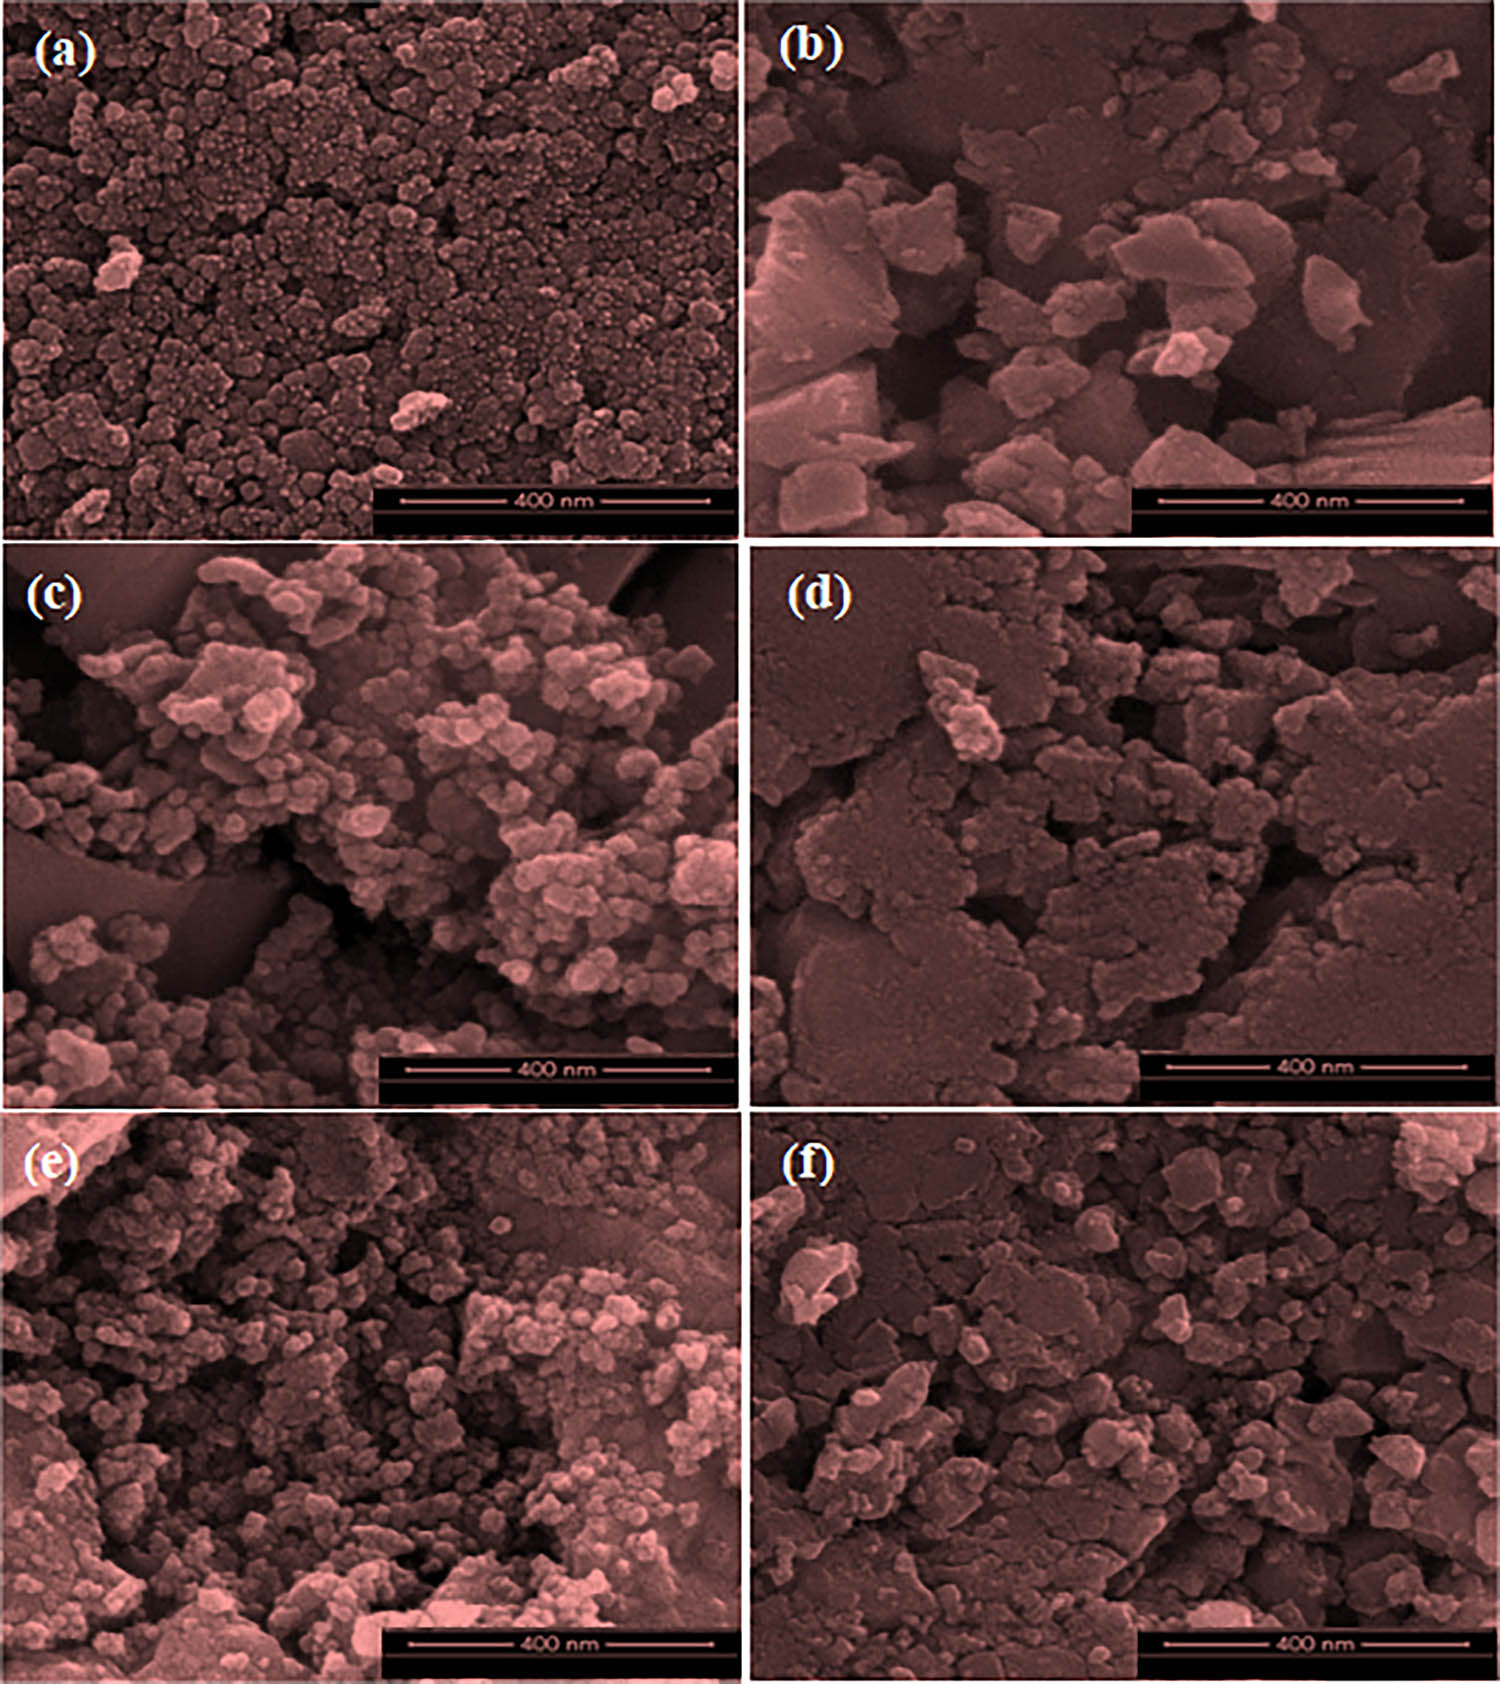
Figure 10
HR-SEM images of (a) Ni1Mg0Fe2O4, (b) Ni0.9Mg0.1Fe2O4, (c) Ni0.8Mg0.2Fe2O4, (d) Ni0.7Mg0.3Fe2O4, (e) Ni0.6Mg0.4Fe2O4, and (f) Ni0.5Mg0.5Fe2O4 samples.
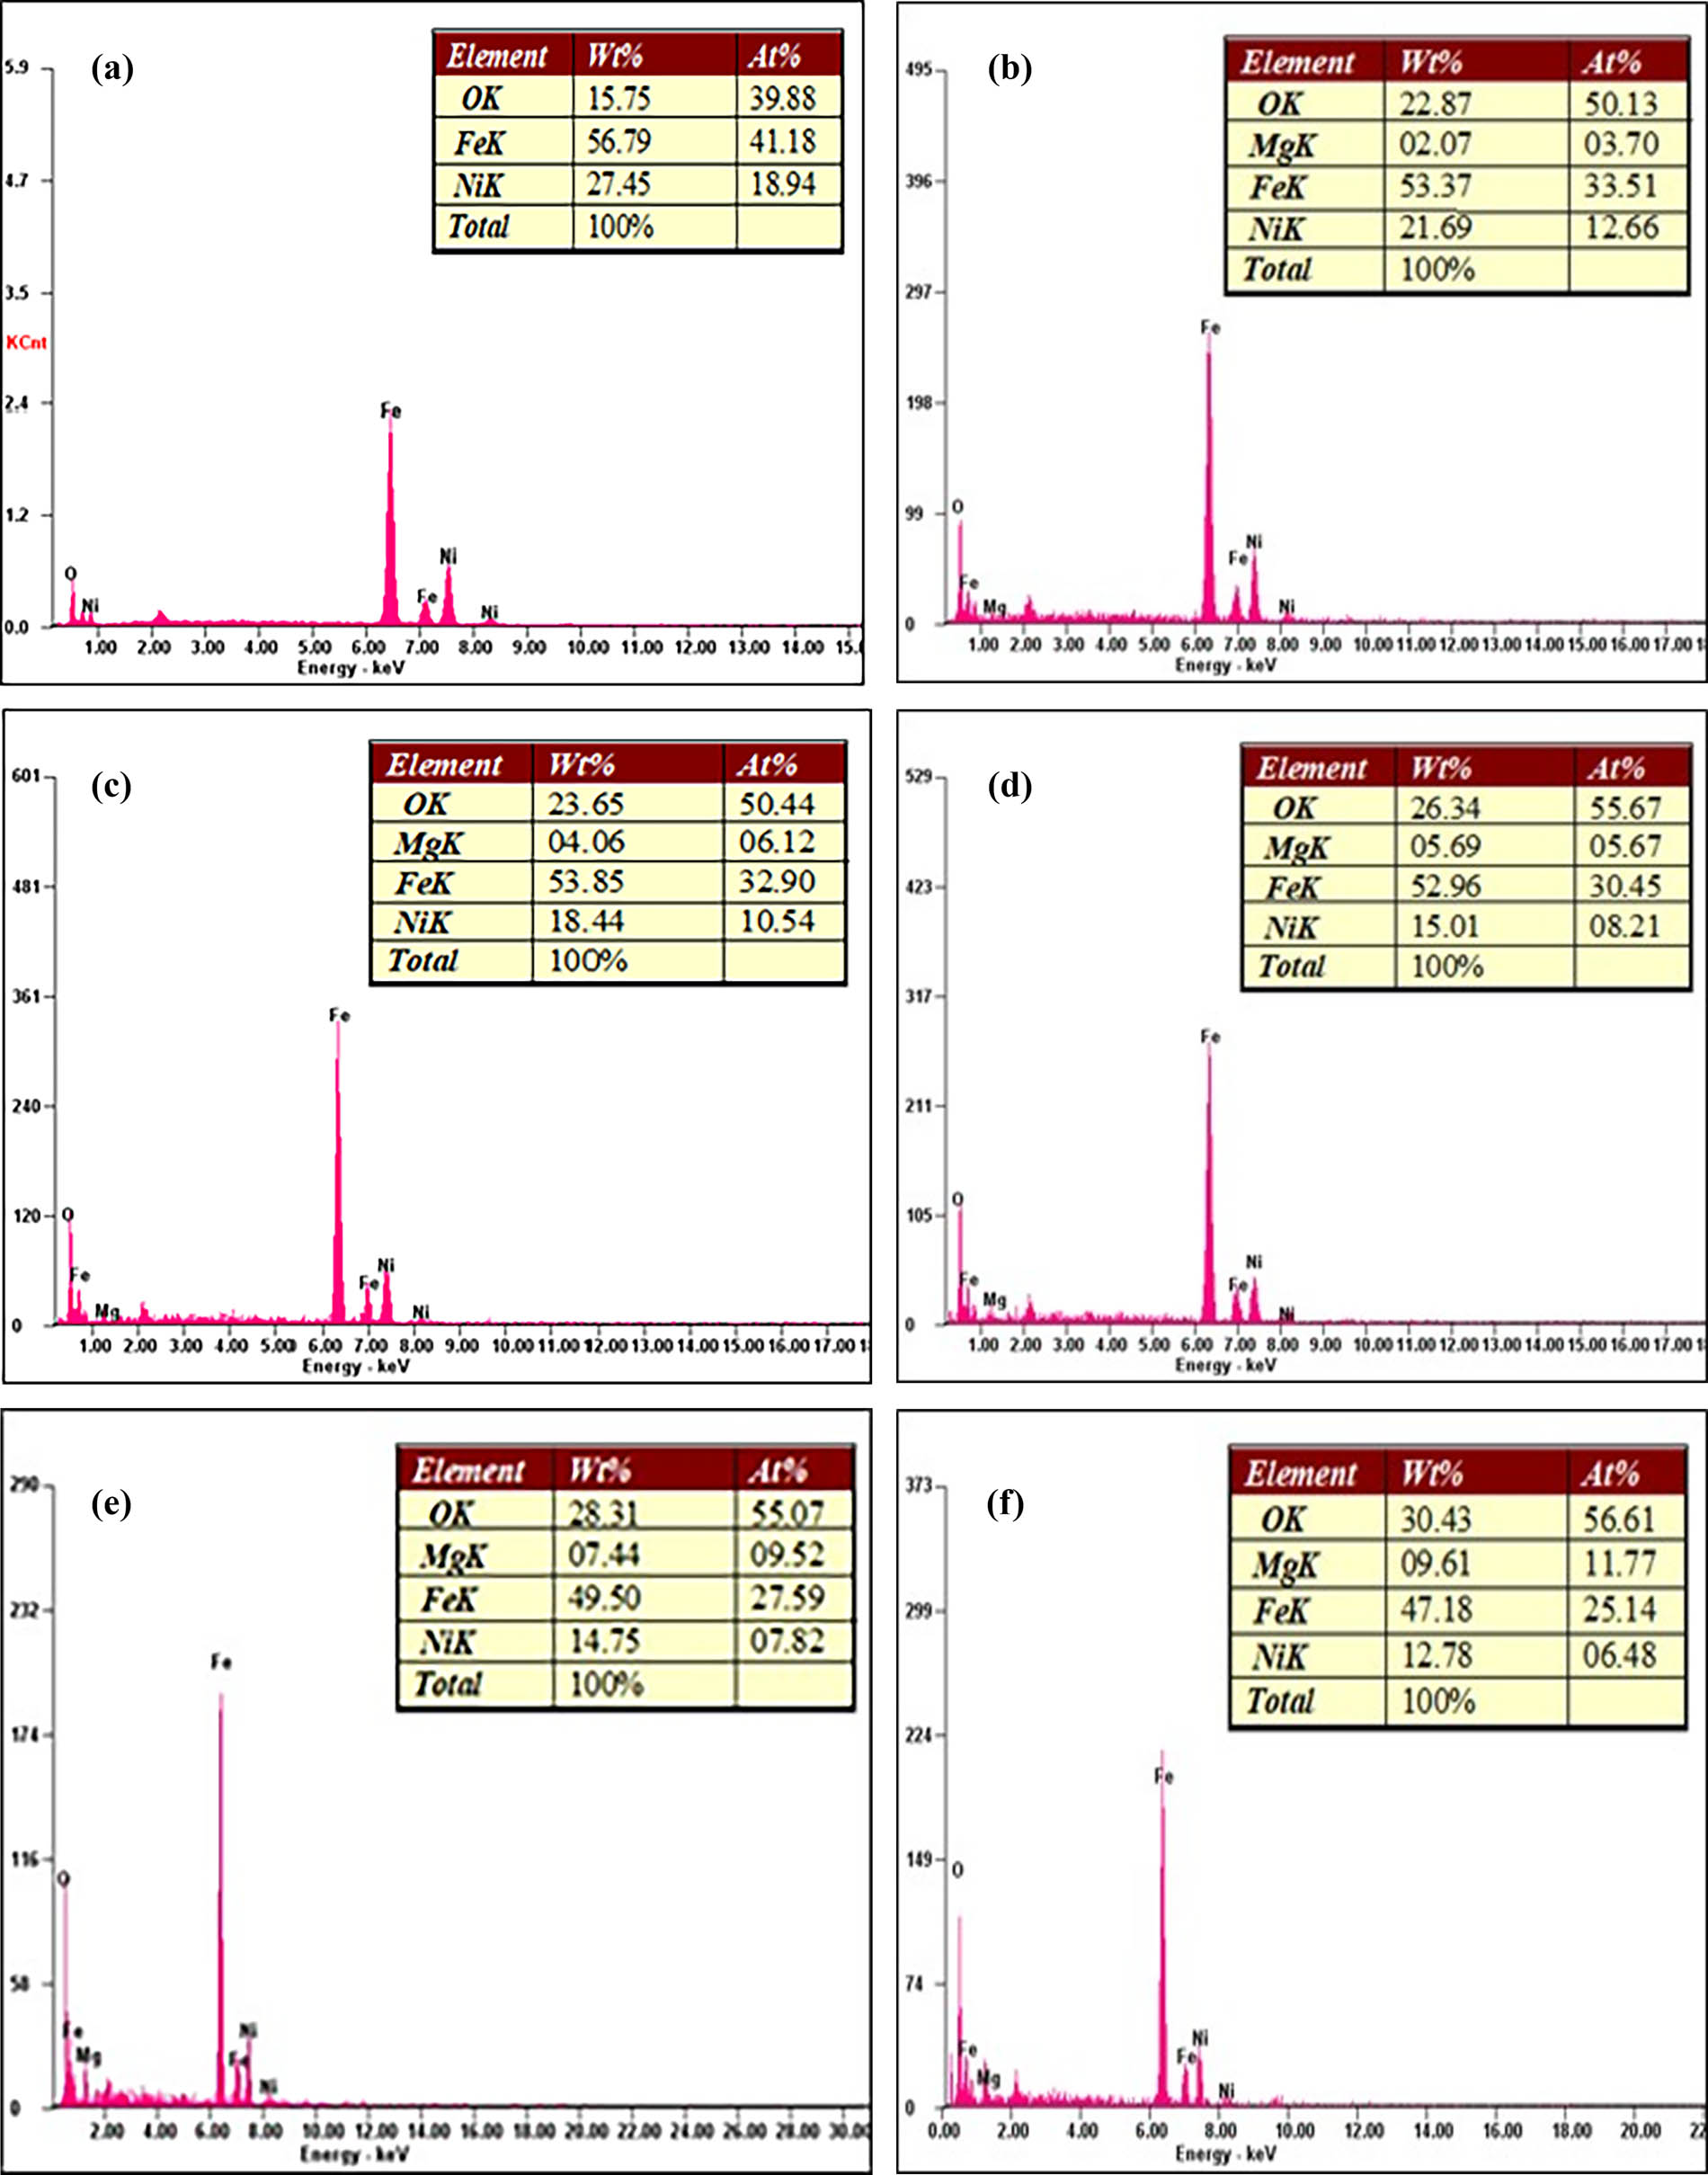
Figure 11
EDX images of (a) Ni1Mg0Fe2O4, (b) Ni0.9Mg0.1Fe2O4, (c) Ni0.8Mg0.2Fe2O4, (d) Ni0.7Mg0.3Fe2O4, (e) Ni0.6Mg0.4Fe2O4, and (f) Ni0.5Mg0.5Fe2O4 samples.
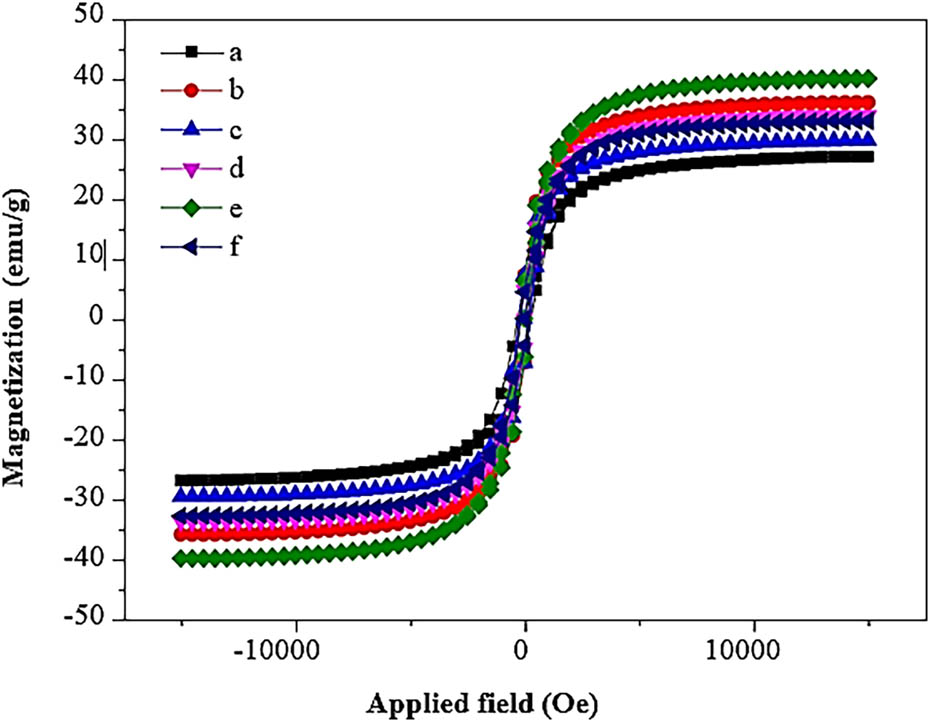
Figure 12
Magnetic hysteresis of Ni1−x Mg x Fe2O4 (0 ≤ x ≤ 0.5) samples.
Table 2
Hc, Mr, and Ms values of Ni1–x Mg x Fe2O4 (0 ≤ x ≤ 0.5) nanoparticles.
| Sample code | Hc (Oe) | Mr (emu/g) | Ms (emu/g) |
|---|---|---|---|
| A | 337.01 | 5.21 | 17.37 |
| B | 502.14 | 5.45 | 18.24 |
| C | 171.11 | 5.54 | 20.94 |
| D | 217.08 | 6.17 | 22.35 |
| E | 195.29 | 7.35 | 25.79 |
| F | 158.77 | 6.52 | 24.72 |
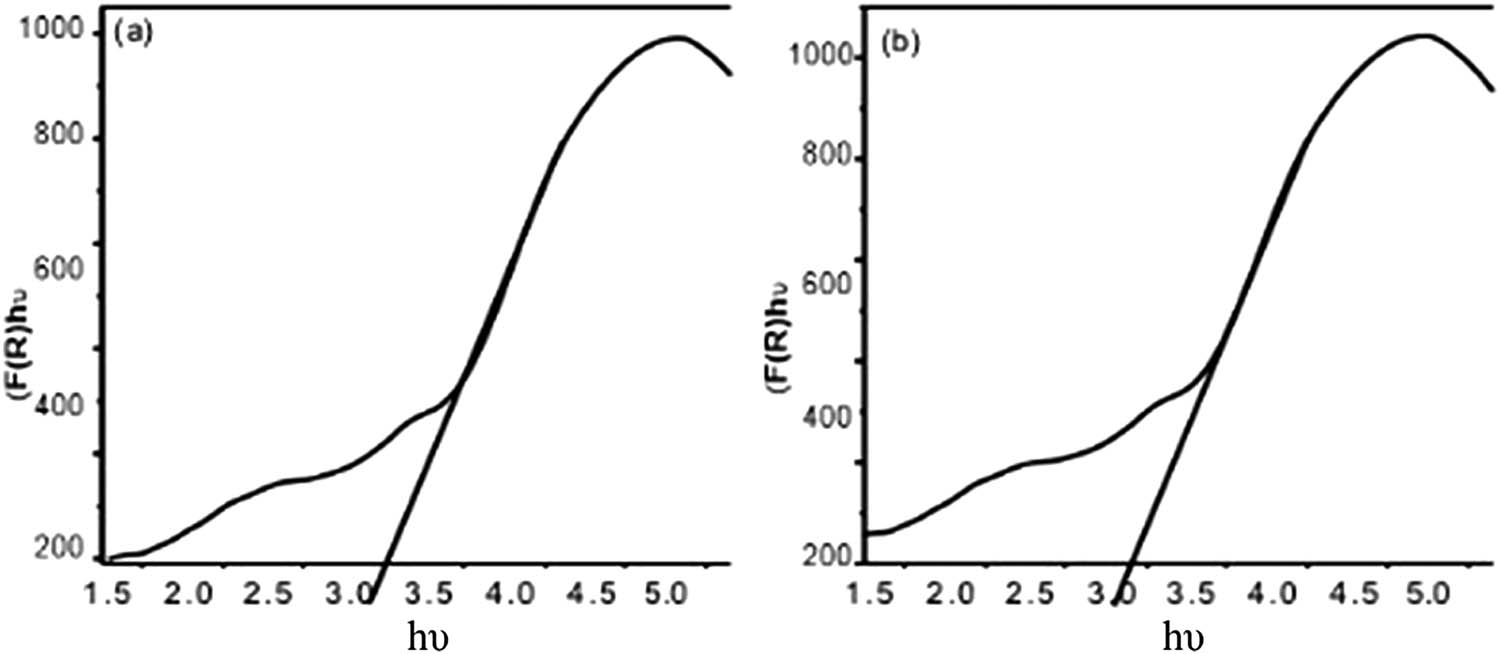
Figure 13
(F(R)hν)2 versus hν plots Ni1–x Mg x Fe2O4 (0 ≤ x ≤ 0.5) for (a) A sample and (b) F sample.
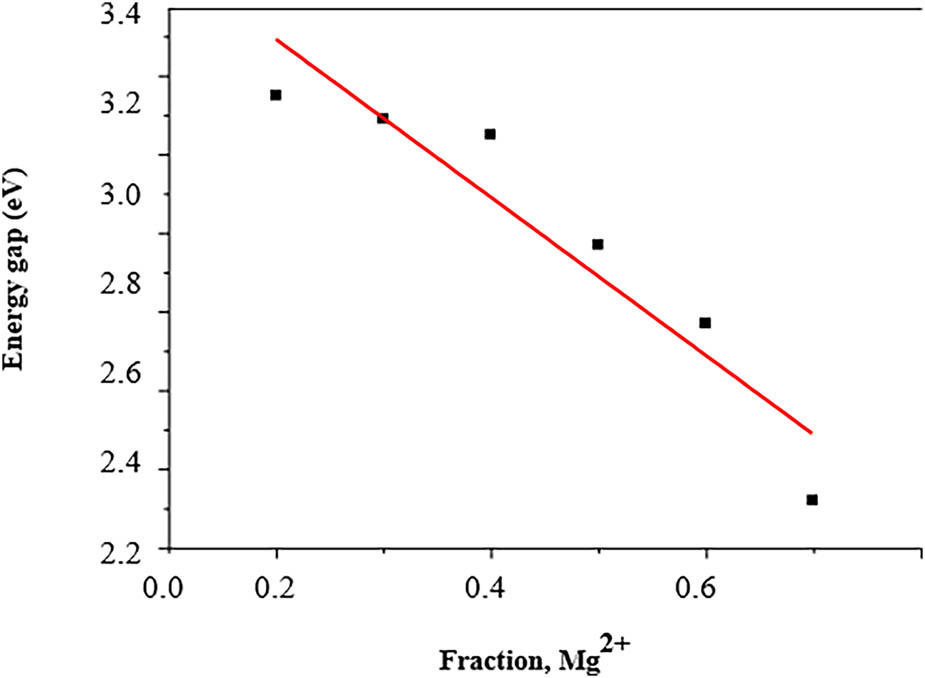
Figure 14
Mg2+ fraction vs energy gap of Ni1−x Mg x Fe2O4 (0 ≤ x ≤ 0.5) samples.