
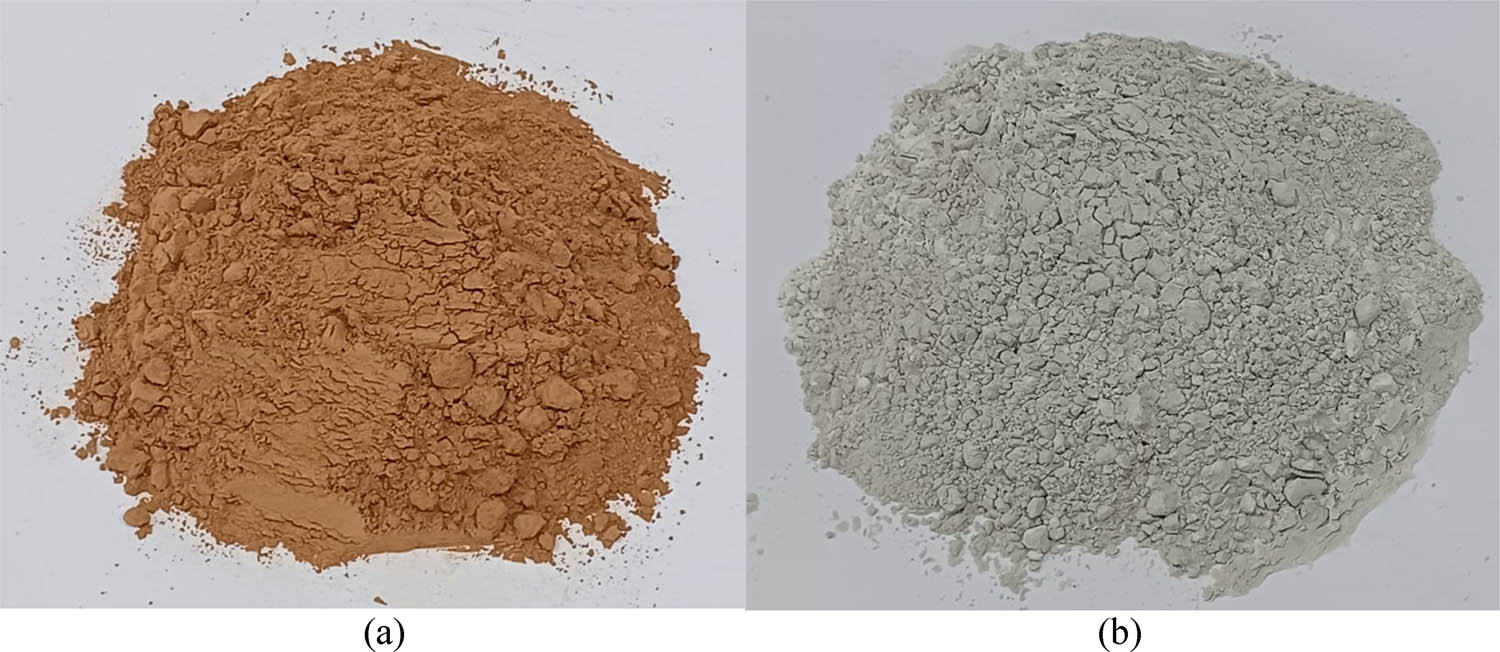
Figure 1
Waste sources of aluminosilicates. (a) WBP and (b) GGBS.
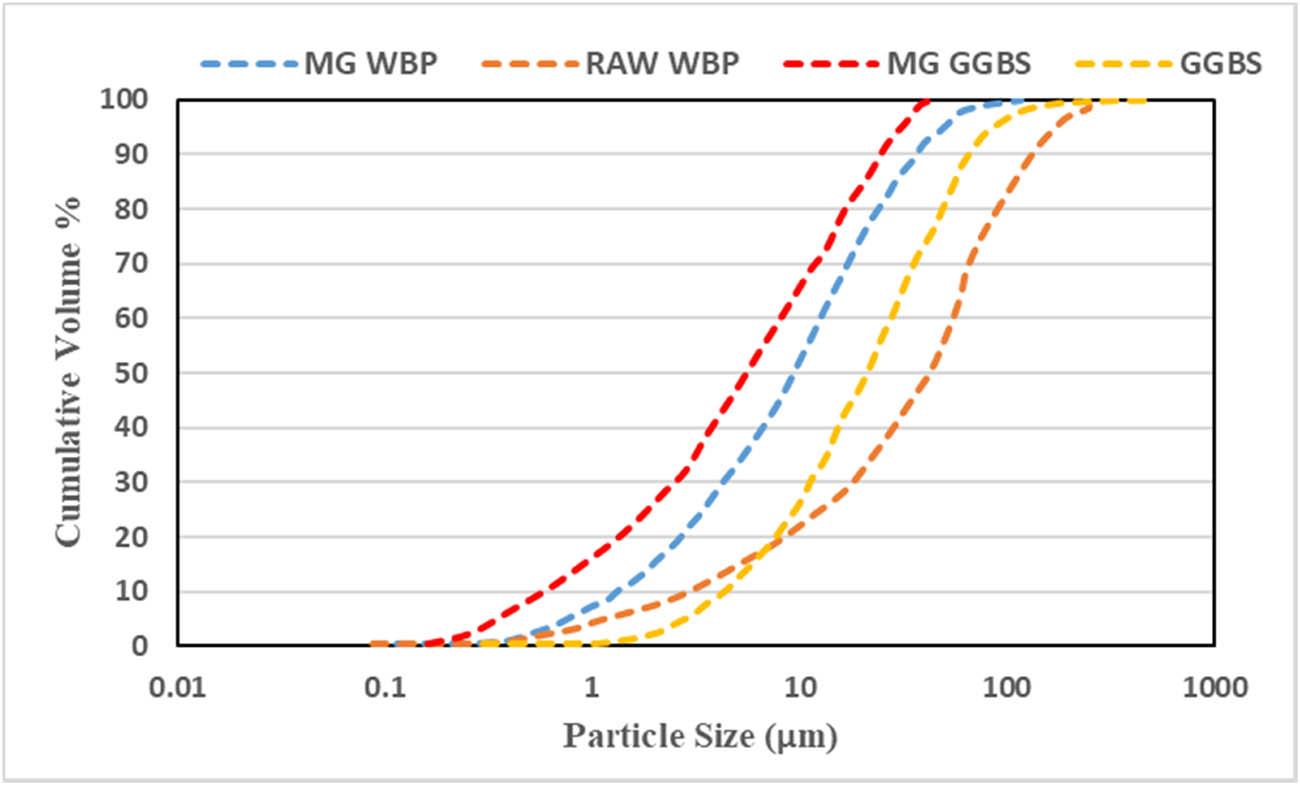
Figure 2
Particle size distribution of grout materials.
Table 1
Properties of WBP, GGBS, and sodium silicate.
| Constituent (%) | GGBS | WBP | (Na2SiO3-Penta) powder | (Na2SiO3) liquid |
|---|---|---|---|---|
| (a) Chemical composition | ||||
| CaO | 34.15 | 9.8 | ||
| SiO2 | 40.42 | 55.5 | 28 | 29.4 |
| Al2O3 | 10.6 | 17 | ||
| Fe2O3 | 1.28 | 5.5 | ||
| MgO | 7.63 | 2.6 | ||
| SO3 | 0.68 | 1.92 | ||
| K2O | 0.0128 | 1.58 | ||
| Na2O | 0.64 | 0.65 | 29 | 14.7 |
| Modulus ratio | 1 | 2 | ||
| H2O | 43 | 55.9 | ||
| (b) Physical properties | ||||
| Specific surface area (m2/g) | 1.46 | 0.72 | ||
| D 50 (µm) | 21.6 | 42.25 | ||
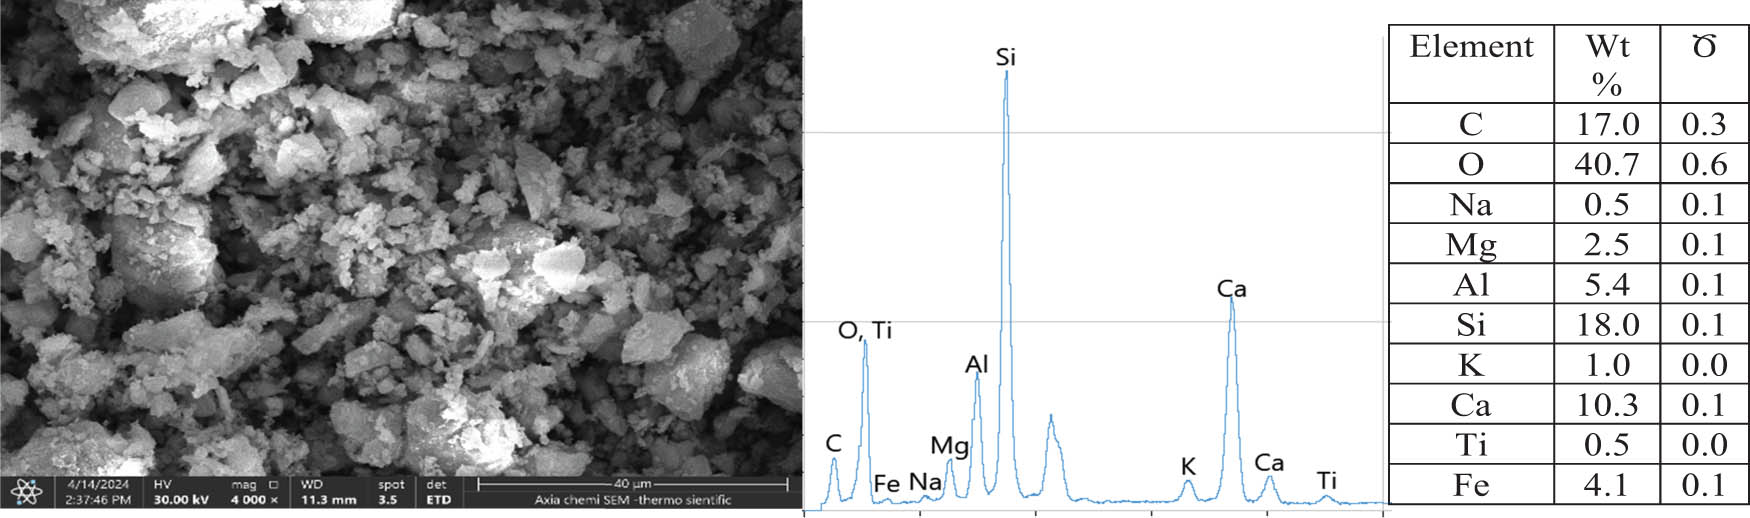
Figure 3
EDS analysis of WBP powders.
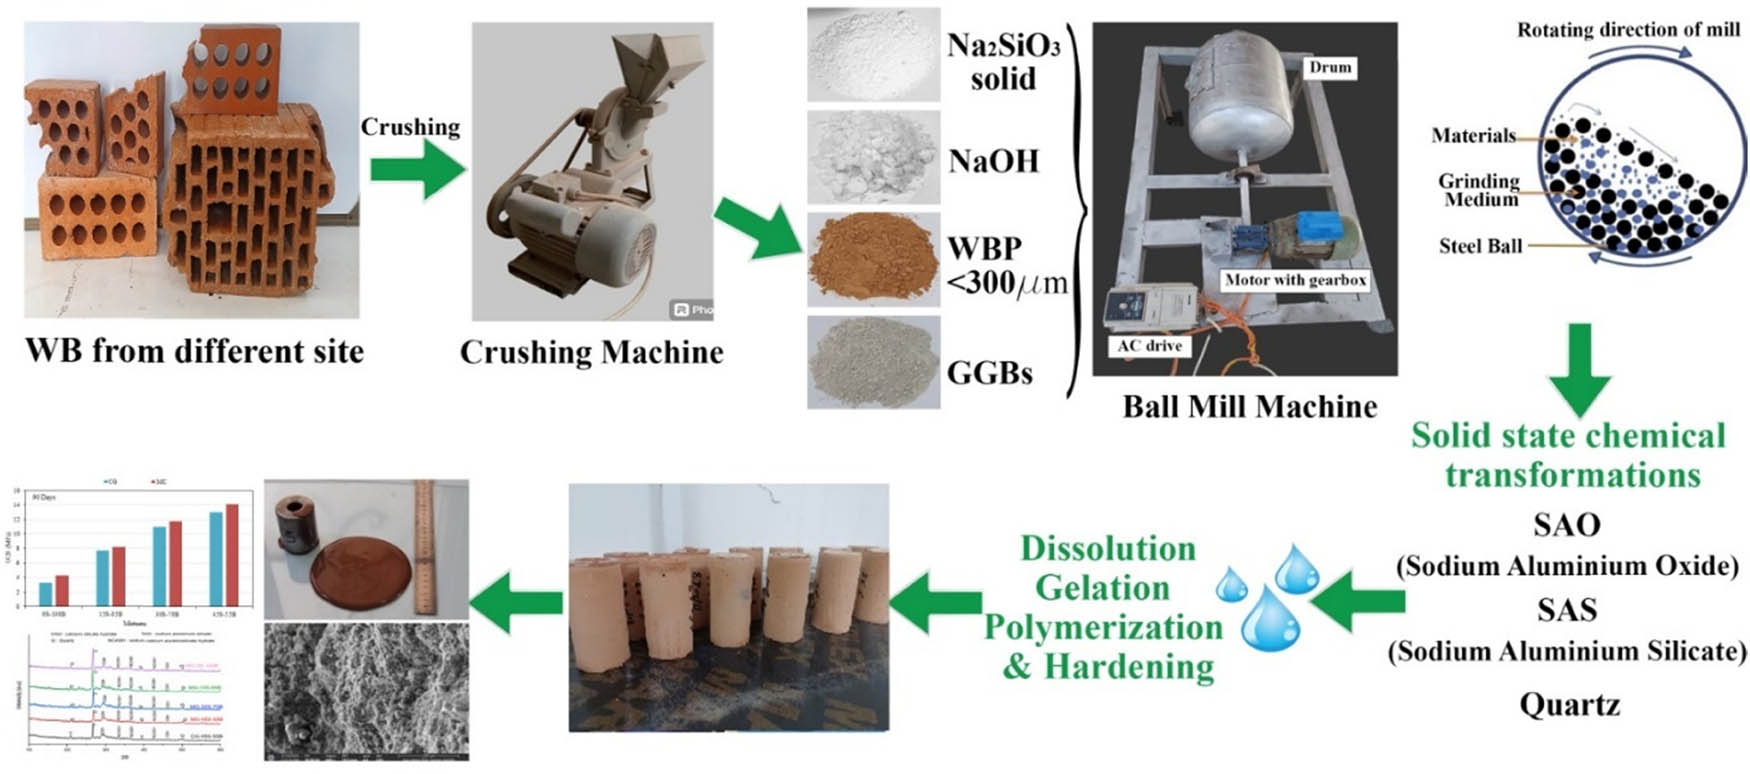
Figure 4
Process of producing a geopolymer binder through mechanochemical activation.
Table 2
Mixing proportions of CG- and MG-based grouts.
| Weight (%) | Weight (g) | ||||||||||||
|---|---|---|---|---|---|---|---|---|---|---|---|---|---|
| Aluminosilicate materials | Alkaline activator | Na2SiO3 /NaOH | Aluminosilicate materials | Alkaline activator | w/b ratio | Ball-Mill duration (h) | NaOH molarity | ||||||
| Activation type | Mix ID | WBP | GGBSF | NaOH | Na2SiO3 | WBP | GGBSF | NaOH | Na2SiO3 | ||||
| MG | MG-0S-100B | 80 | 0 | 10 | 10 | 1 | 800 | 0 | 100 | 100 | 500 | 2 | 5 |
| MG-15S-85B | 68 | 12 | 10 | 10 | 1 | 680 | 120 | 100 | 100 | 500 | |||
| MG-30S-70B | 56 | 24 | 10 | 10 | 1 | 560 | 240 | 100 | 100 | 500 | |||
| MG-45S-55B | 44 | 36 | 10 | 10 | 1 | 440 | 360 | 100 | 100 | 500 | |||
| CG | CG-0S-100B | 80 | 0 | 10 | 10 | 1 | 800 | 0 | 100 | 100 | 500 | — | 5 |
| CG-15S-85B | 68 | 12 | 10 | 10 | 1 | 680 | 120 | 100 | 100 | 500 | — | ||
| CG-30S-70B | 56 | 24 | 10 | 10 | 1 | 560 | 240 | 100 | 100 | 500 | — | ||
| CG-45S-55B | 44 | 36 | 10 | 10 | 1 | 440 | 360 | 100 | 100 | 500 | — | ||
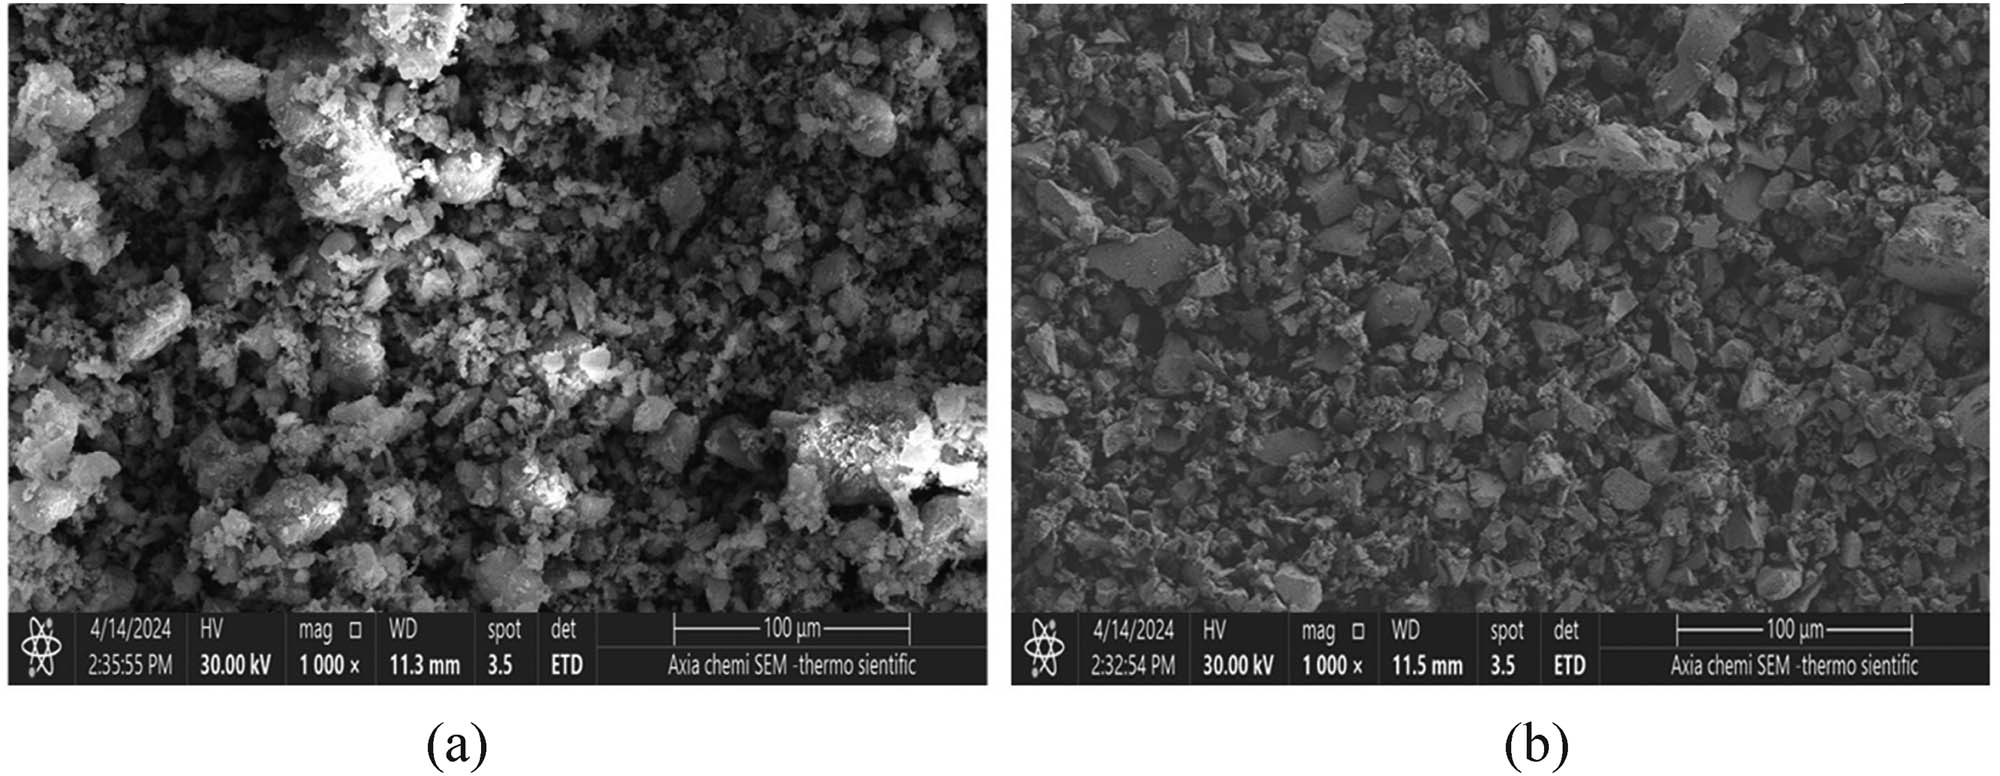
Figure 5
SEM images of (a) raw WBP and (b) raw GGBS.
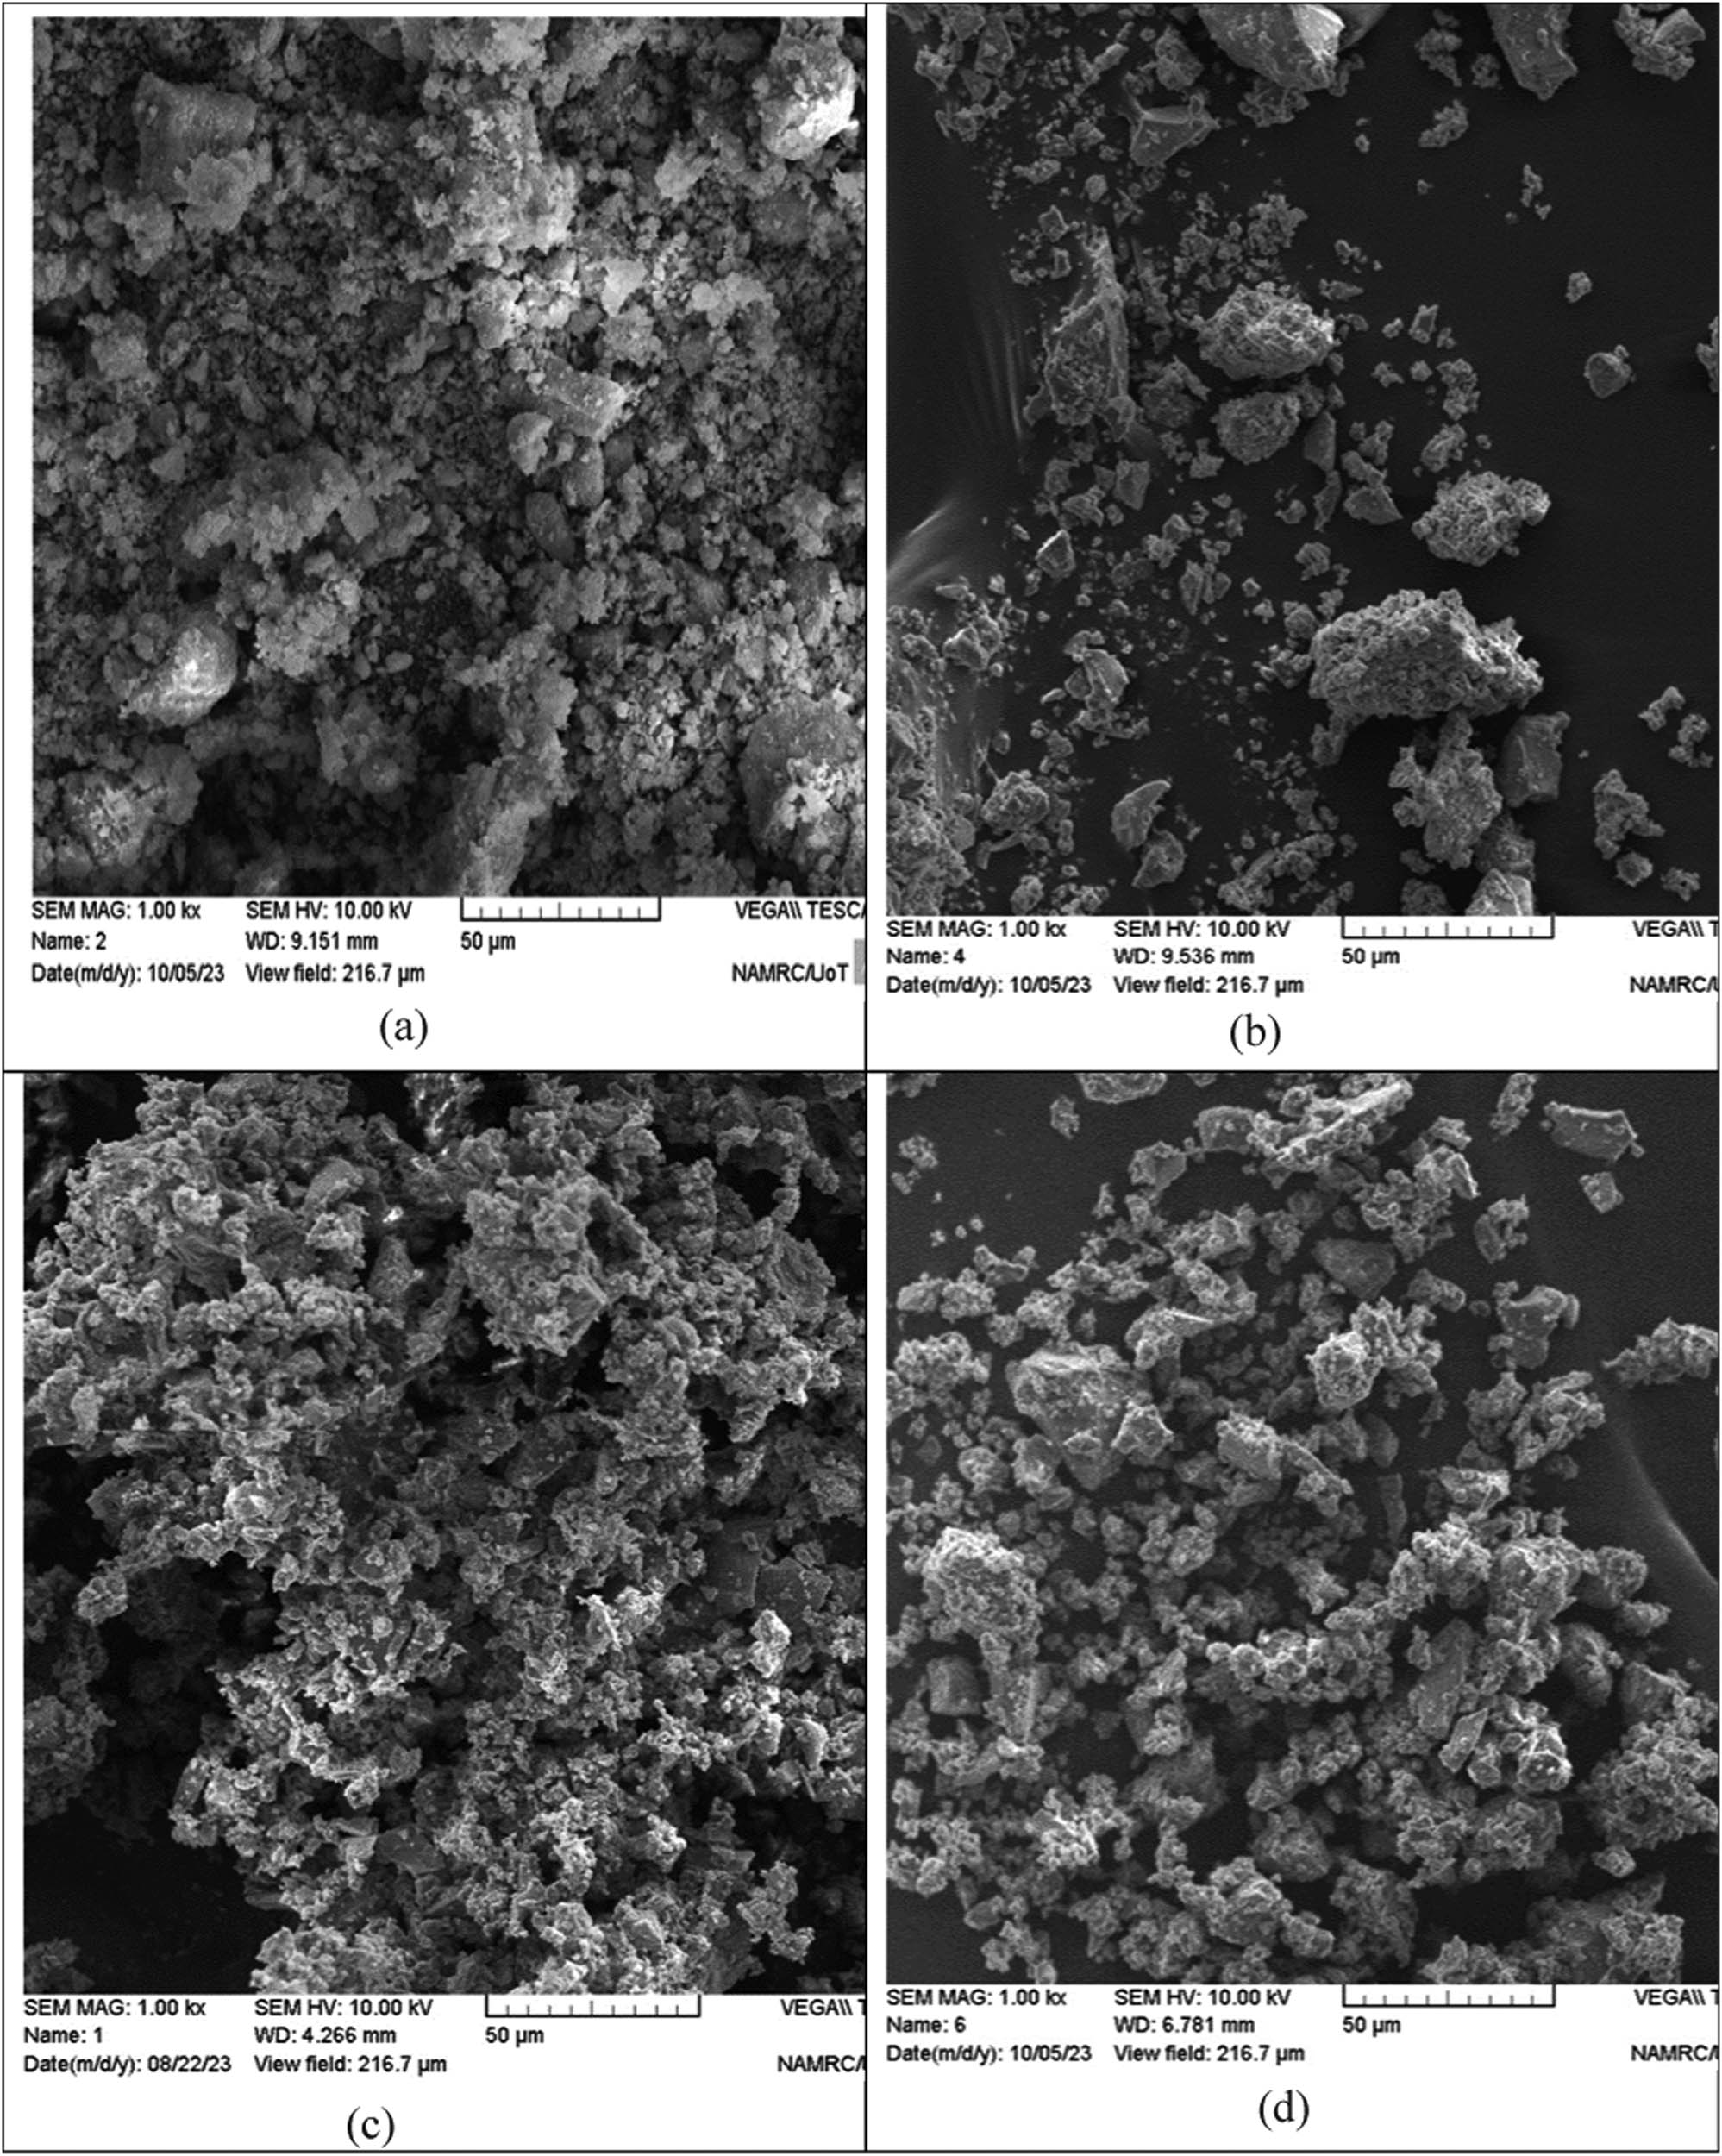
Figure 6
SEM images of (a) MG-0S-100B, (b) MG-15S-85B, (c) MG-30S-70B, and (d) MG-45S-55B.
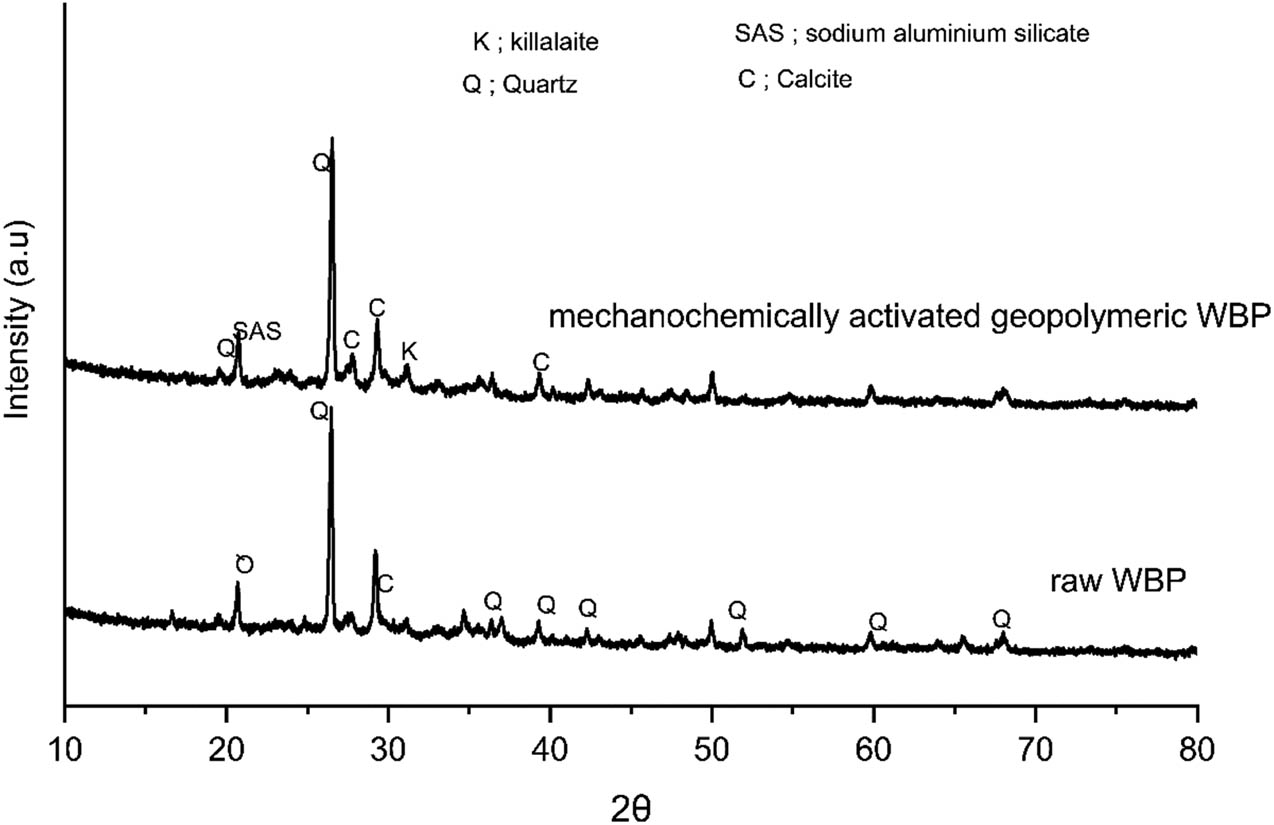
Figure 7
XRD patterns of raw WBP and WBP-based MG precursor.
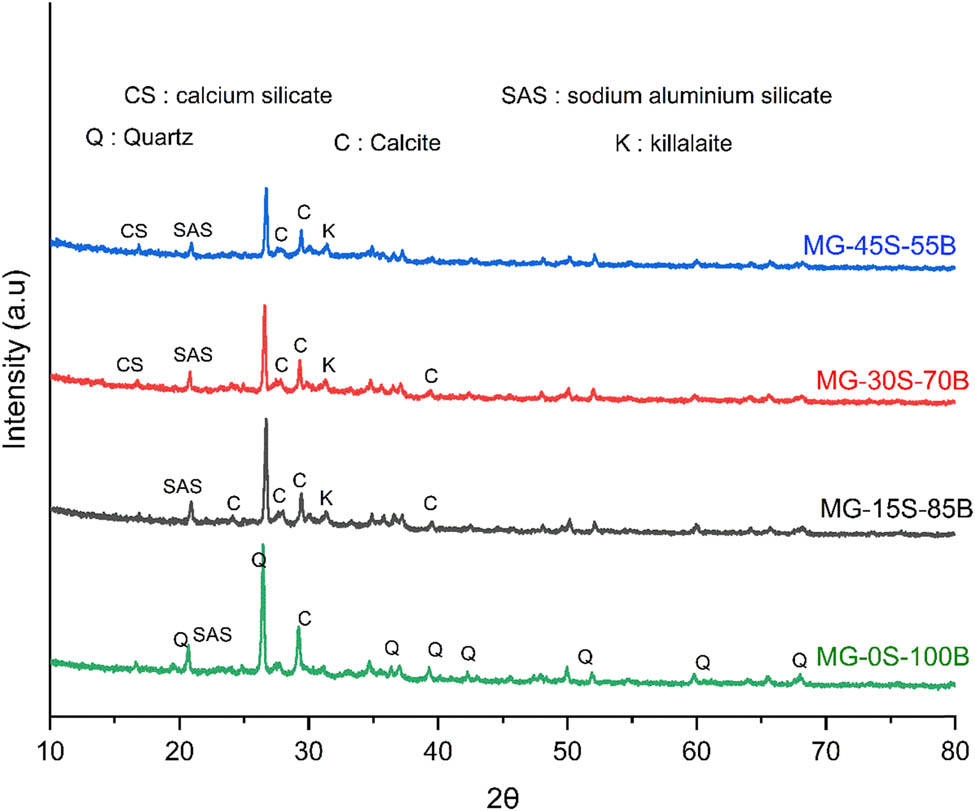
Figure 8
Effect of GGBS substitution on the XRD of the WBP-based MG precursor.
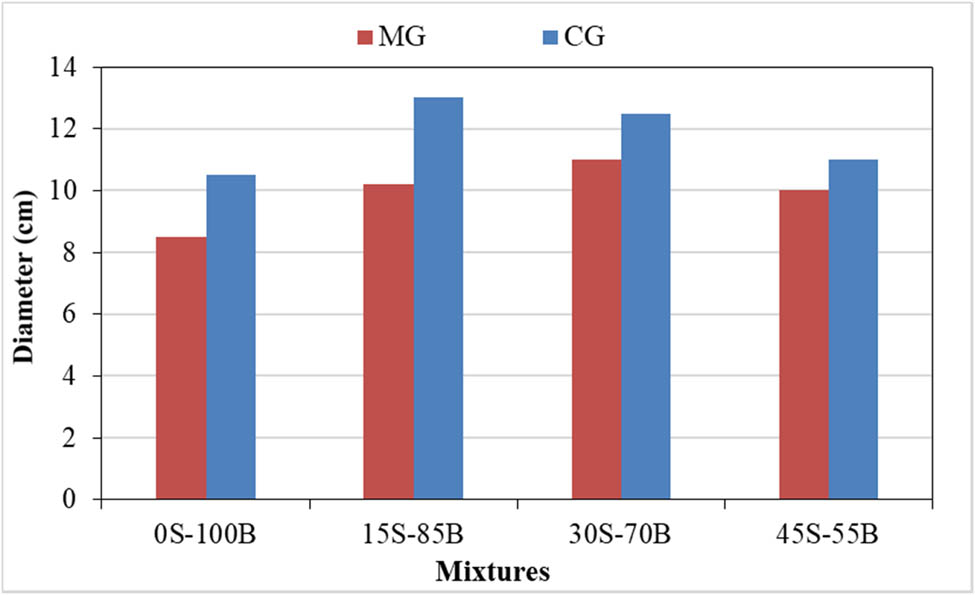
Figure 9
Workability of mechanochemical and conventional activation of mixtures.
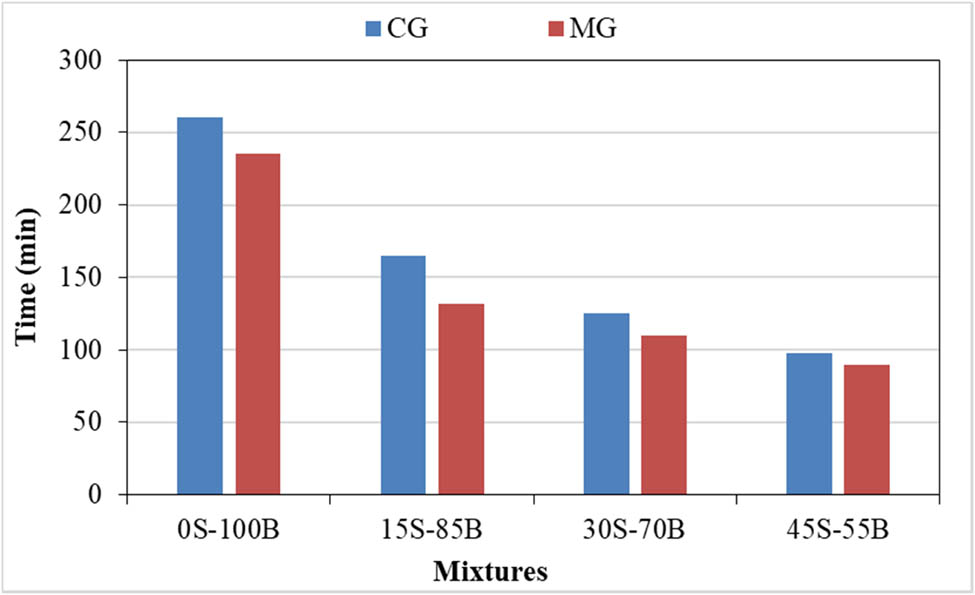
Figure 10
Final setting times of mechanochemical and conventional mixtures.
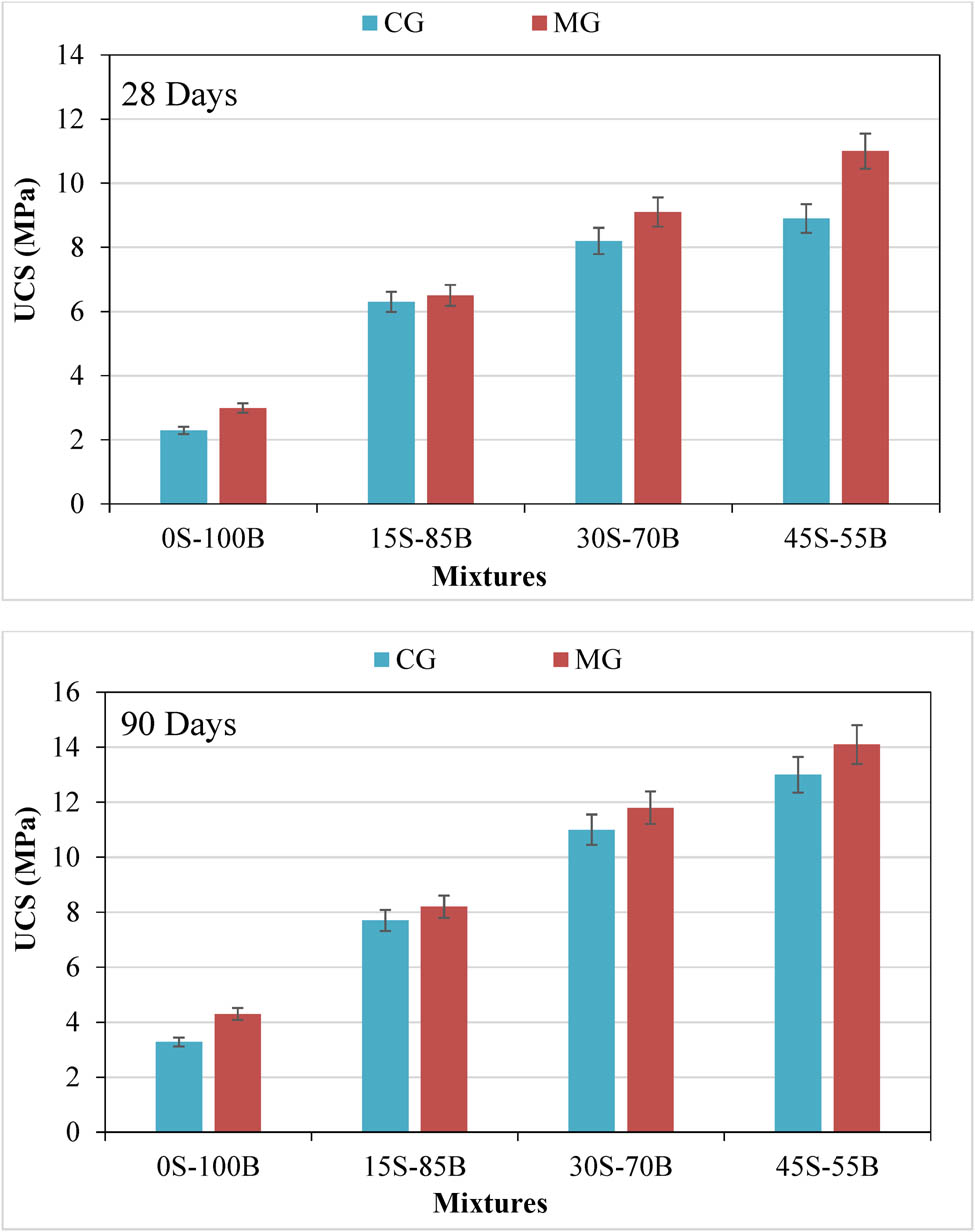
Figure 11
UCS of MG- and CG-based grout: 28 days and 90 days.
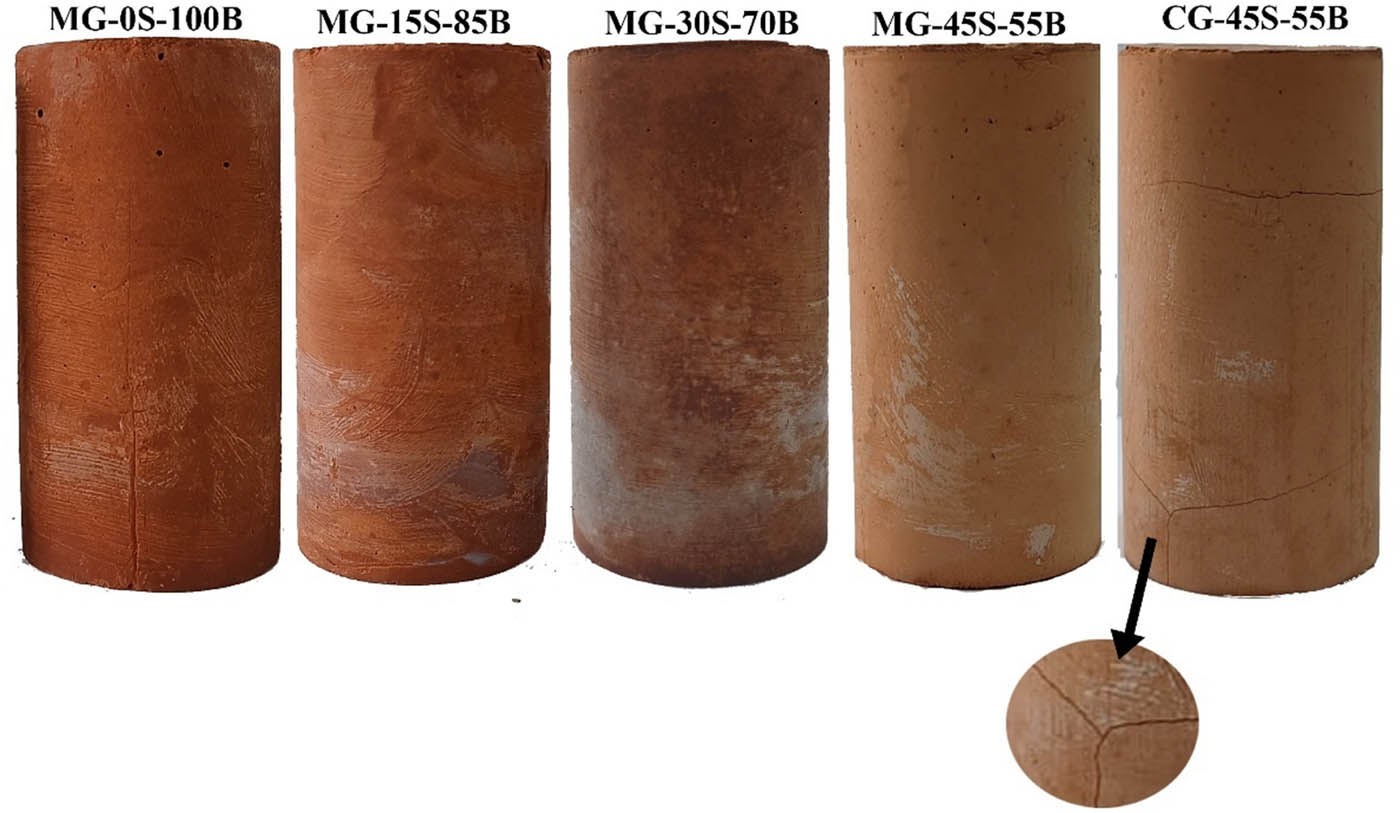
Figure 12
Surface images of MG- and CG-based grouts.
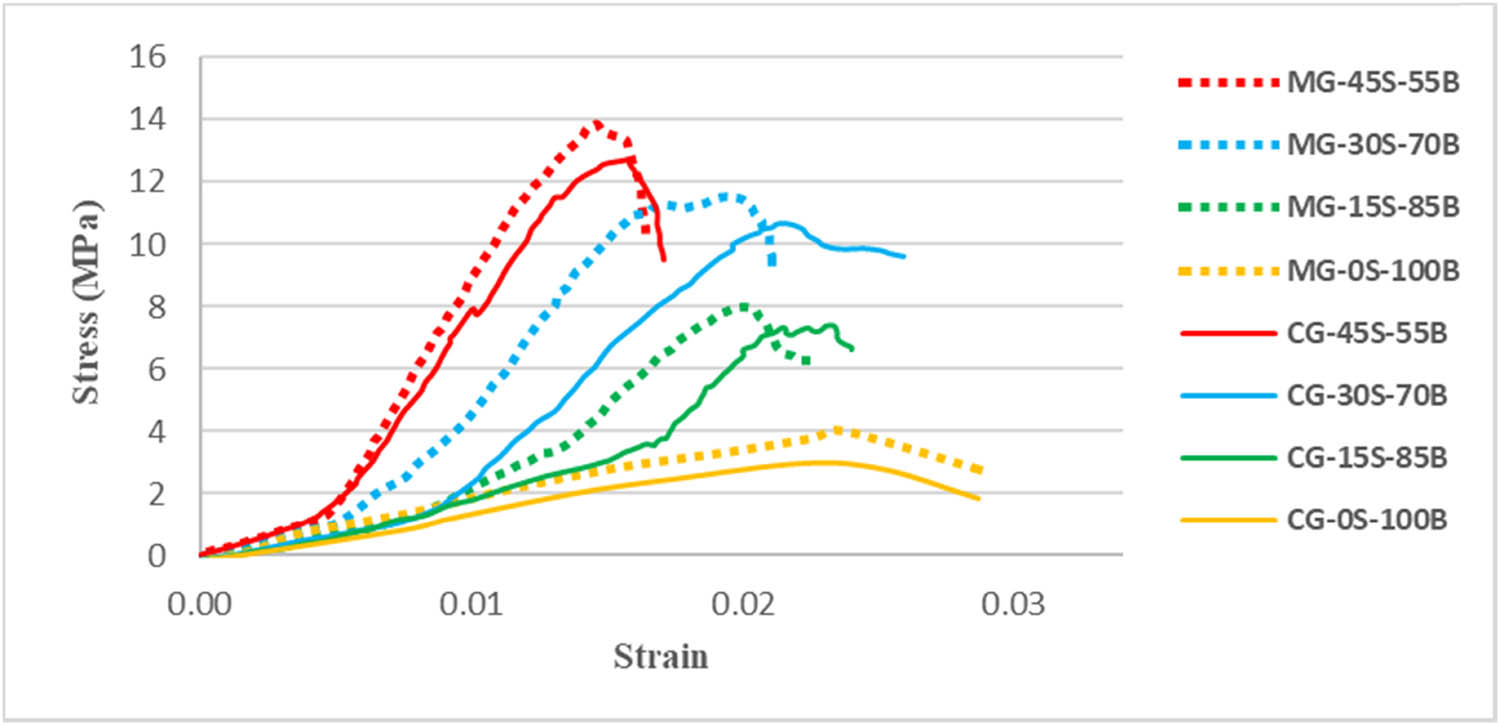
Figure 13
Stress–strain responses of mixtures.
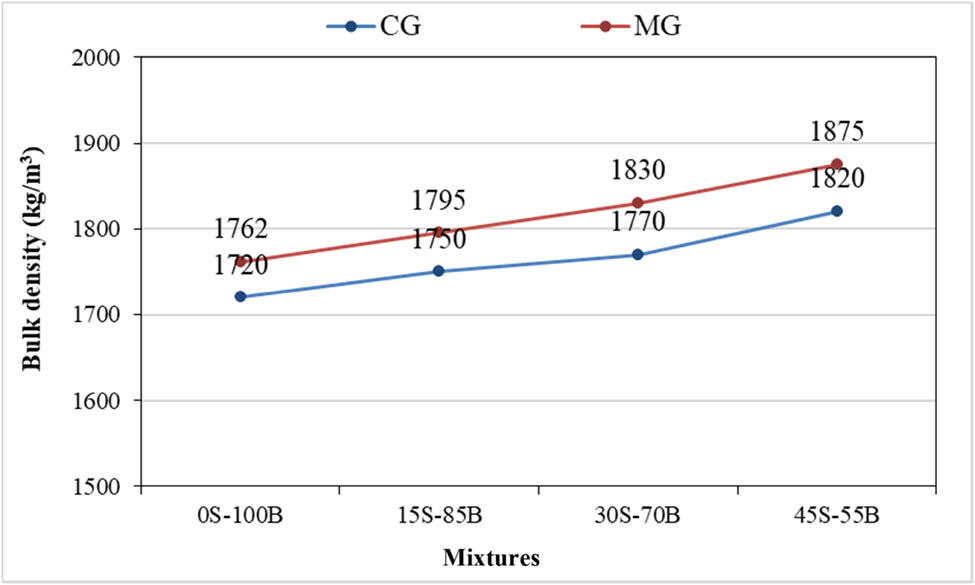
Figure 14
Bulk density of MG- and CG-based grouts.
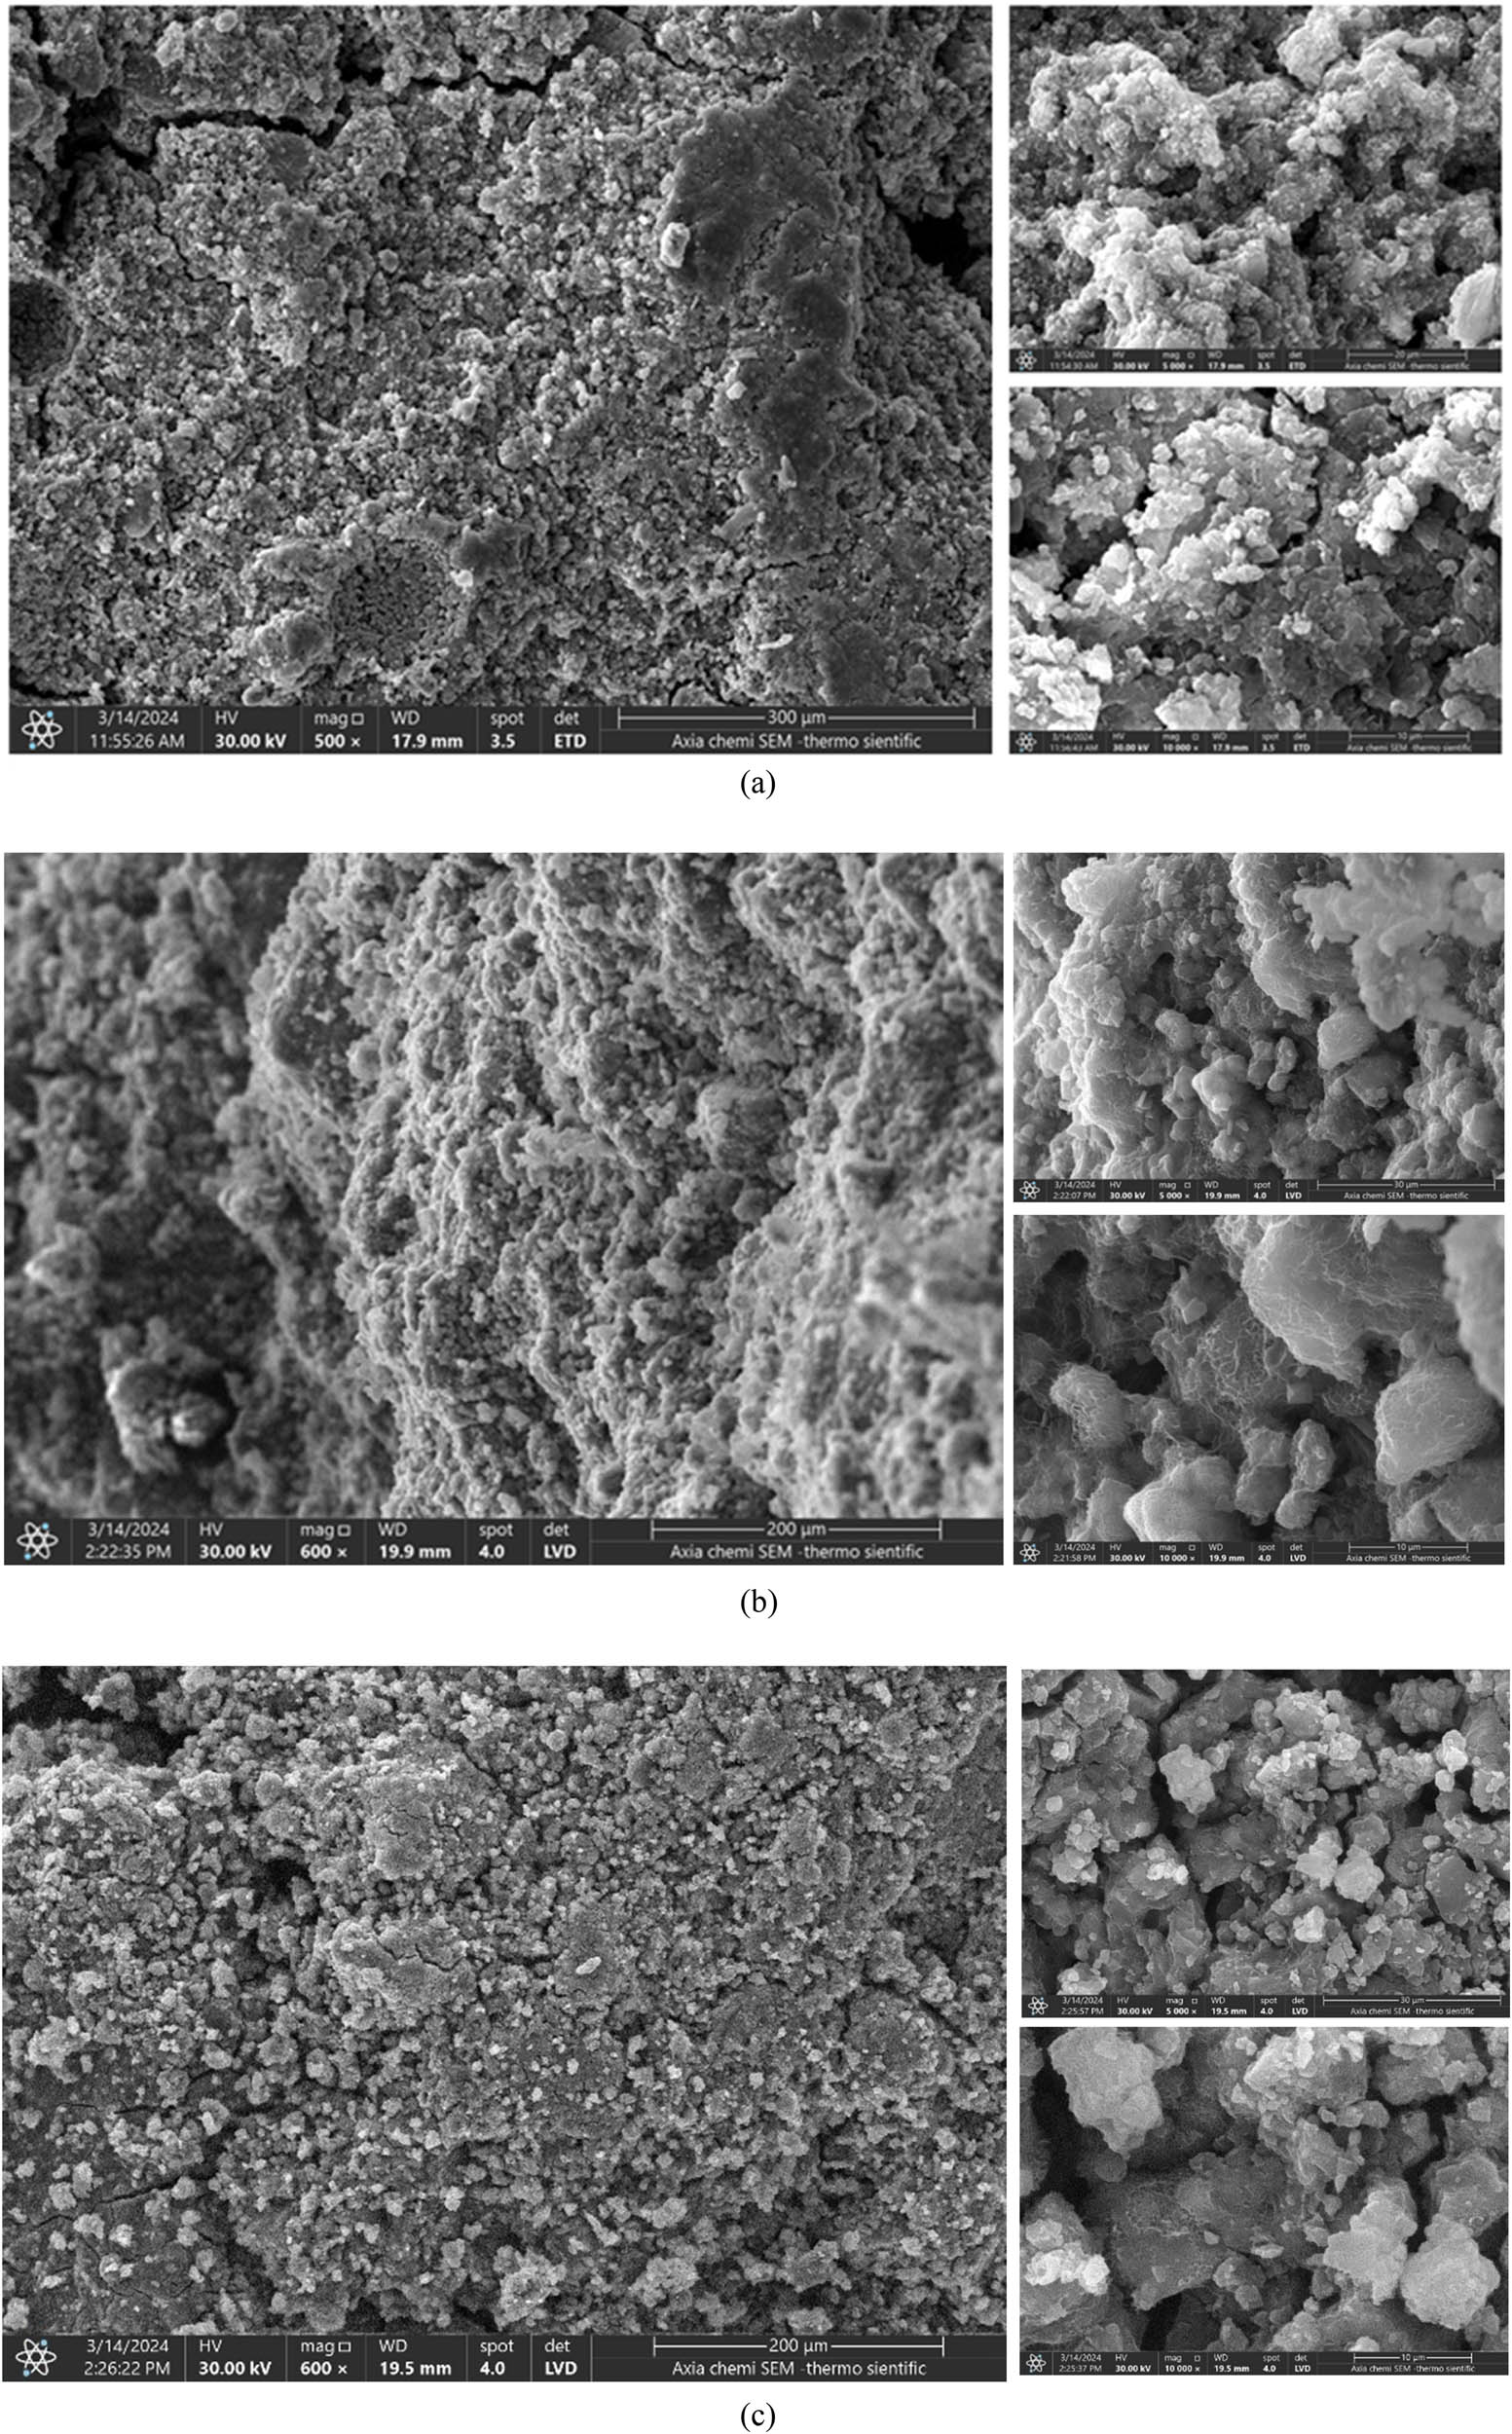
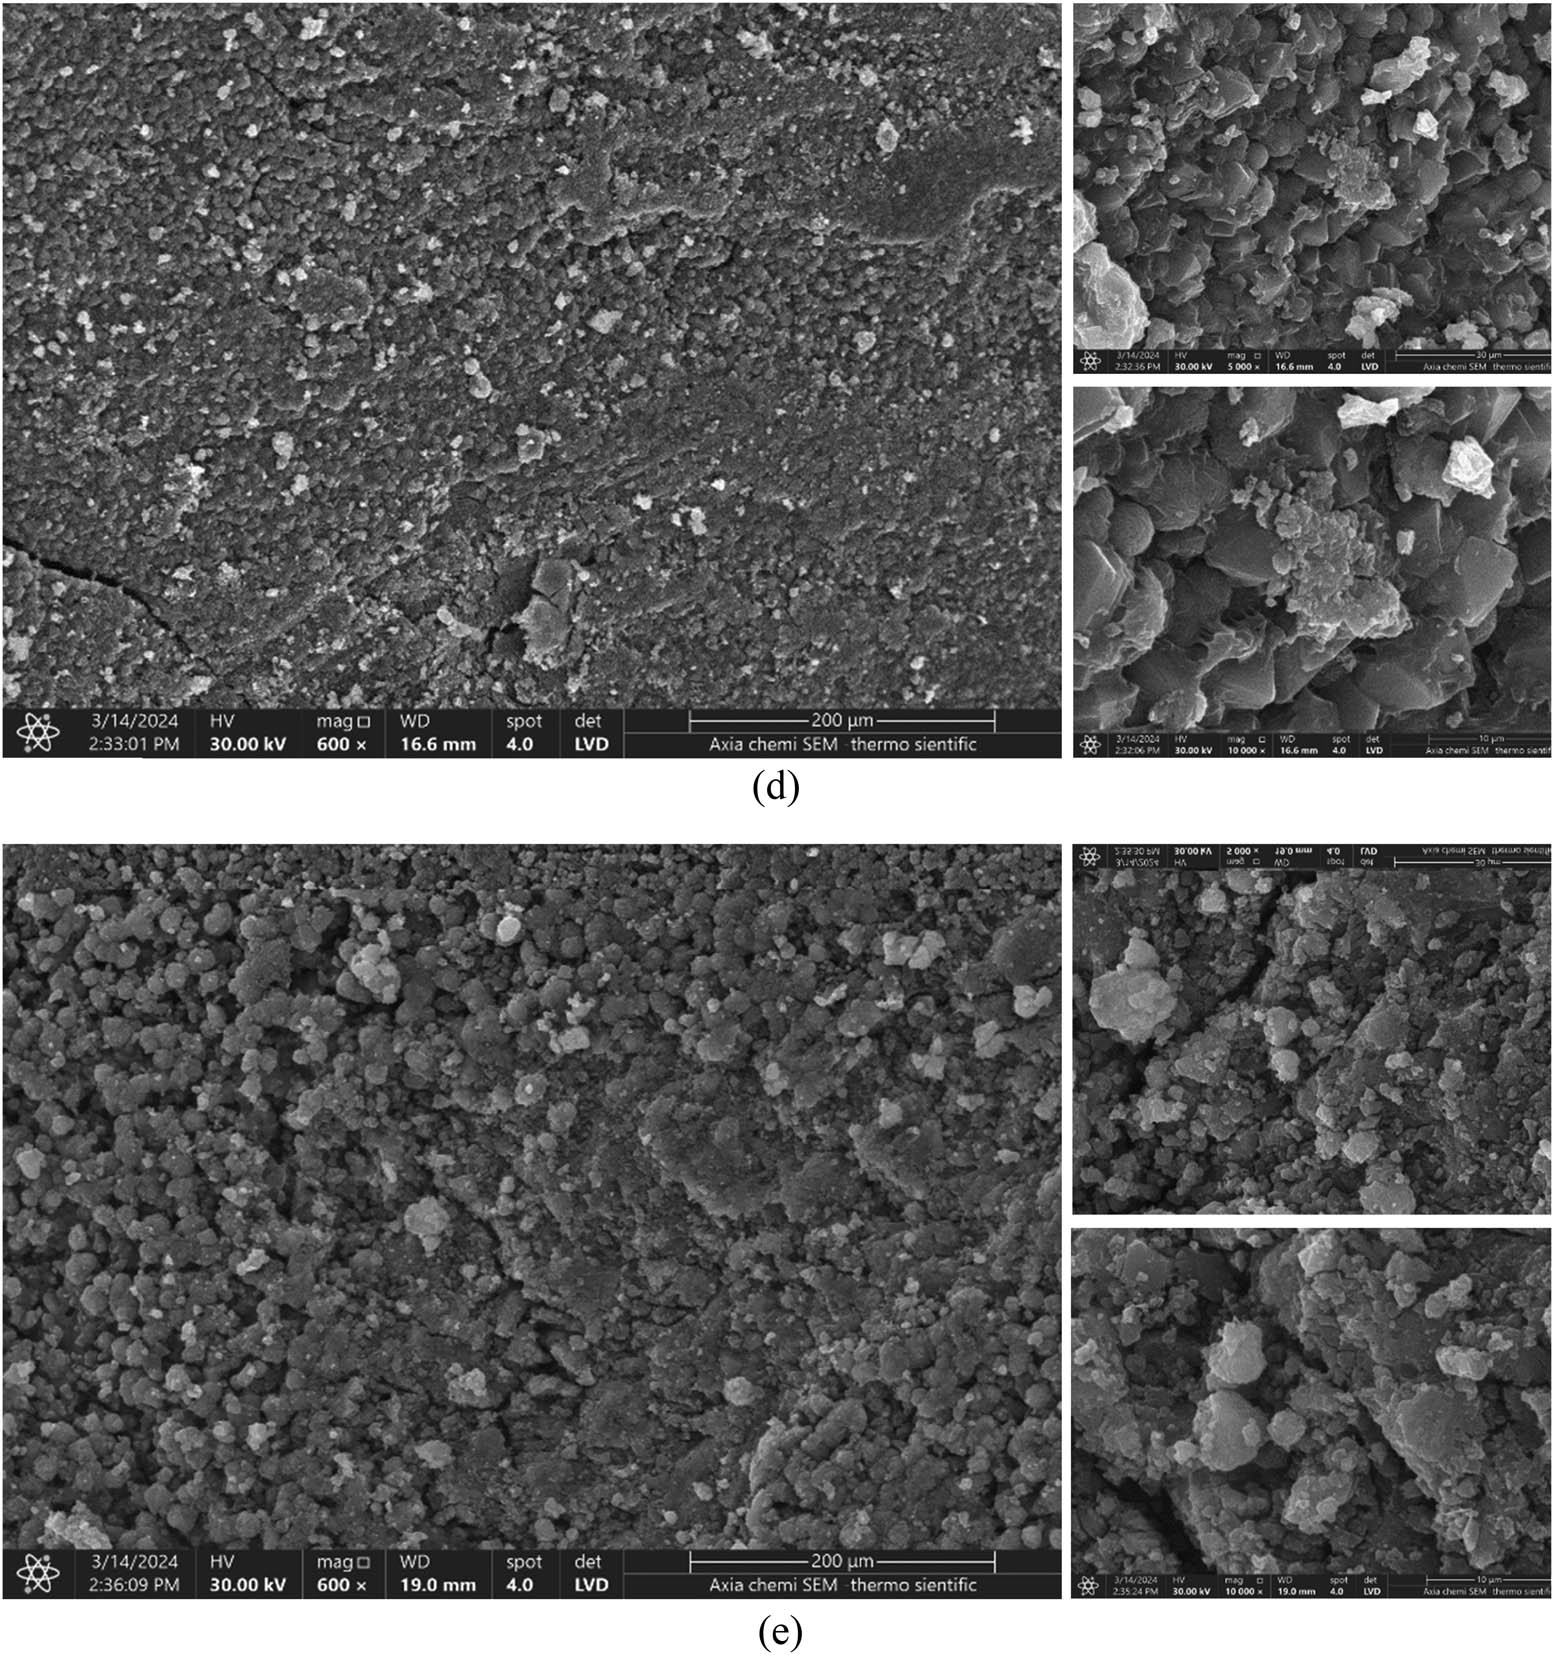
Figure 15
SEM images of the (a–e) hardened grouts ((a, b, c, d) MG and (e) CG). (a) MG-0S-100B, (b) MG-30S-70B, (c) MG-15S-85B, (d) MG-45S-55B, and (e) CG-45S-55B.
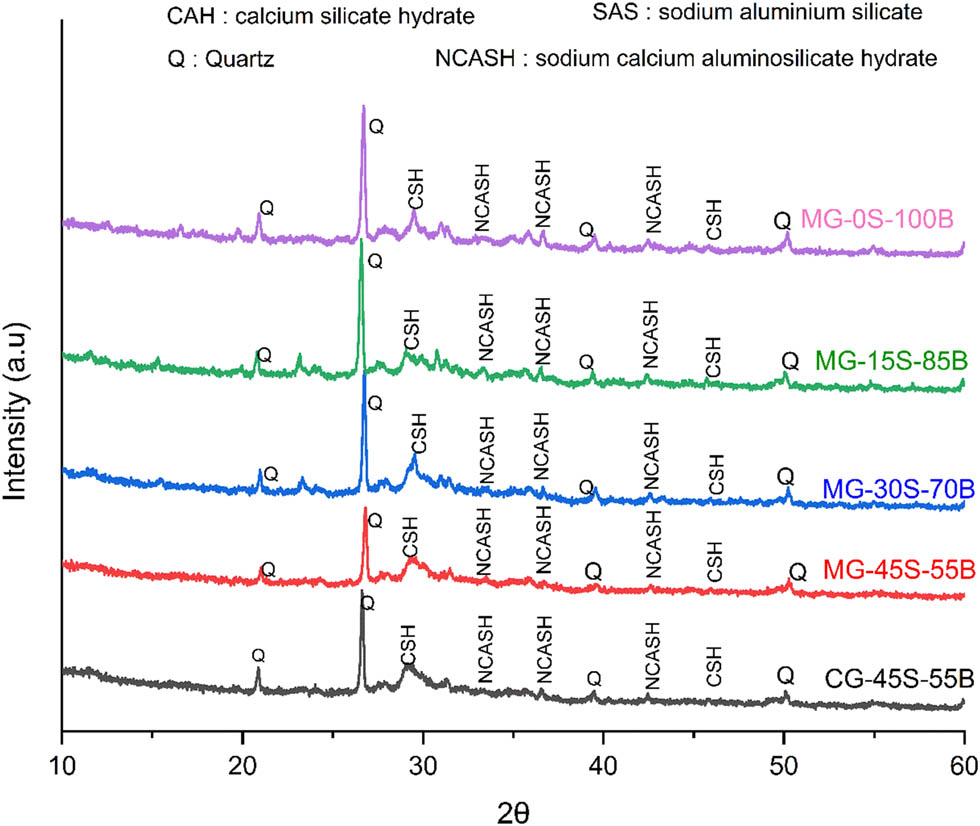
Figure 16
XRD patterns of CG- and MG-based grout samples.
Table 3
Results of TCLP analysis.
| Sample name | Pb | Cd | Cr | Zn | Cu | Ni | As |
|---|---|---|---|---|---|---|---|
| EPA limit (mg/L) | 5 | 1 | 5 | 25 | 25 | 25 | 5 |
| MG-45S-55B (mg/L) | 0.251 | 0.232 | 1.739 | 2.462 | 0.74 | 0.73 | Not detected |
| CG-45S-55B (mg/L) | 2.965 | 0.102 | 2.724 | 1.642 | 0.96 | <0.01 | Not detected |
| GGBS (mg/L) | <0.01 | 0.013 | 0.076 | Not detected | 0.025 | 0.02 | <0.01 |
| WBP (mg/L) | <0.01 | 0.019 | 0.672 | 1.246 | 0.5 | 1.697 | <0.01 |